Blog
 Albert RobertsonBearish
Leading Indicators in Trading: How They Differ From Lagging Indicators
Leading indicators try to flag a possible shift in momentum or direction before it fully shows up in price, while lagging indicators confirm a move after it's already underway. This guide covers how each type works, common examples like RSI and MACD, and why traders often combine both.
 Albert RobertsonBearish
PCE vs CPI: What's the Difference and Why Does the Fed Prefer PCE?
PCE and CPI both track US consumer inflation, but differ in coverage, weighting, and data sources. This guide covers what each index measures, why their values can diverge, and why the Fed relies on PCE for its long-run inflation goal.
 Albert RobertsonBearish
Coefficient of Variation: Comparing Risk Across Assets of Different Scale
Two assets can look similarly risky on paper, but be nothing of the sort in reality. Standard deviation counts the wobble, but pays no mind to the size of the thing doing the ‘wobbling’. That’s where a coefficient of variation (CV) is useful. It puts the risk and reward in one fraction, and might help your trading or investing.
 Diego FernándezBearish
CAGR Explained: How to Calculate Compound Annual Growth Rate
An investment fund promises an average annual return of 12%. After five years, you have 10,000 growing to 15,470. Both figures are correct and refer to the same investment. The discrepancy between them is 2,150 and figuring out where it comes from is the key idea of this article.
 Albert RobertsonBearish
What Is the Asset Turnover Ratio? Formula, Calculation and Interpretation
How much selling can a company get, out of the stuff that it owns? This is the question people ask when they determine the asset turnover ratio. On the surface, it’s a single line of arithmetic, but in reality, it can easily determine the direction of an investment or a trade.
 Eric BriggsBearish
What Is RENDER/RNDR Crypto? Render Network, Token Utility and Why High-Tech Tokens Attract Traders
Two tickers, one project, and no end of old pages nobody ever went back and put right. That is the bulk of the muddle behind what is RNDR crypto. RENDER is the project running the show presently, over on Solana network. RNDR is the Ethereum one it came out of.
 Diego FernándezBearish
Gordon Growth Model: Formula, How the Constant Dividend Growth Model Works and Its Limits
With three numbers and one line of mathematics you get the value of a share. That is the appeal. Problem is, changing one of those three numbers by one percentage point can change the answer by a third and nothing in the formula warns you about it. In this article we will analyze the formula and demonstrate why it is extremely unstable.
 Diego FernándezBearish
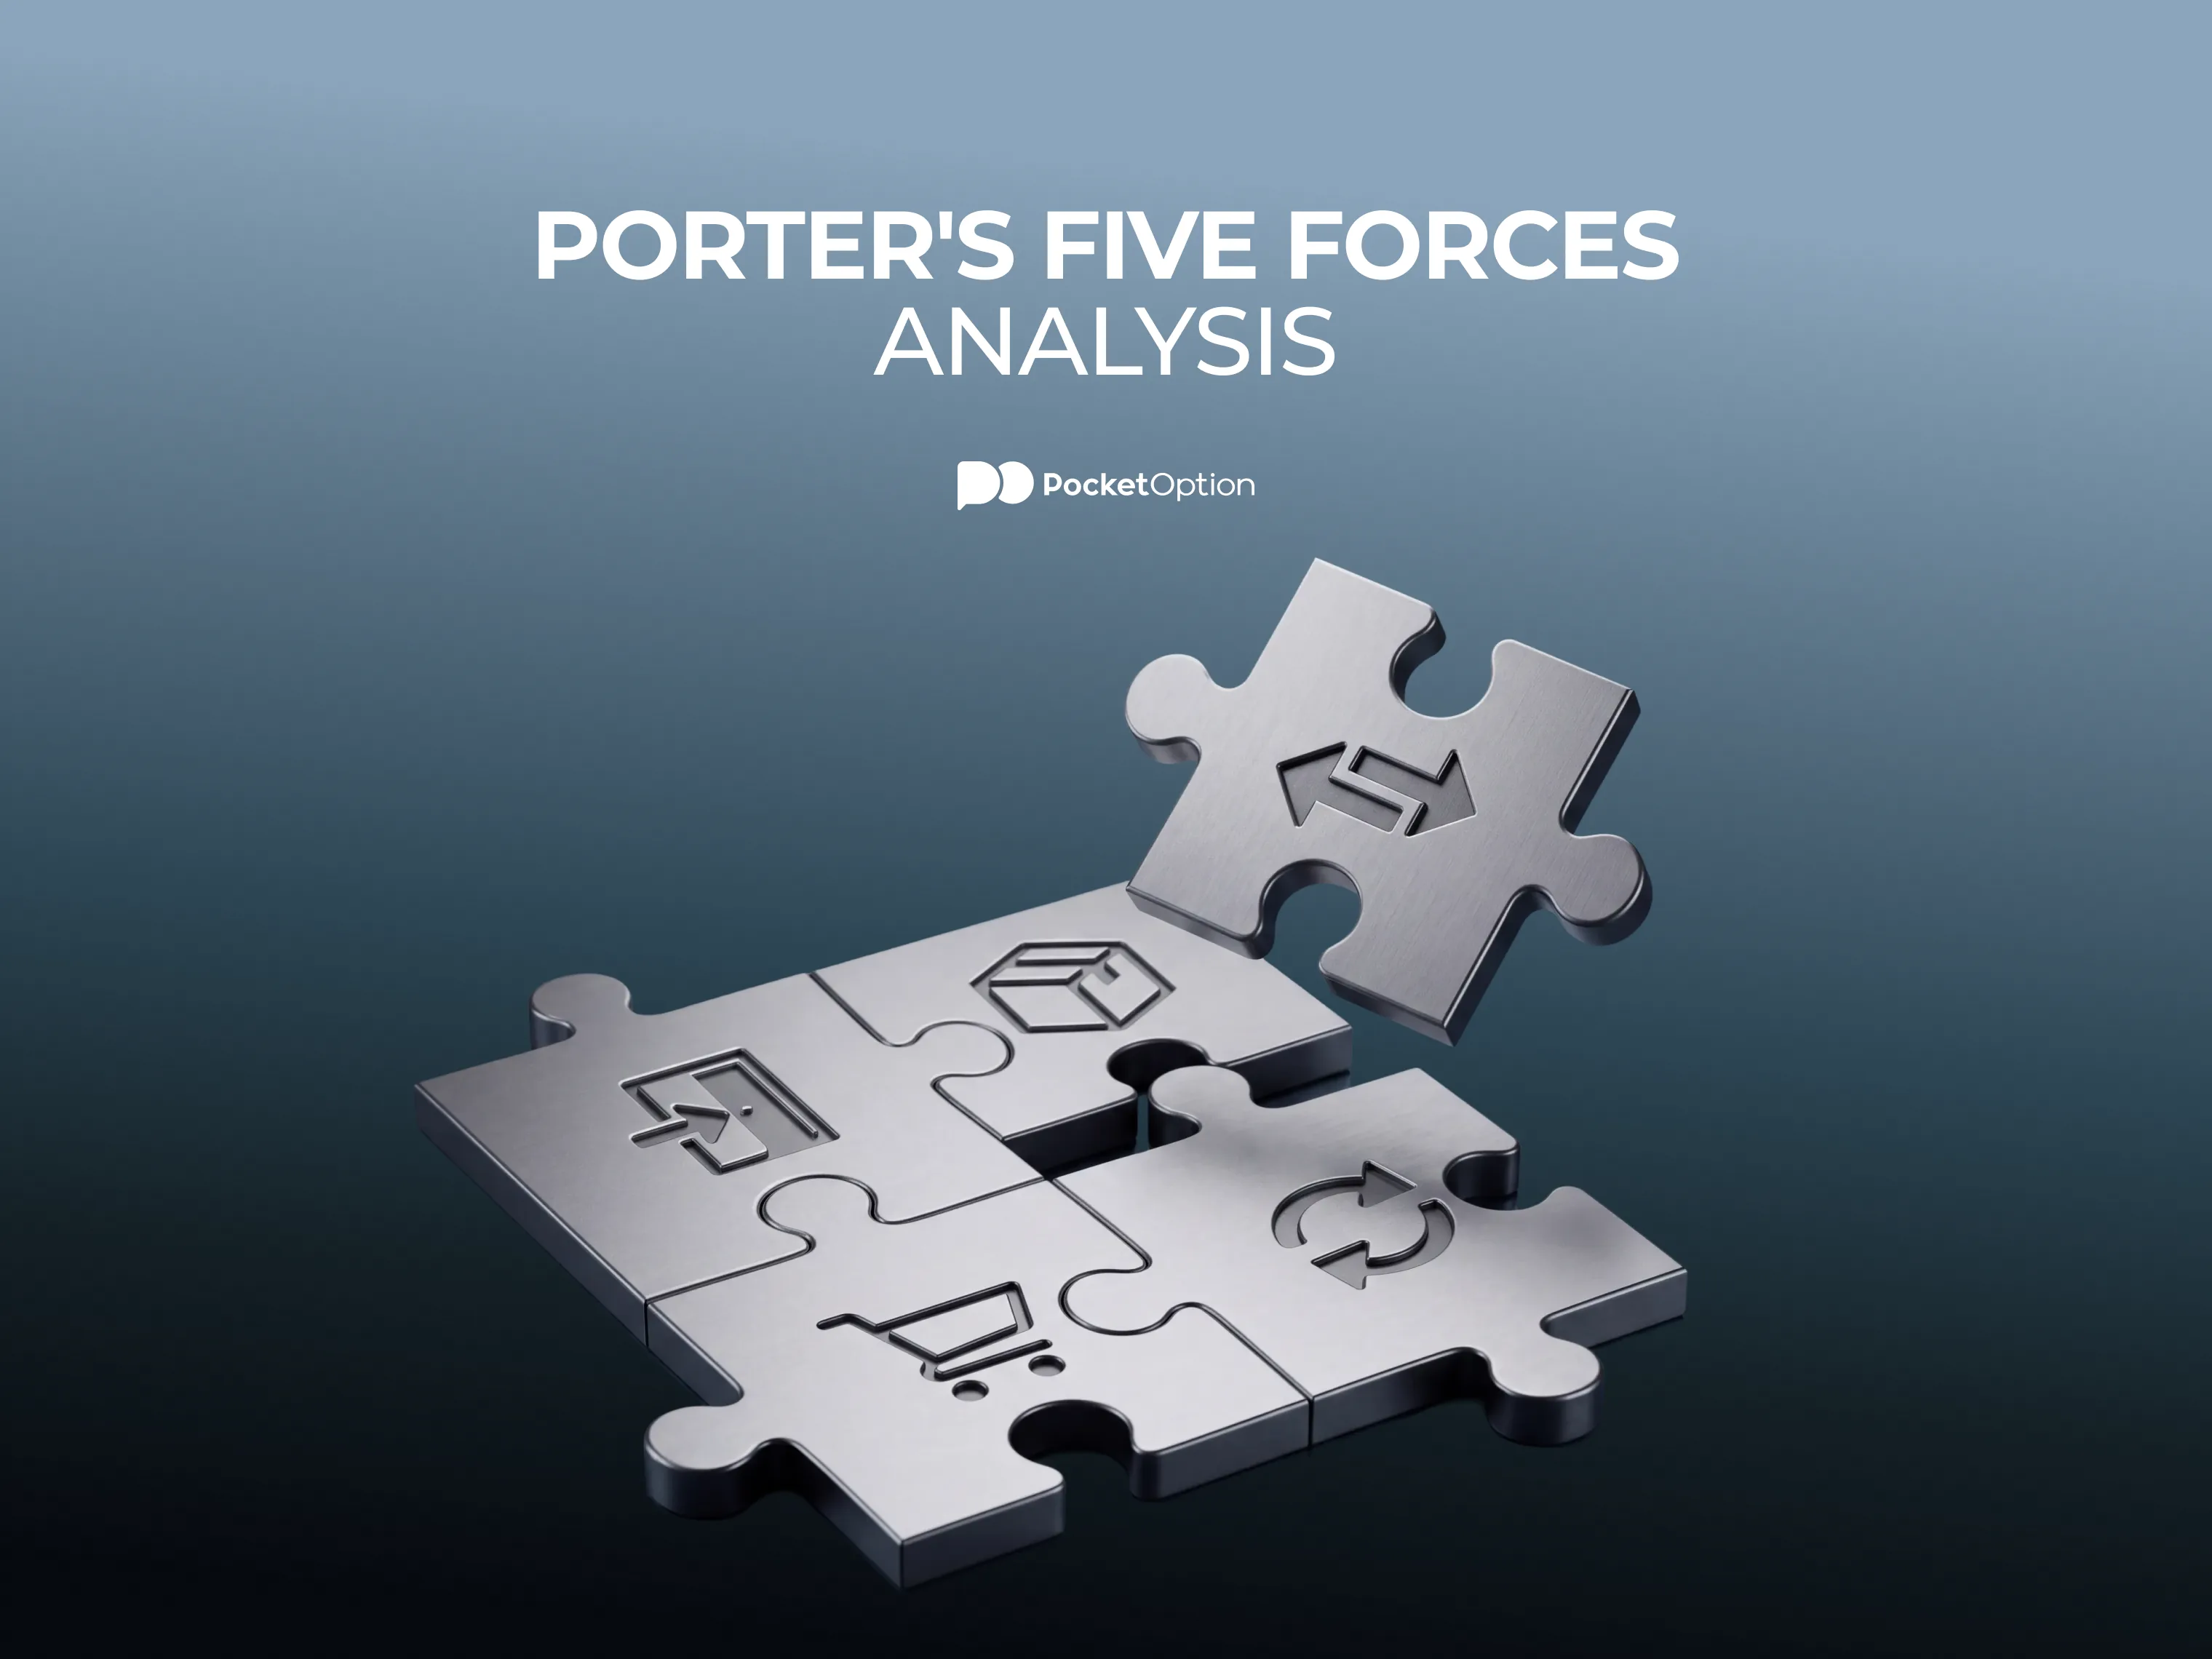
Porter's Five Forces Analysis: How the Model Works, Key Components and Real-World Use
Some industries are profitable by their nature whereas others tend to struggle despite good management. The reason behind this phenomenon lies in the structural nature of industries and not in their management. This model is used to identify the structure of an industry. It breaks down an industry into five competitive forces and measures the intensity of these factors.
 Albert RobertsonBearish
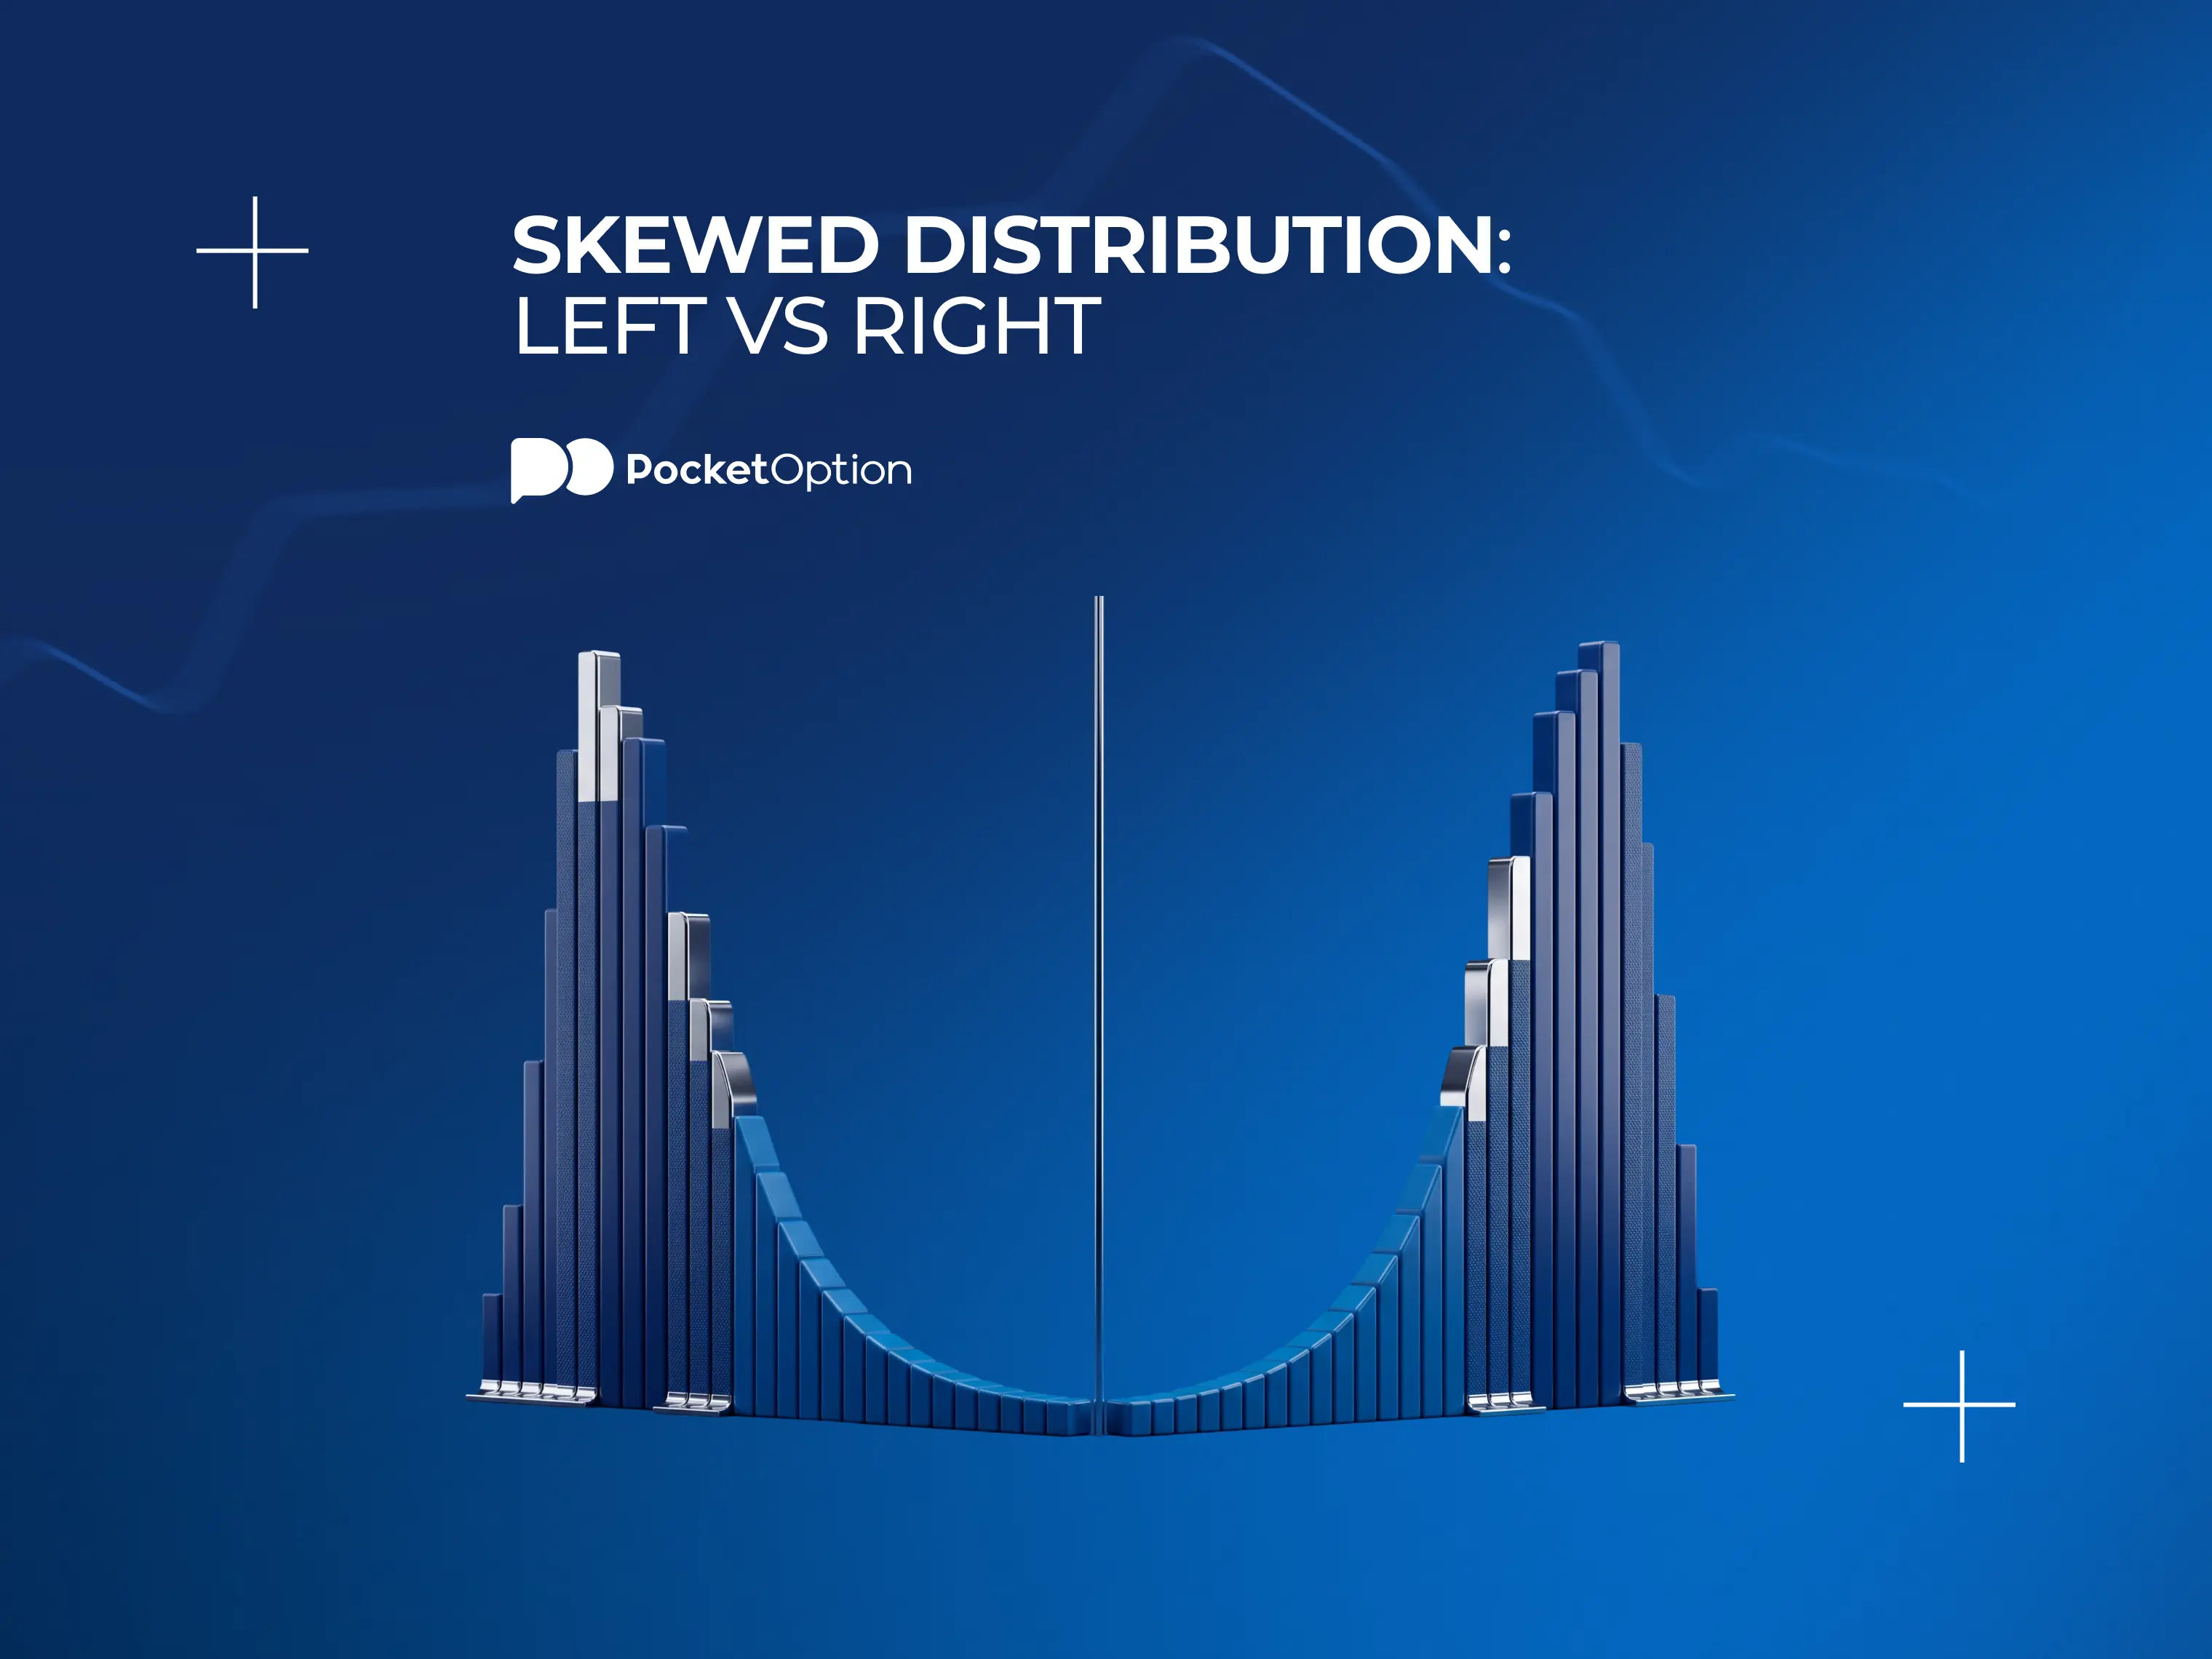
Skewed Distribution: Left-Skewed vs Right-Skewed Graphs
Where standard deviation shows how dispersed things are, skewness answers the question of where unexpected values originate, and this is generally the more relevant concern for anyone holding a position.
 Diego FernándezBearish
Price Elasticity of Demand: Definition, How It Works and Real-World Examples
Increase the price of petrol by 10% and the quantity purchased remains pretty much the same. Increase the price of one brand of crisps by 10% and the consumer switches brands. In both instances, a 10% change in price elicits very different reactions, and the measurement tool which describes the differences between the two is one of the most useful concepts in economics.
 Eric BriggsBearish
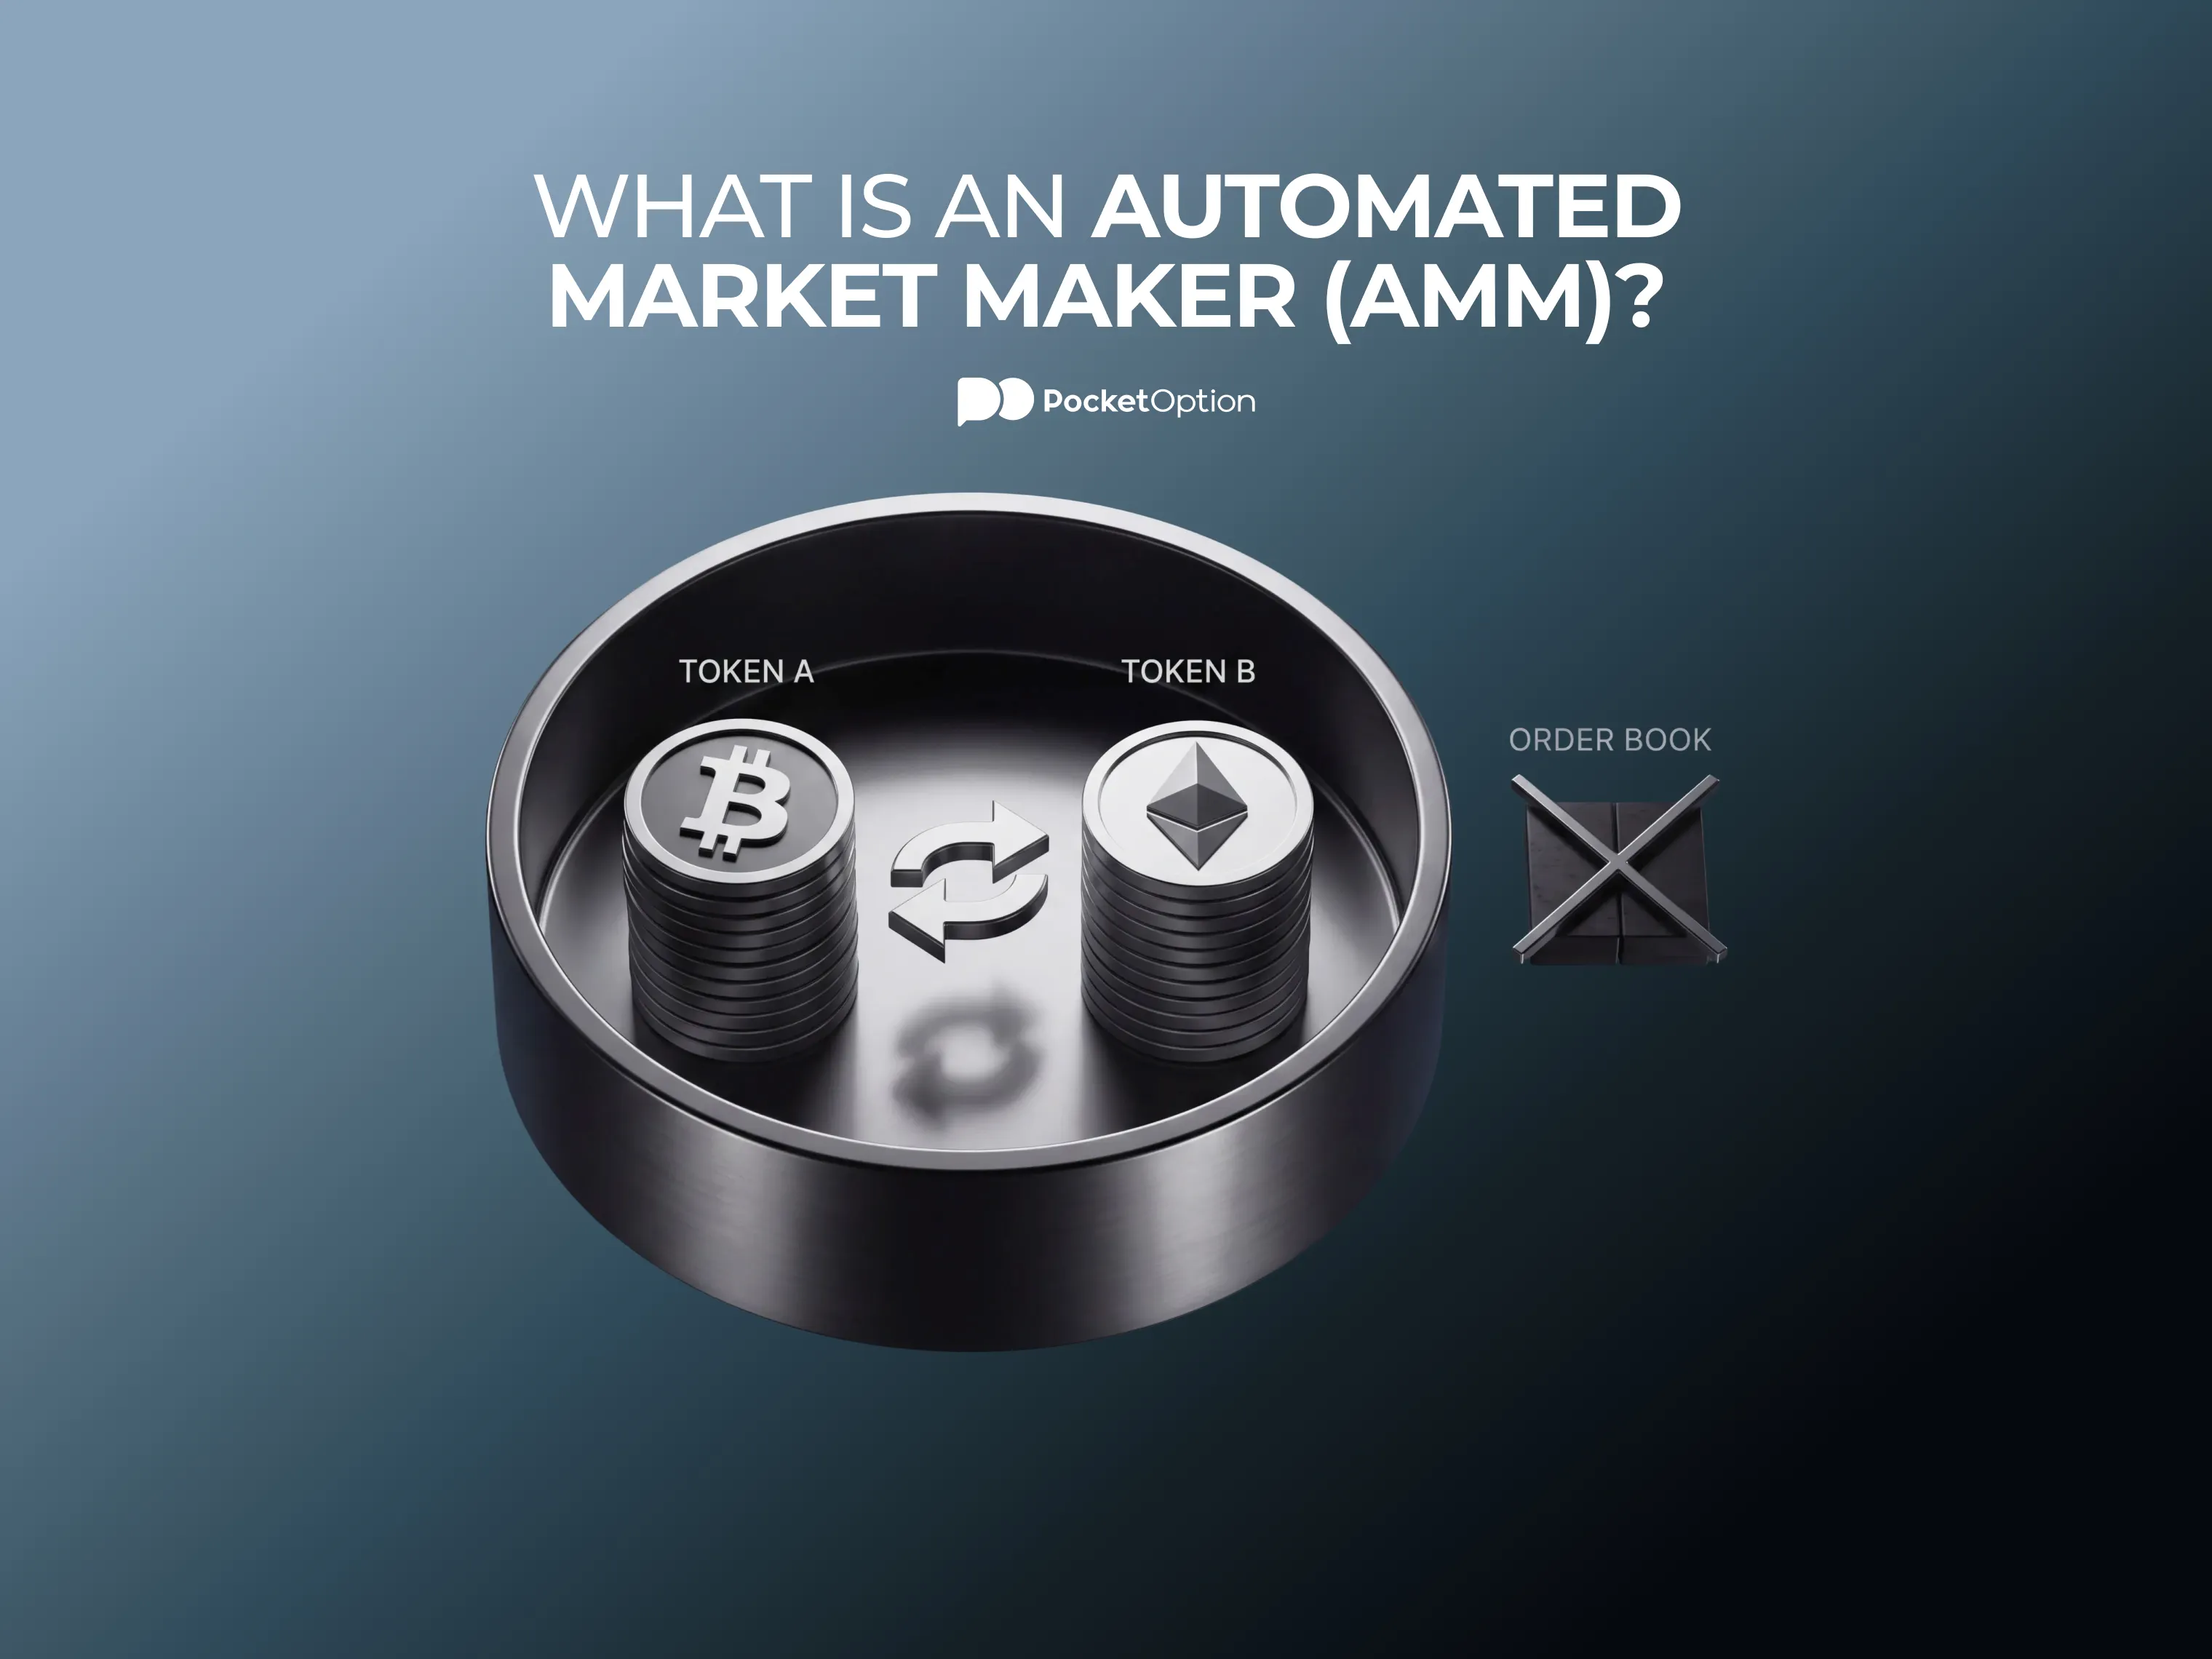
What Is an Automated Market Maker (AMM)? How AMMs Power DeFi Trading Without Order Books
No buyer waiting on the other side. No order book at all. Swap goes through anyway, at a rate nobody typed in anywhere. Catches people out the first time, and the answer is a bit of code sat on two piles of tokens, doing one sum.
 Diego FernándezBearish
What Good Faith Violation Is and How It Affects Your Stock Account
You execute a trade, then use the proceeds of this trade to purchase another security during the same day. You exit the position in less than a week. Your broker warns you that there is a good faith violation on your account. None of this is illegal. You just paid with money that hasn't settled yet. This is the GFV meaning in one sentence.
 Albert RobertsonBearish
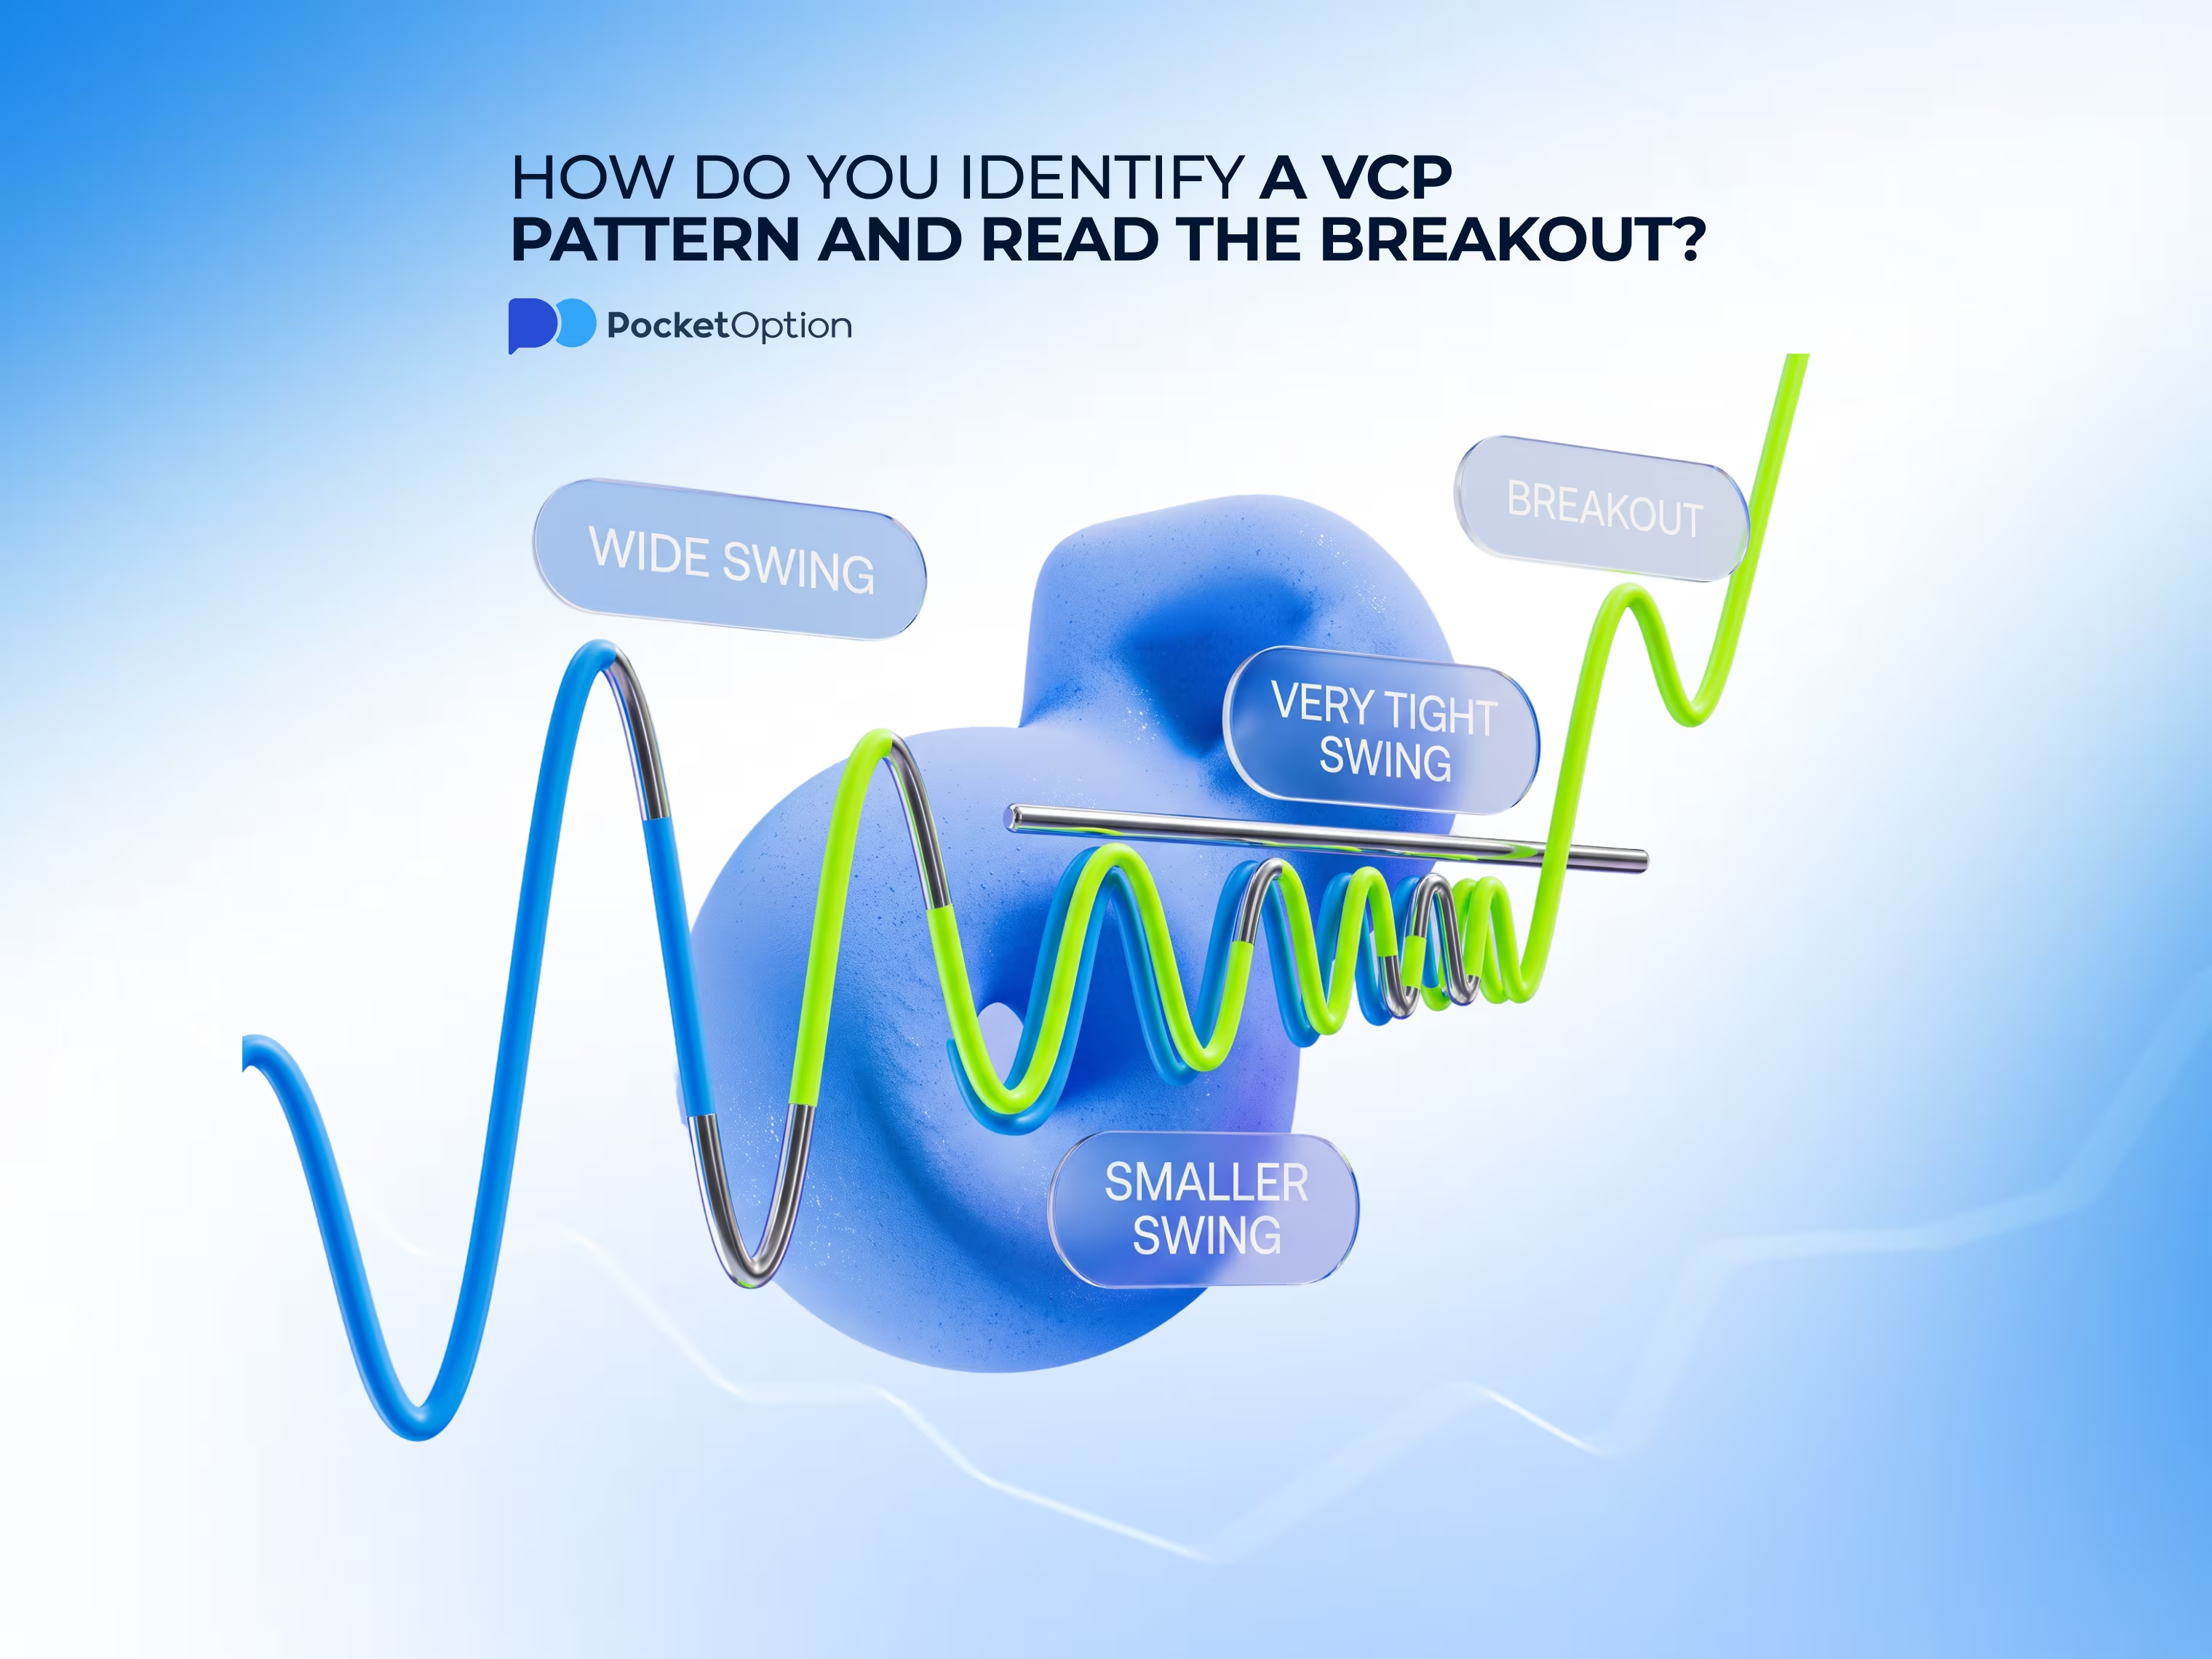
How Do You Identify a VCP Pattern and Read the Breakout?
A VCP pattern shows progressively tighter price contractions inside an uptrend, building toward a potential breakout. This guide covers the contraction sequence, volume, the pivot, and how false breakouts happen.
 Albert RobertsonBearish
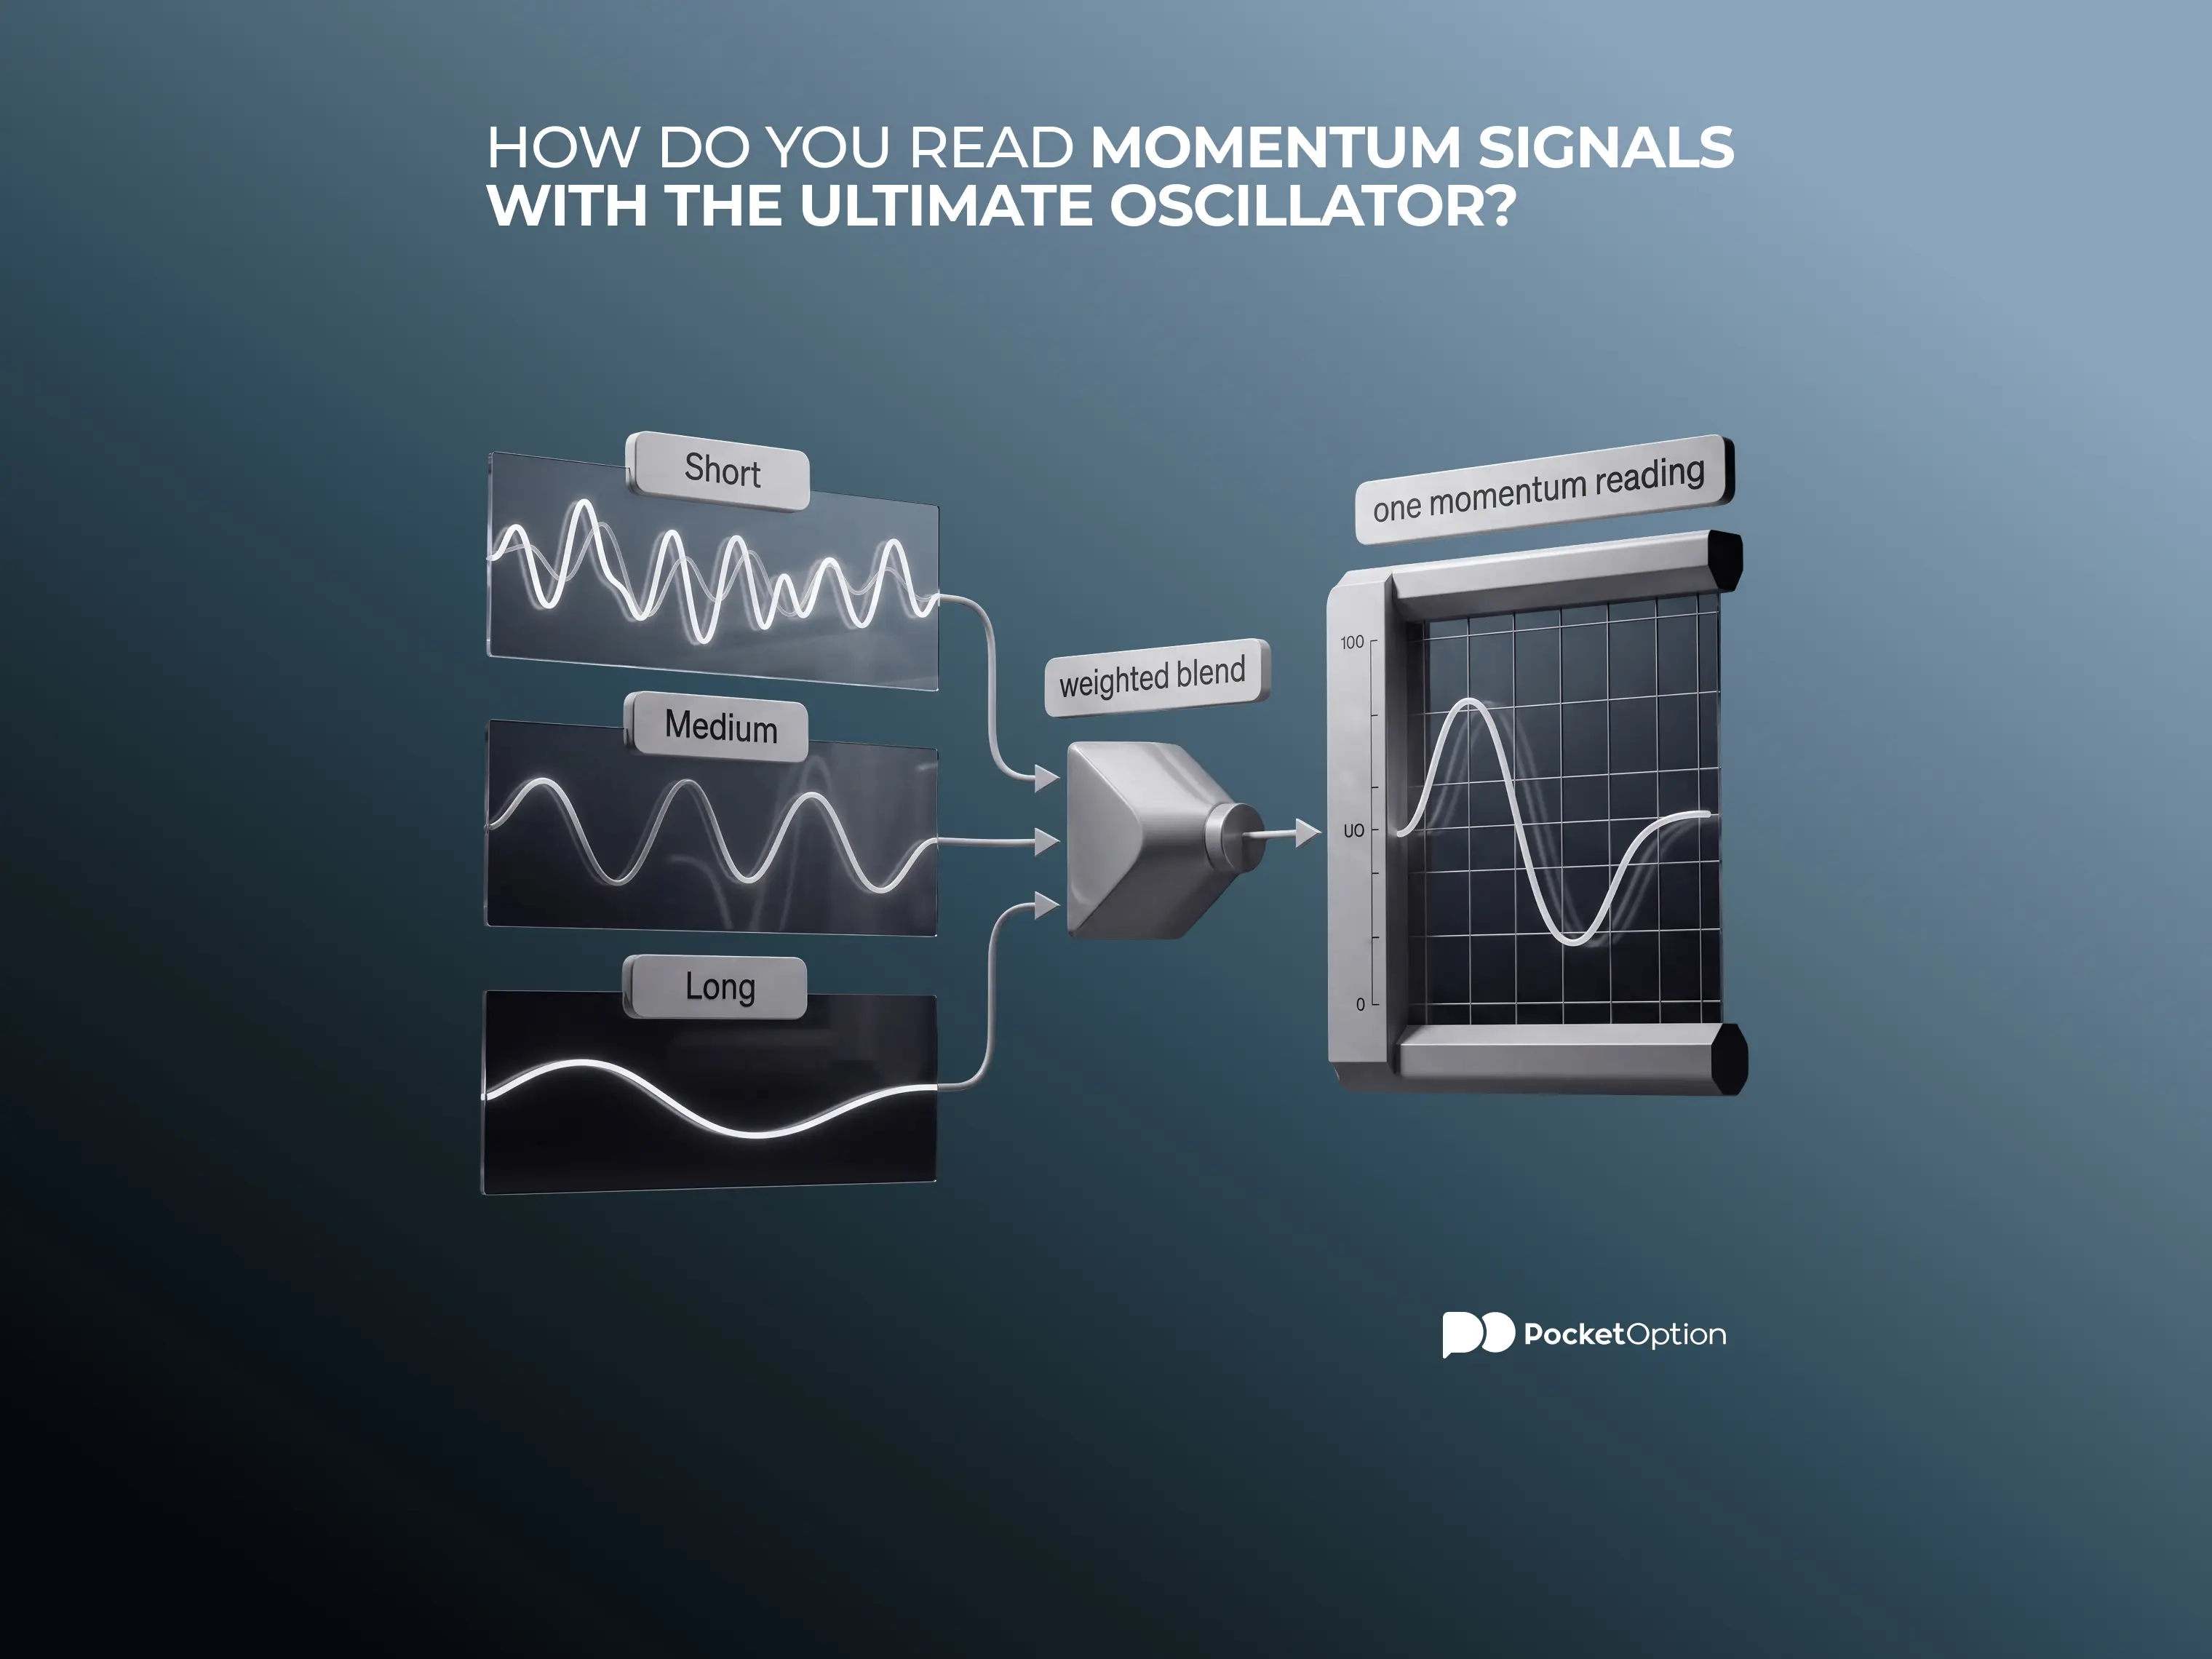
How Do You Read Momentum Signals With the Ultimate Oscillator?
The Ultimate Oscillator blends buying pressure across three time periods into one momentum reading. This guide covers the formula, the 30 and 70 reference levels, divergence, and its limits.
 Albert RobertsonBearish
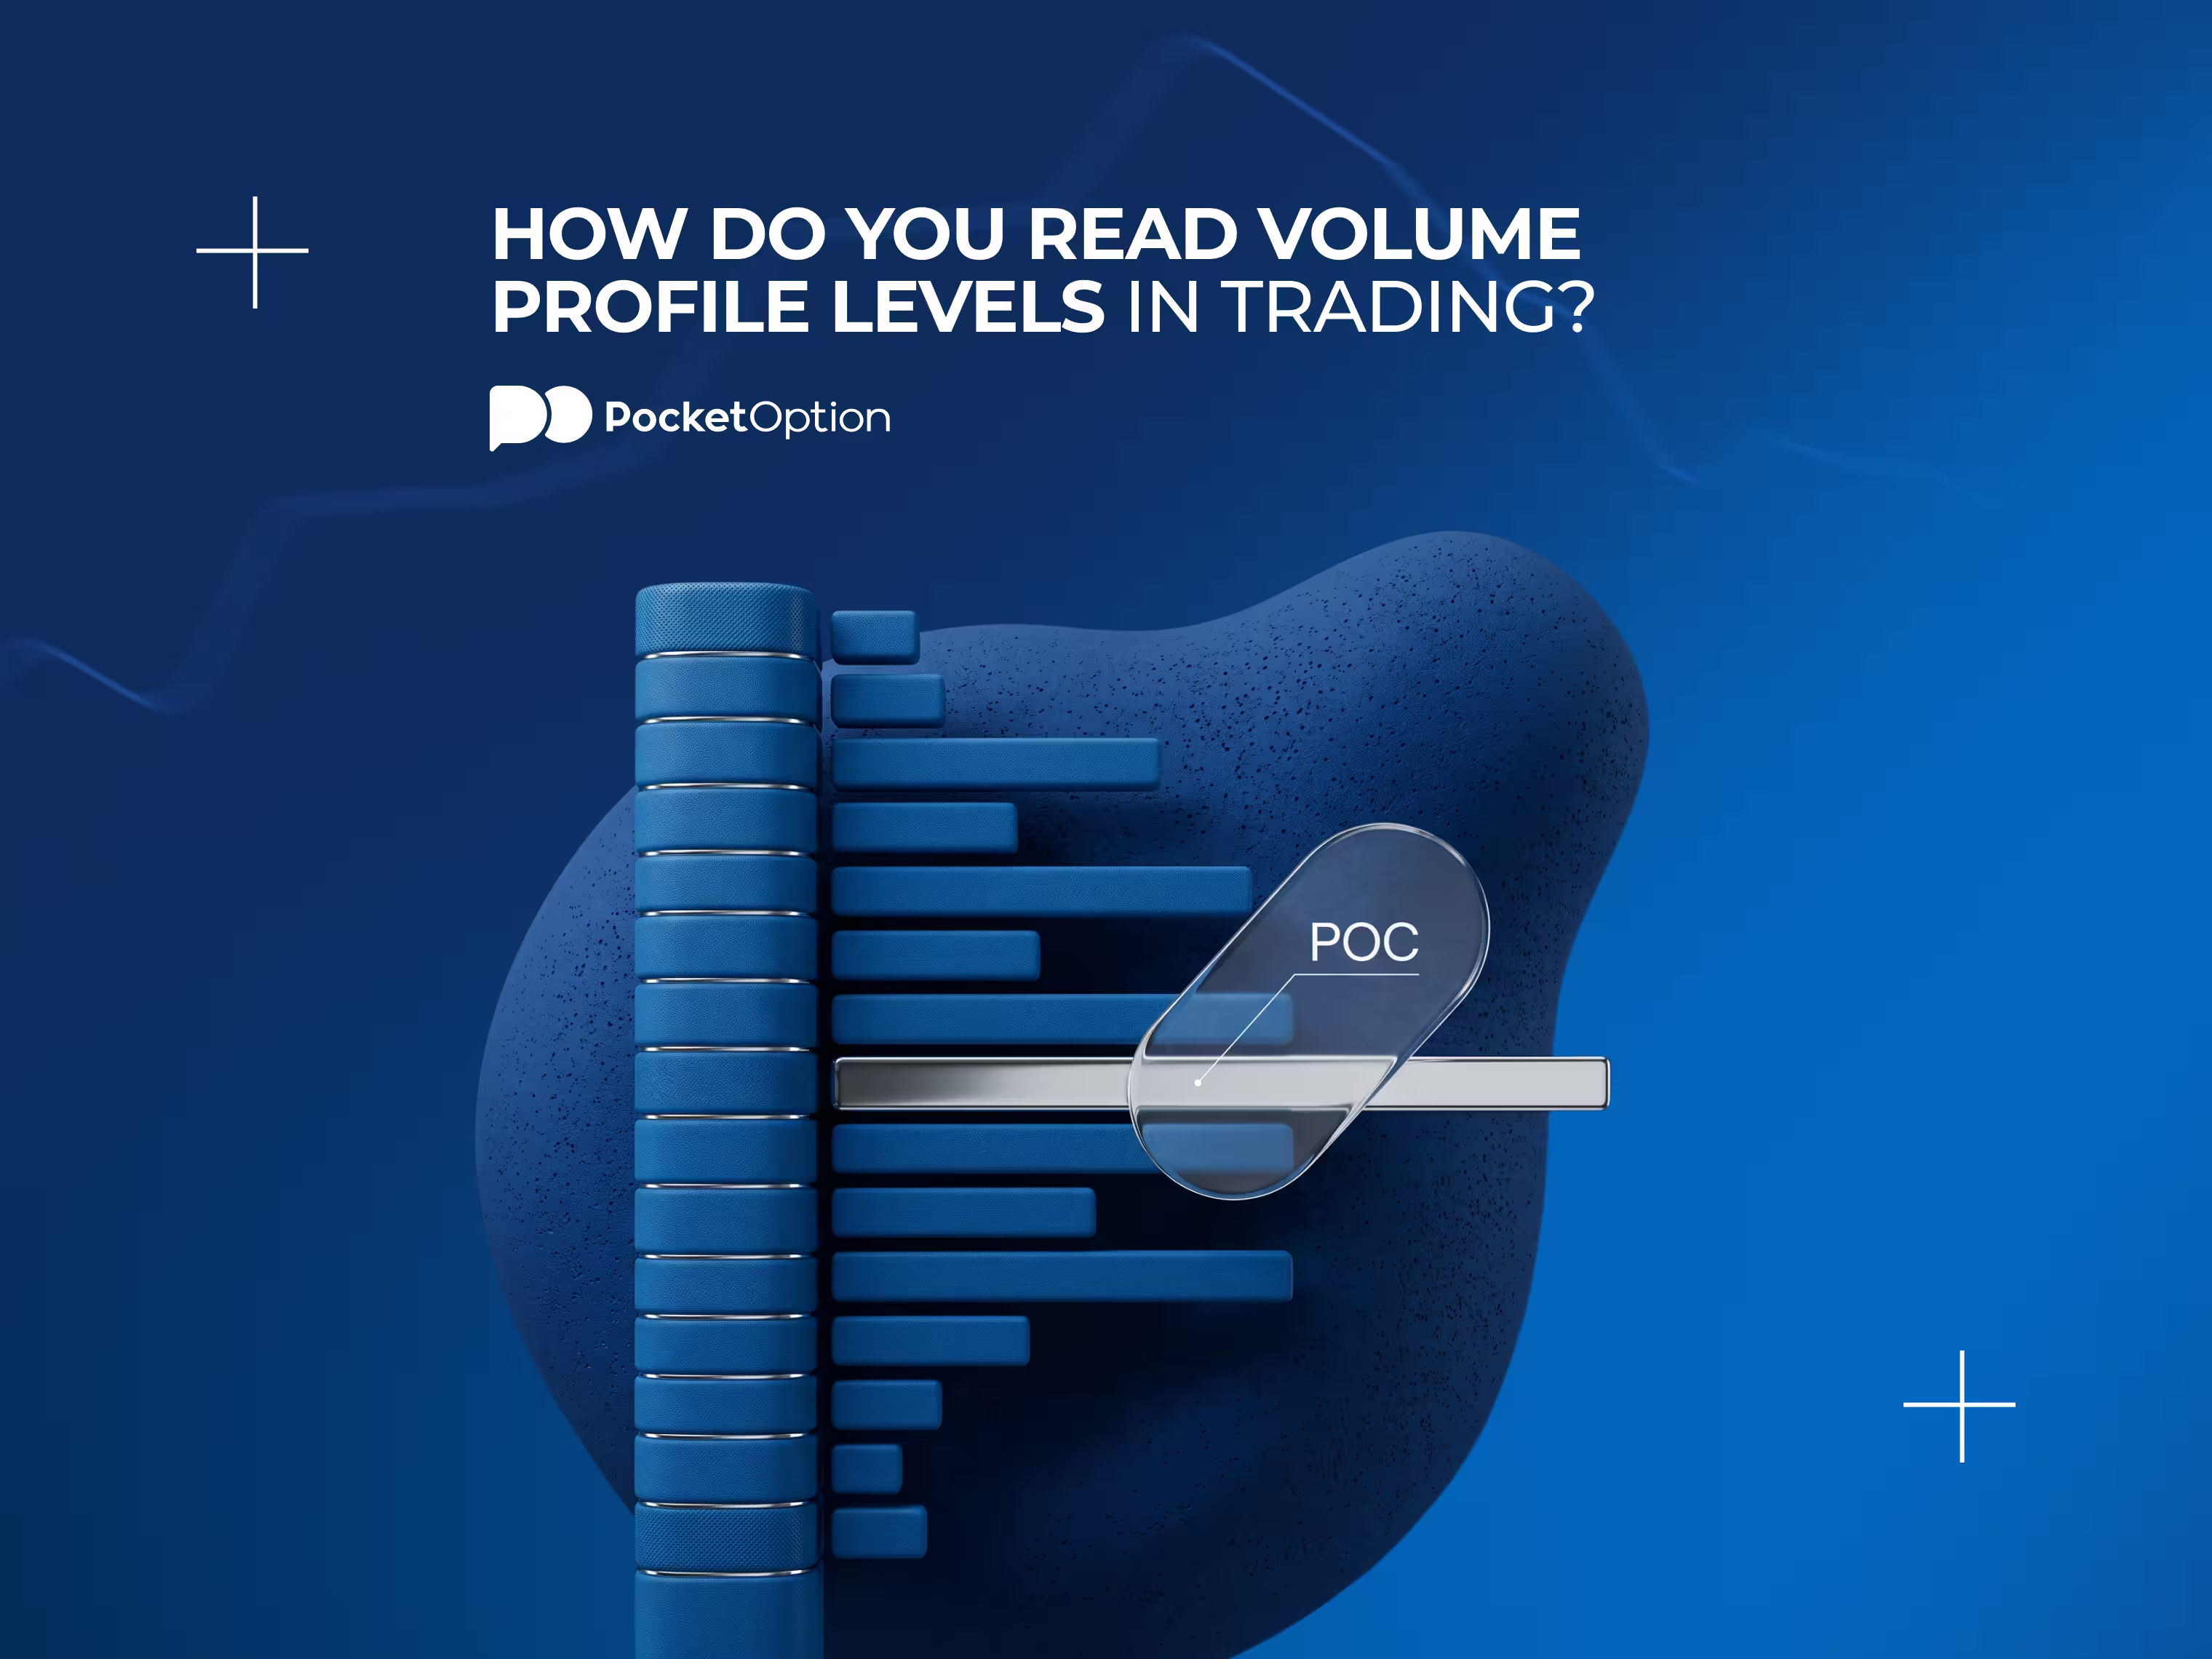
How Do You Read Volume Profile Levels in Trading?
Volume profile shows which price levels saw the most trading activity during a chosen period, not just when trading happened. This guide covers POC, Value Area, HVN, LVN, and where these levels can mislead you.
 Albert RobertsonBearish
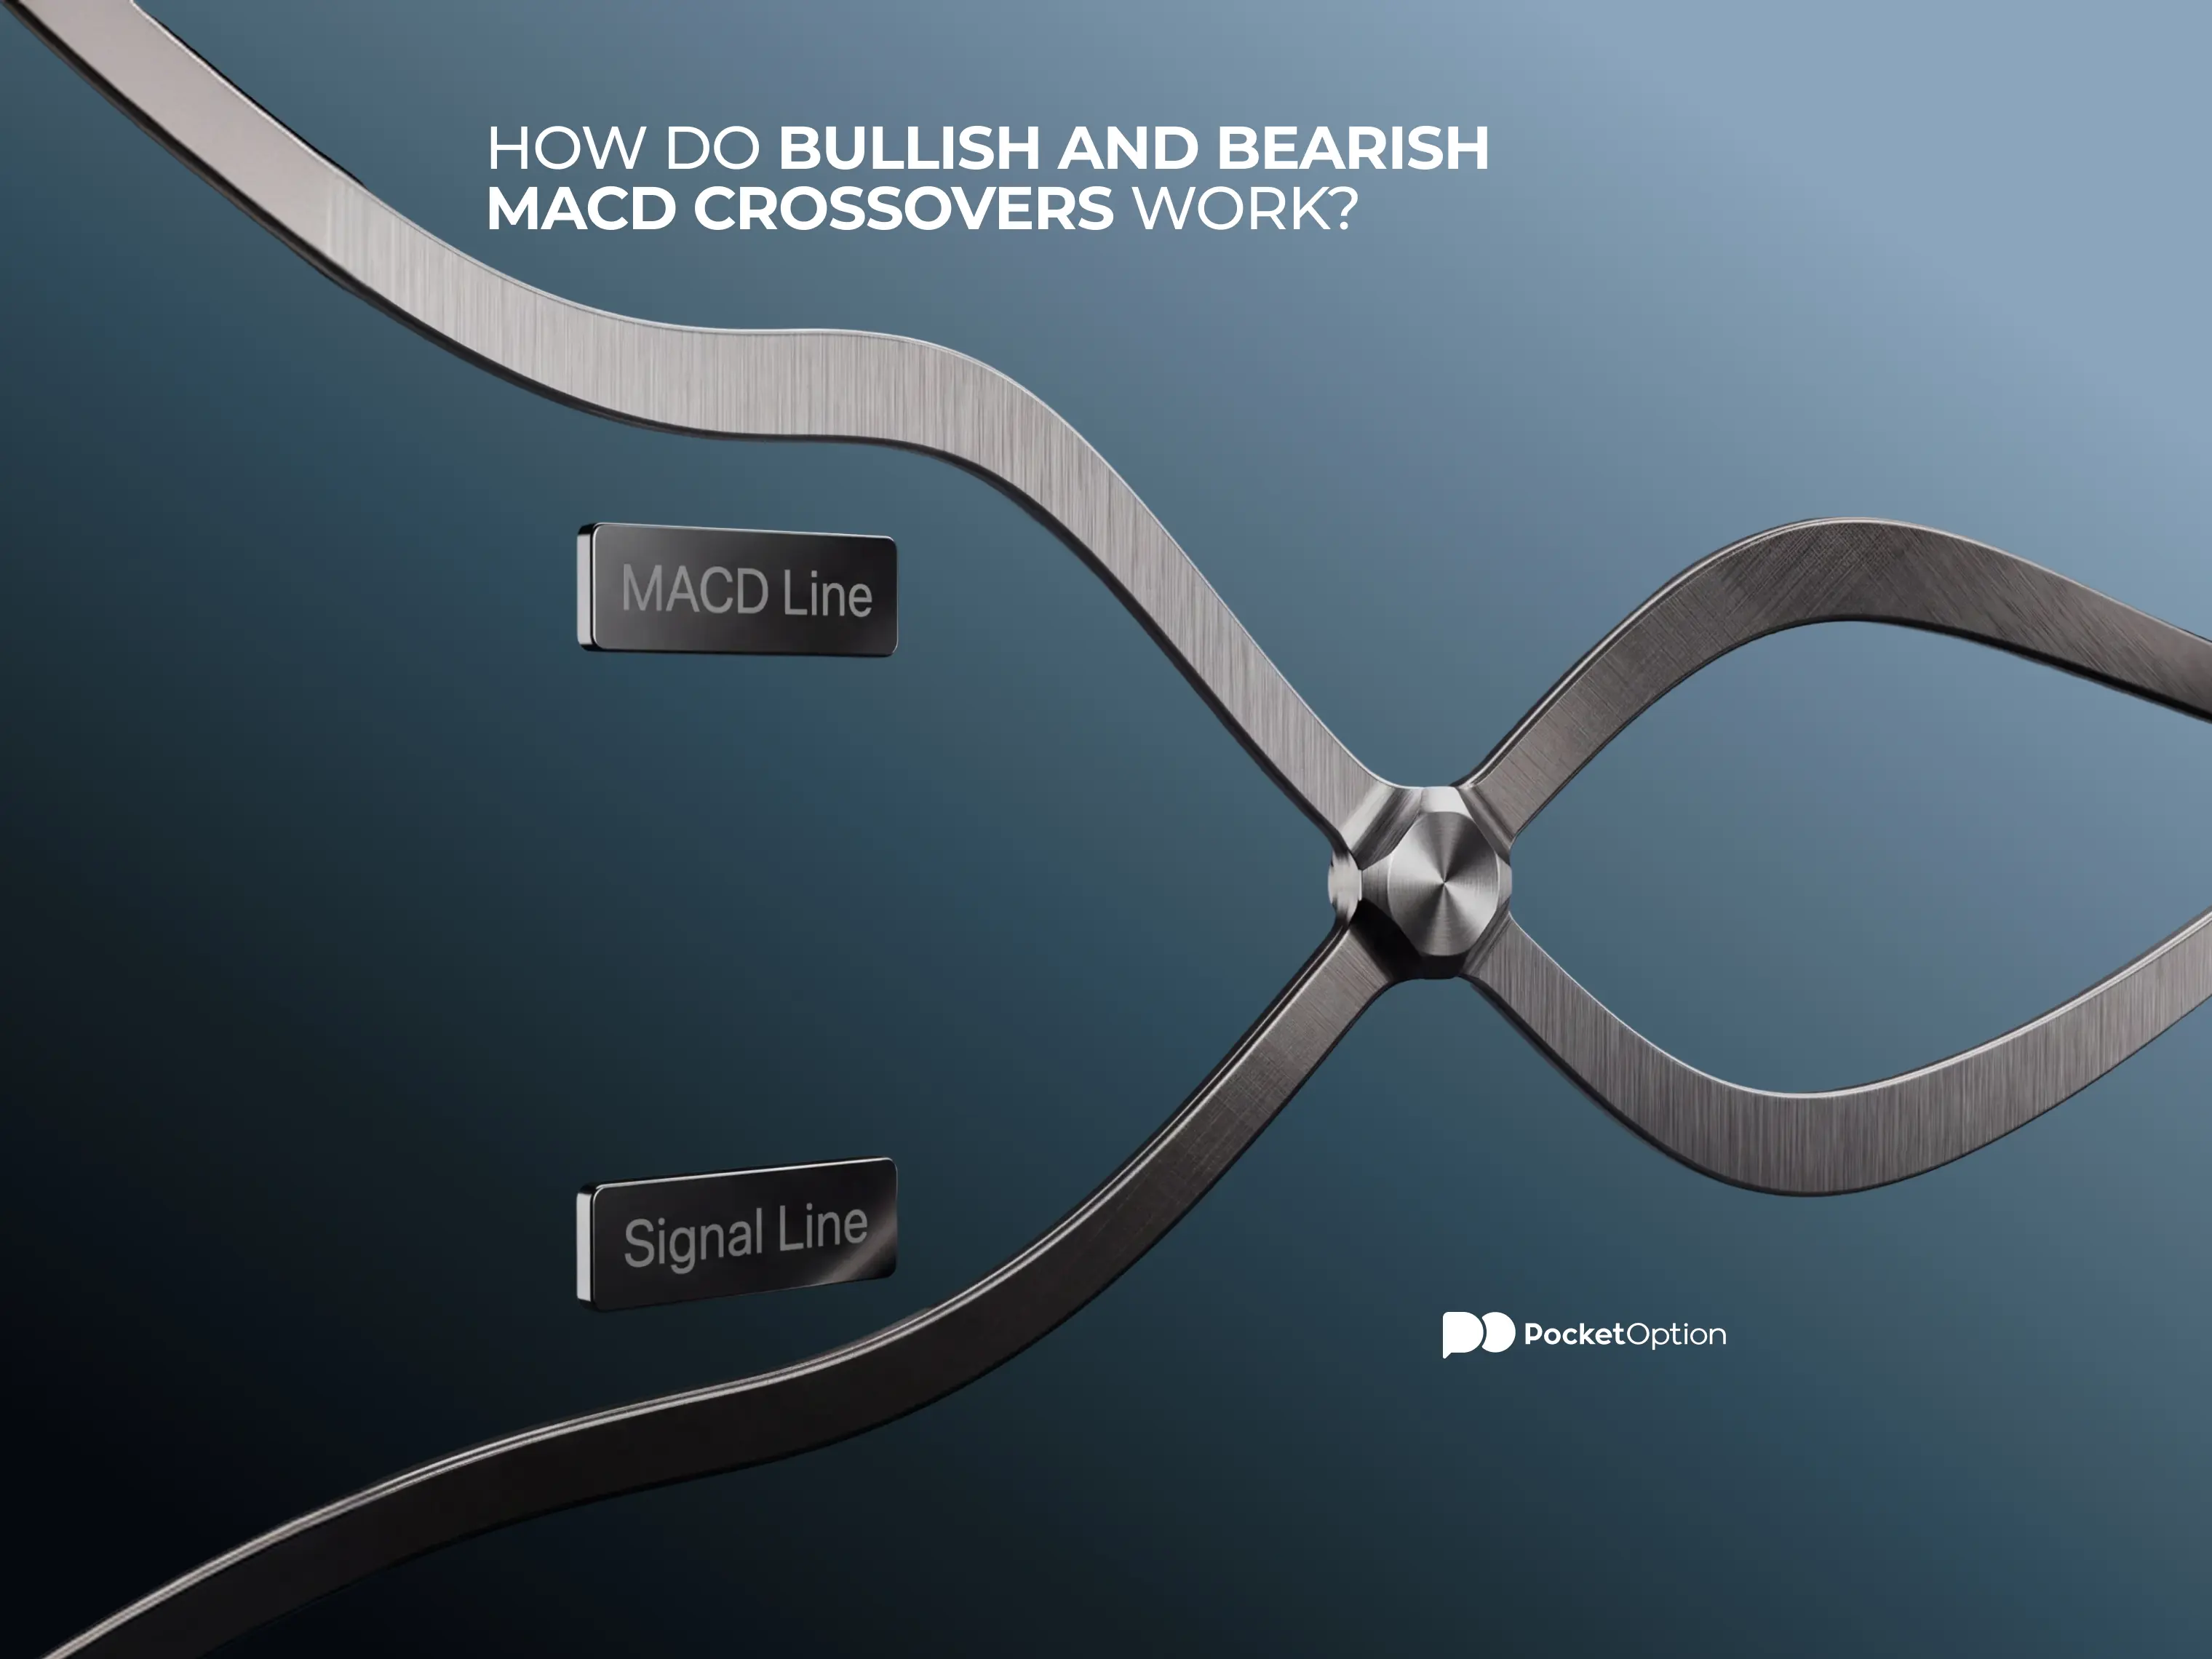
How Do Bullish and Bearish MACD Crossovers Work?
A macd trading strategy built around crossovers means reading each cross as a shift in momentum context, not a guaranteed signal. This guide covers bullish and bearish crossovers, why zero line position matters, and how to weigh a cross against trend and price structure.
 Albert RobertsonBearish
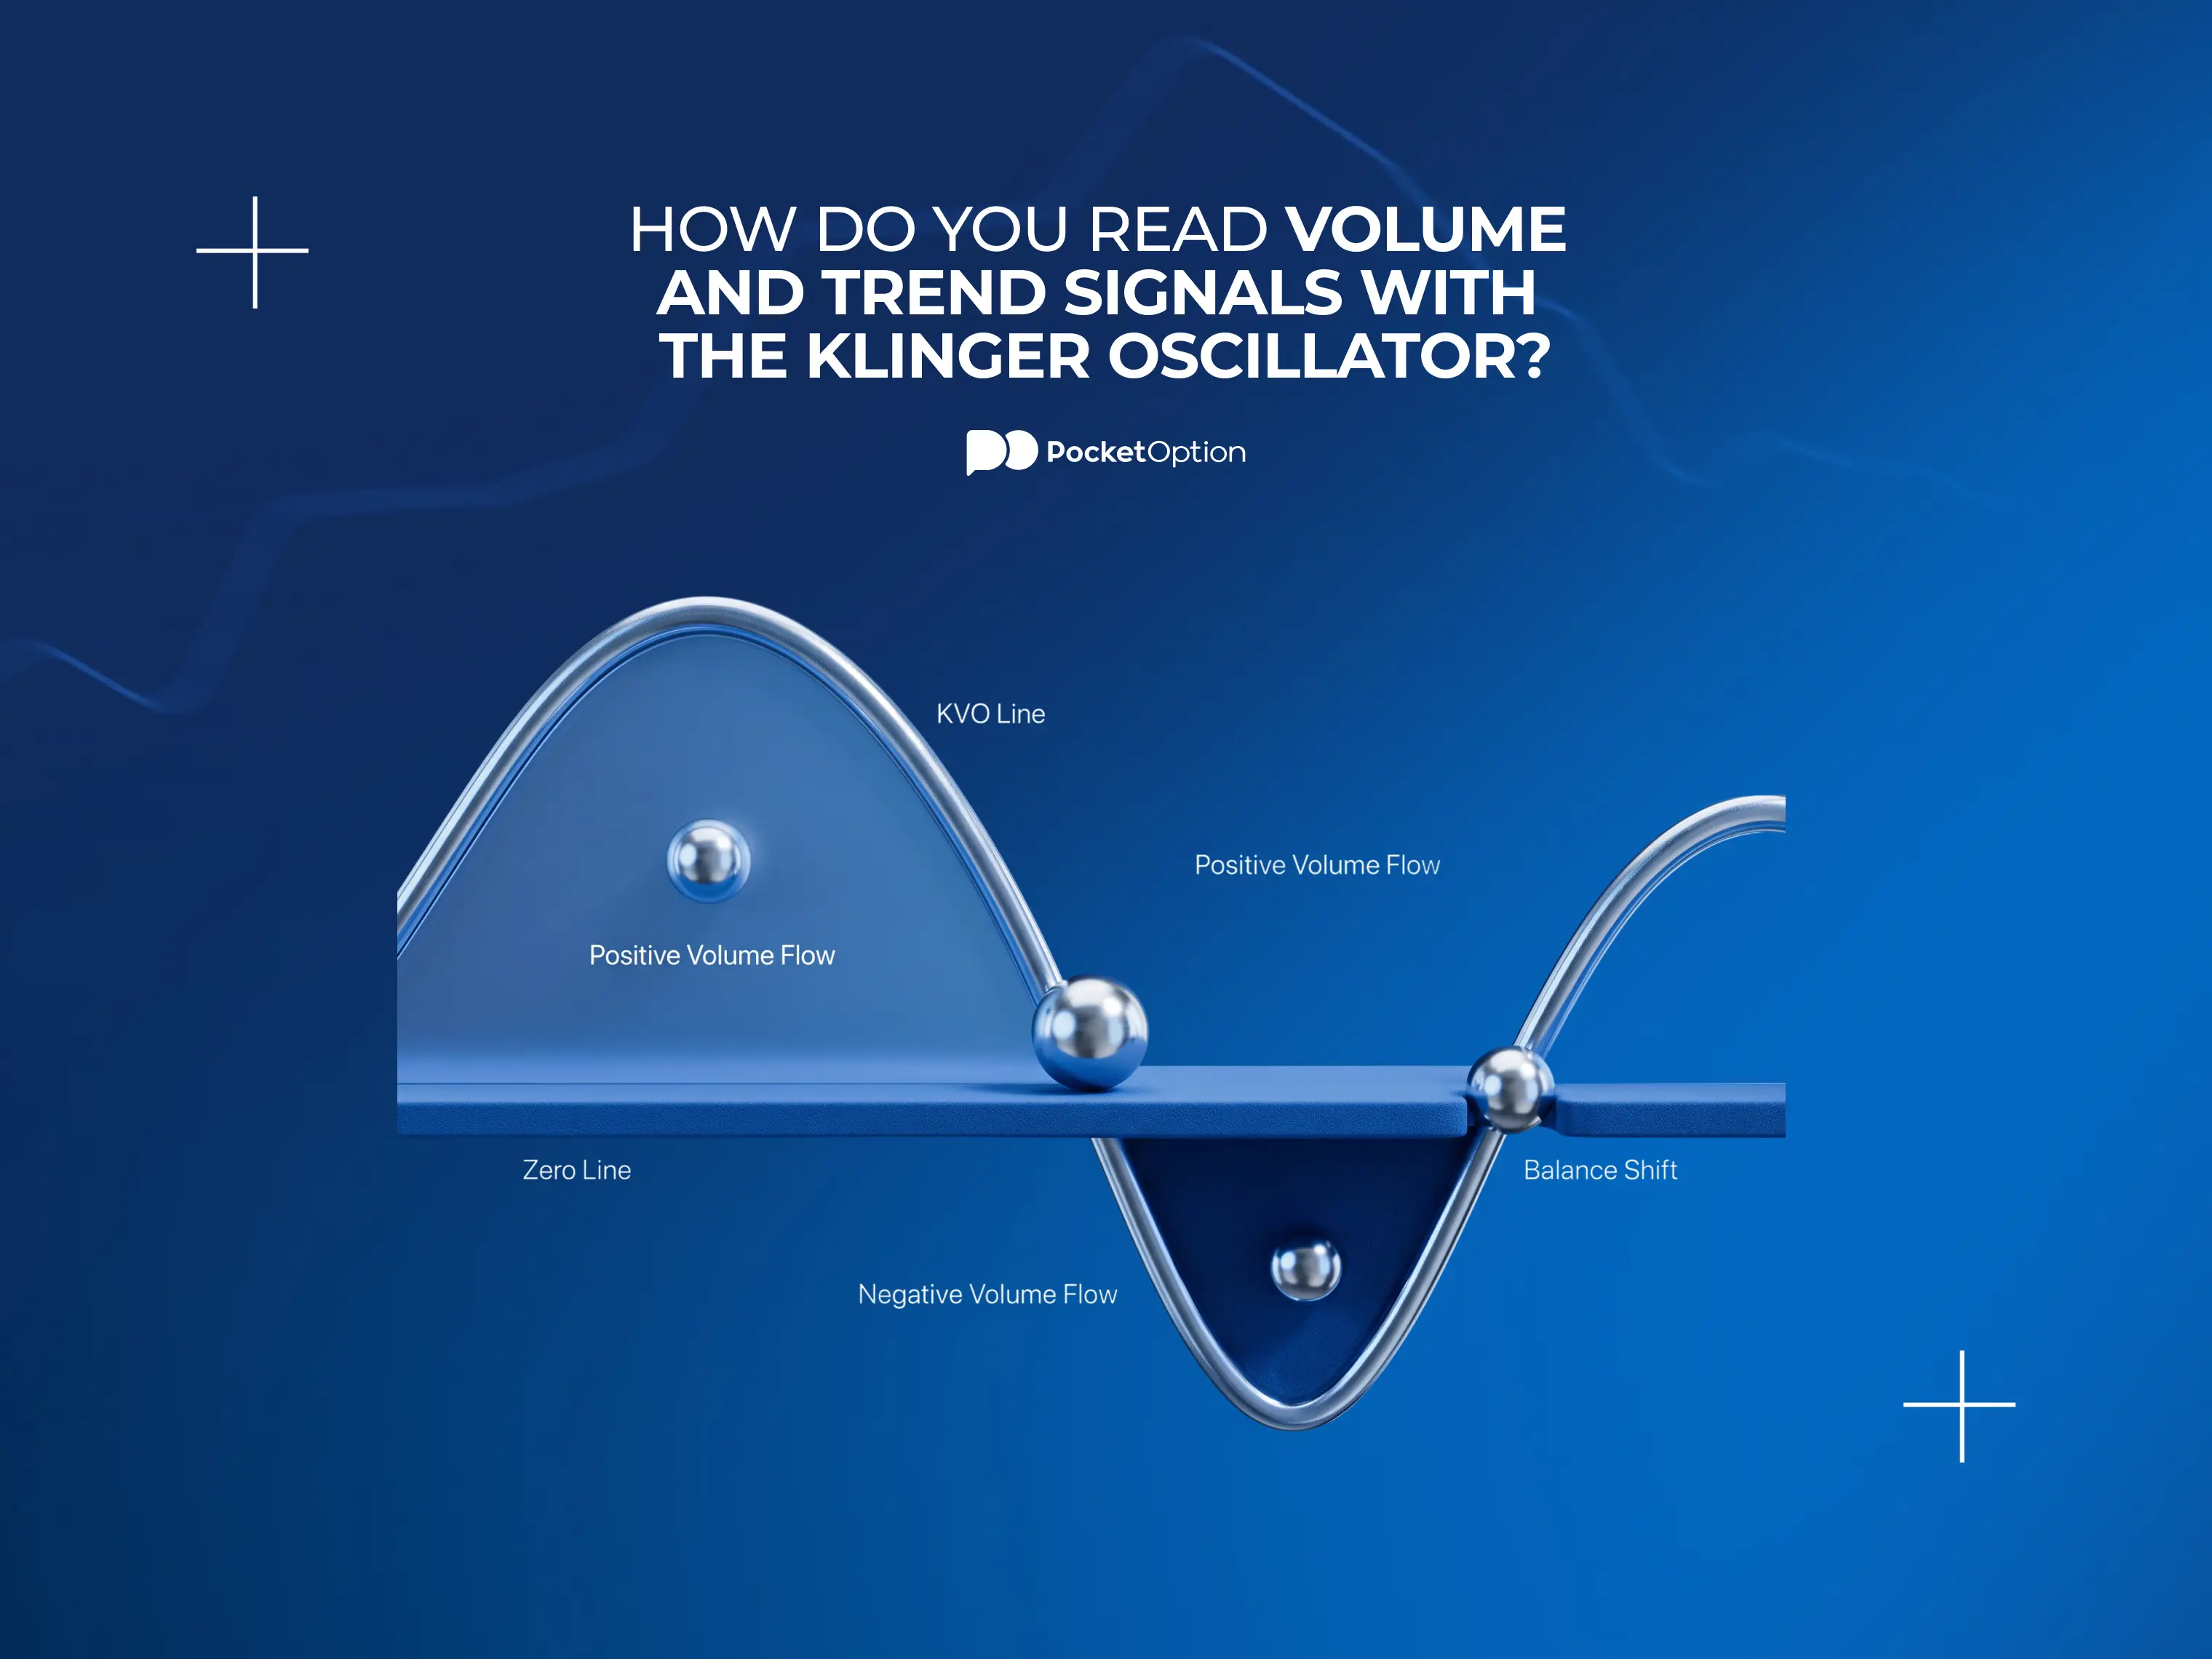
How Do You Read Volume and Trend Signals With the Klinger Oscillator?
The Klinger oscillator combines price movement and volume into one reading of volume flow. This guide covers Volume Force, signal-line crossovers, zero-line context, divergence, and its limits.
 Albert RobertsonBearish
How Do You Read Momentum Signals With the True Strength Index (TSI)?
The true strength index is a momentum oscillator built on double-smoothed price change, oscillating around a zero line. This guide covers the formula, how settings change sensitivity, zero-line and signal-line crossovers, divergence, and its limits.
 Diego FernándezBearish
How Can the House Money Effect Change Risk-Taking After a Gain?
The house money effect describes how a recent trading gain can change how acceptable further risk feels, rooted in mental accounting and shifting reference points. This guide covers where it comes from, how it differs from other biases, and how to notice it in your own decisions.
 Albert RobertsonBearish
How Does a Currency Strength Meter Compare Strong and Weak Currencies?
A currency strength meter compares the relative strength and weakness of several currencies at once, based on movement across the pairs connected to each one. This guide covers how it's calculated, how to read the results, and its limits.
 Albert RobertsonBearish
What Are Bearish Signals and How Can You Spot Them on a Chart?
Bearish signals are a collection of features, price structure, support breaks, momentum, and volume, that may point toward price weakness without guaranteeing it. This guide covers what to watch for, why one signal is usually not enough, and when these signals can mislead.
 Diego FernándezBearish
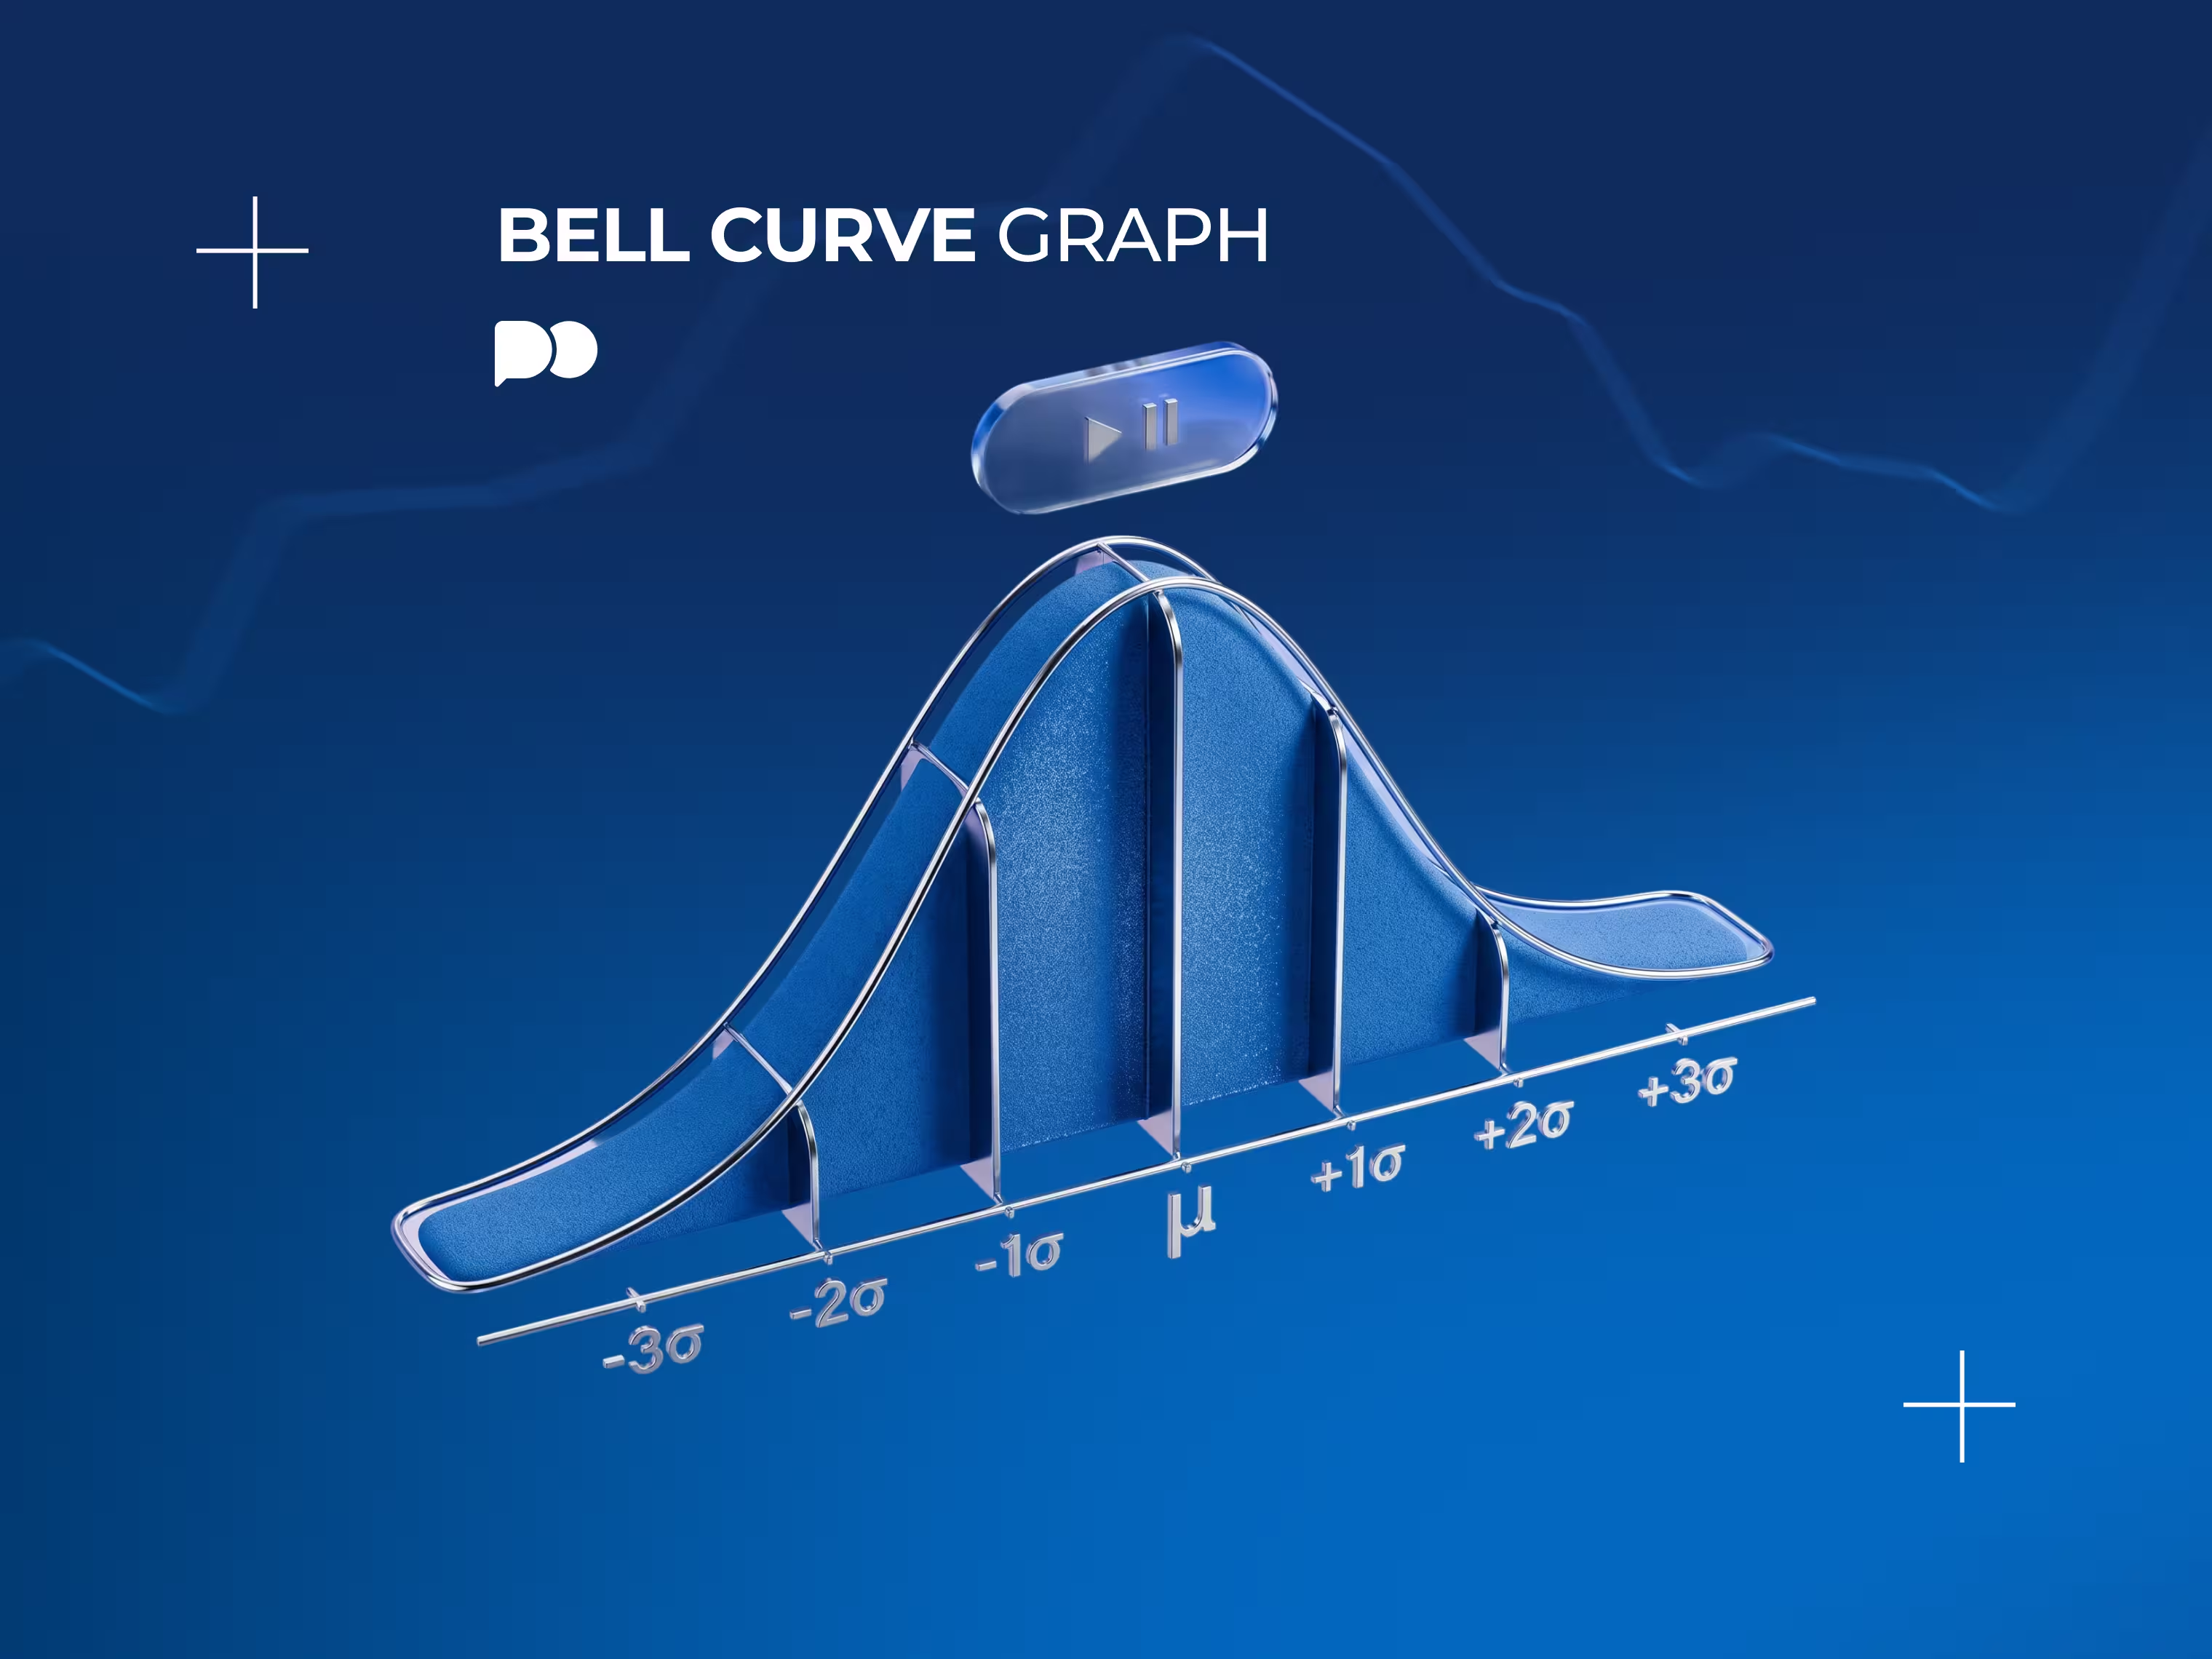
Bell Curve Graph: How to Read the Bell-Shaped Curve, Standard Deviation and Percentages
All phenomena tend to concentrate around the average and become rarer the farther away they are from it. And this single concept gives you the shape you recognize well and allows you to translate a set of numbers into the probabilities. In this article, we'll talk about the shape itself, some basic statistics concepts related to it, and the misleading way it could be applied in financial markets.
 Albert RobertsonBearish
Stakeholders Meaning. Who They Are in Business, Types and Real-World Examples
A company has meaning to more people than just the shareholders (the ones who actually own it). Some have signed a contract with it, some can shut it down completely, and some just allow it to function. All of them are called its stakeholders.
 Albert RobertsonBearish
Capitalization Rate Meaning: How Cap Rate Works in Real Estate and What It Tells Investors
Two buildings can carry the same price tag, but still pay out very different amounts. Cap rate is the one number that shows that gap, before anything else gets looked at. This is an important metric to understand in real estate.