Blog

 Albert RobertsonBearish
What Is an Order Book and How Does the Order Book Display Market Interest?
An order book is a live list of the buy and sell orders waiting to be filled for an asset. It shows where buyers and sellers stand and how much they want to trade at each price. This entry explains how to read one, how it changes, and what it can and cannot tell a trader.
 Albert RobertsonBearish
What Is a Merger and How Do Company Mergers Work in Finance?
A merger joins two companies into one business. Deals can reshape industries and move share prices sharply on the day they are announced. This entry explains how a merger differs from an acquisition, why companies combine, how the process runs and what shareholders receive.
 Albert RobertsonBearish
What Is Market Value and How Does It Reflect an Asset’s Current Price?
Market value is what an asset would fetch in the market today, based on current prices. It changes with every trade and every new piece of information. This entry explains how market value is set, how to calculate it, and how it differs from book value and intrinsic value.
 Albert RobertsonBearish
What Is a Debt Ratio and How Does It Measure Leverage?
The debt ratio shows how much of a company's assets are funded by debt. It is a quick test of financial leverage and of how exposed a business may be if earnings fall. This entry covers the formula, a worked example, what counts as debt, and how the ratio differs from similar measures.
 Albert RobertsonBearish
What Is a Limit Order and How Do Limit Orders Work in Trading?
A limit order is an instruction to buy or sell an asset at a set price or better. It gives control over the price paid or received, but it does not promise that a trade will happen. This entry explains how buy and sell limits work, with simple numbers, and how they compare with market orders.
 Albert RobertsonBearish
Disinflation vs Deflation: What’s the Difference?
Disinflation means inflation is slowing while prices still rise. Deflation means the general price level falls. Here is how the two differ, what causes each, how they can affect the economy and markets, and what to check when inflation is falling.
 Albert RobertsonBearish
What Is Core Inflation? Core vs Headline Inflation Explained
Core inflation strips food and energy out of a price index to show the underlying trend. Here is how it differs from headline inflation, why the two diverge, why economists watch core, and where it falls short.
 Albert RobertsonBearish
What Is Stagflation? Meaning, Causes and Impact on Financial Markets
Stagflation is the mix of high or stubborn inflation, weak growth and a soft job market. Here is what causes it, how it differs from plain inflation and recession, why it squeezes central banks, and how it may touch currencies, stocks, bonds and commodities.
 Albert RobertsonBearish
What Is Purchasing Power Parity (PPP)? Meaning and How It Affects Exchange Rates
Purchasing power parity compares currencies through the cost of a similar basket of goods. Here is how absolute and relative PPP differ, how a PPP rate is worked out, why market rates drift away from it, and how traders can read it in context.
 Albert RobertsonBearish
What Does Amortisation Mean and How Is It Applied in Finance?
Amortisation means spreading a cost or a debt over time. The word turns up in two places: loan repayments and accounting for intangible assets. Both follow the same idea of reducing a value in planned steps.
 Albert RobertsonBearish
What Does OBV Mean and How Does On-Balance Volume Indicate Trend?
OBV is a simple volume indicator with a clear job. It tracks whether volume is flowing into or out of an asset, so you can check whether a price trend has real support behind it.
 Albert RobertsonBearish
What Is Off-Chain and How Do Off-Chain Transactions Work?
Not every crypto transfer is written to the blockchain right away. Many happen off chain, in systems that sit beside the main network and settle back to it later. That makes them faster and cheaper, but you give up some transparency.
 Albert RobertsonBearish
What Are Chartists and How Do They Use Technical Analysis?
Chartists make trading decisions from price charts. They don't start with earnings reports or economic data. They start with what price has already done and ask what it might do next.
 Albert RobertsonBearish
What Is a Stop Limit Order and How Do Stop-Limit Orders Control Entry and Exit?
A stop limit order lets you set two prices instead of one. The first wakes the order up. The second caps the price you'll accept. You gain control over price, but you give up the certainty of a fill.
 Diego FernándezBearish
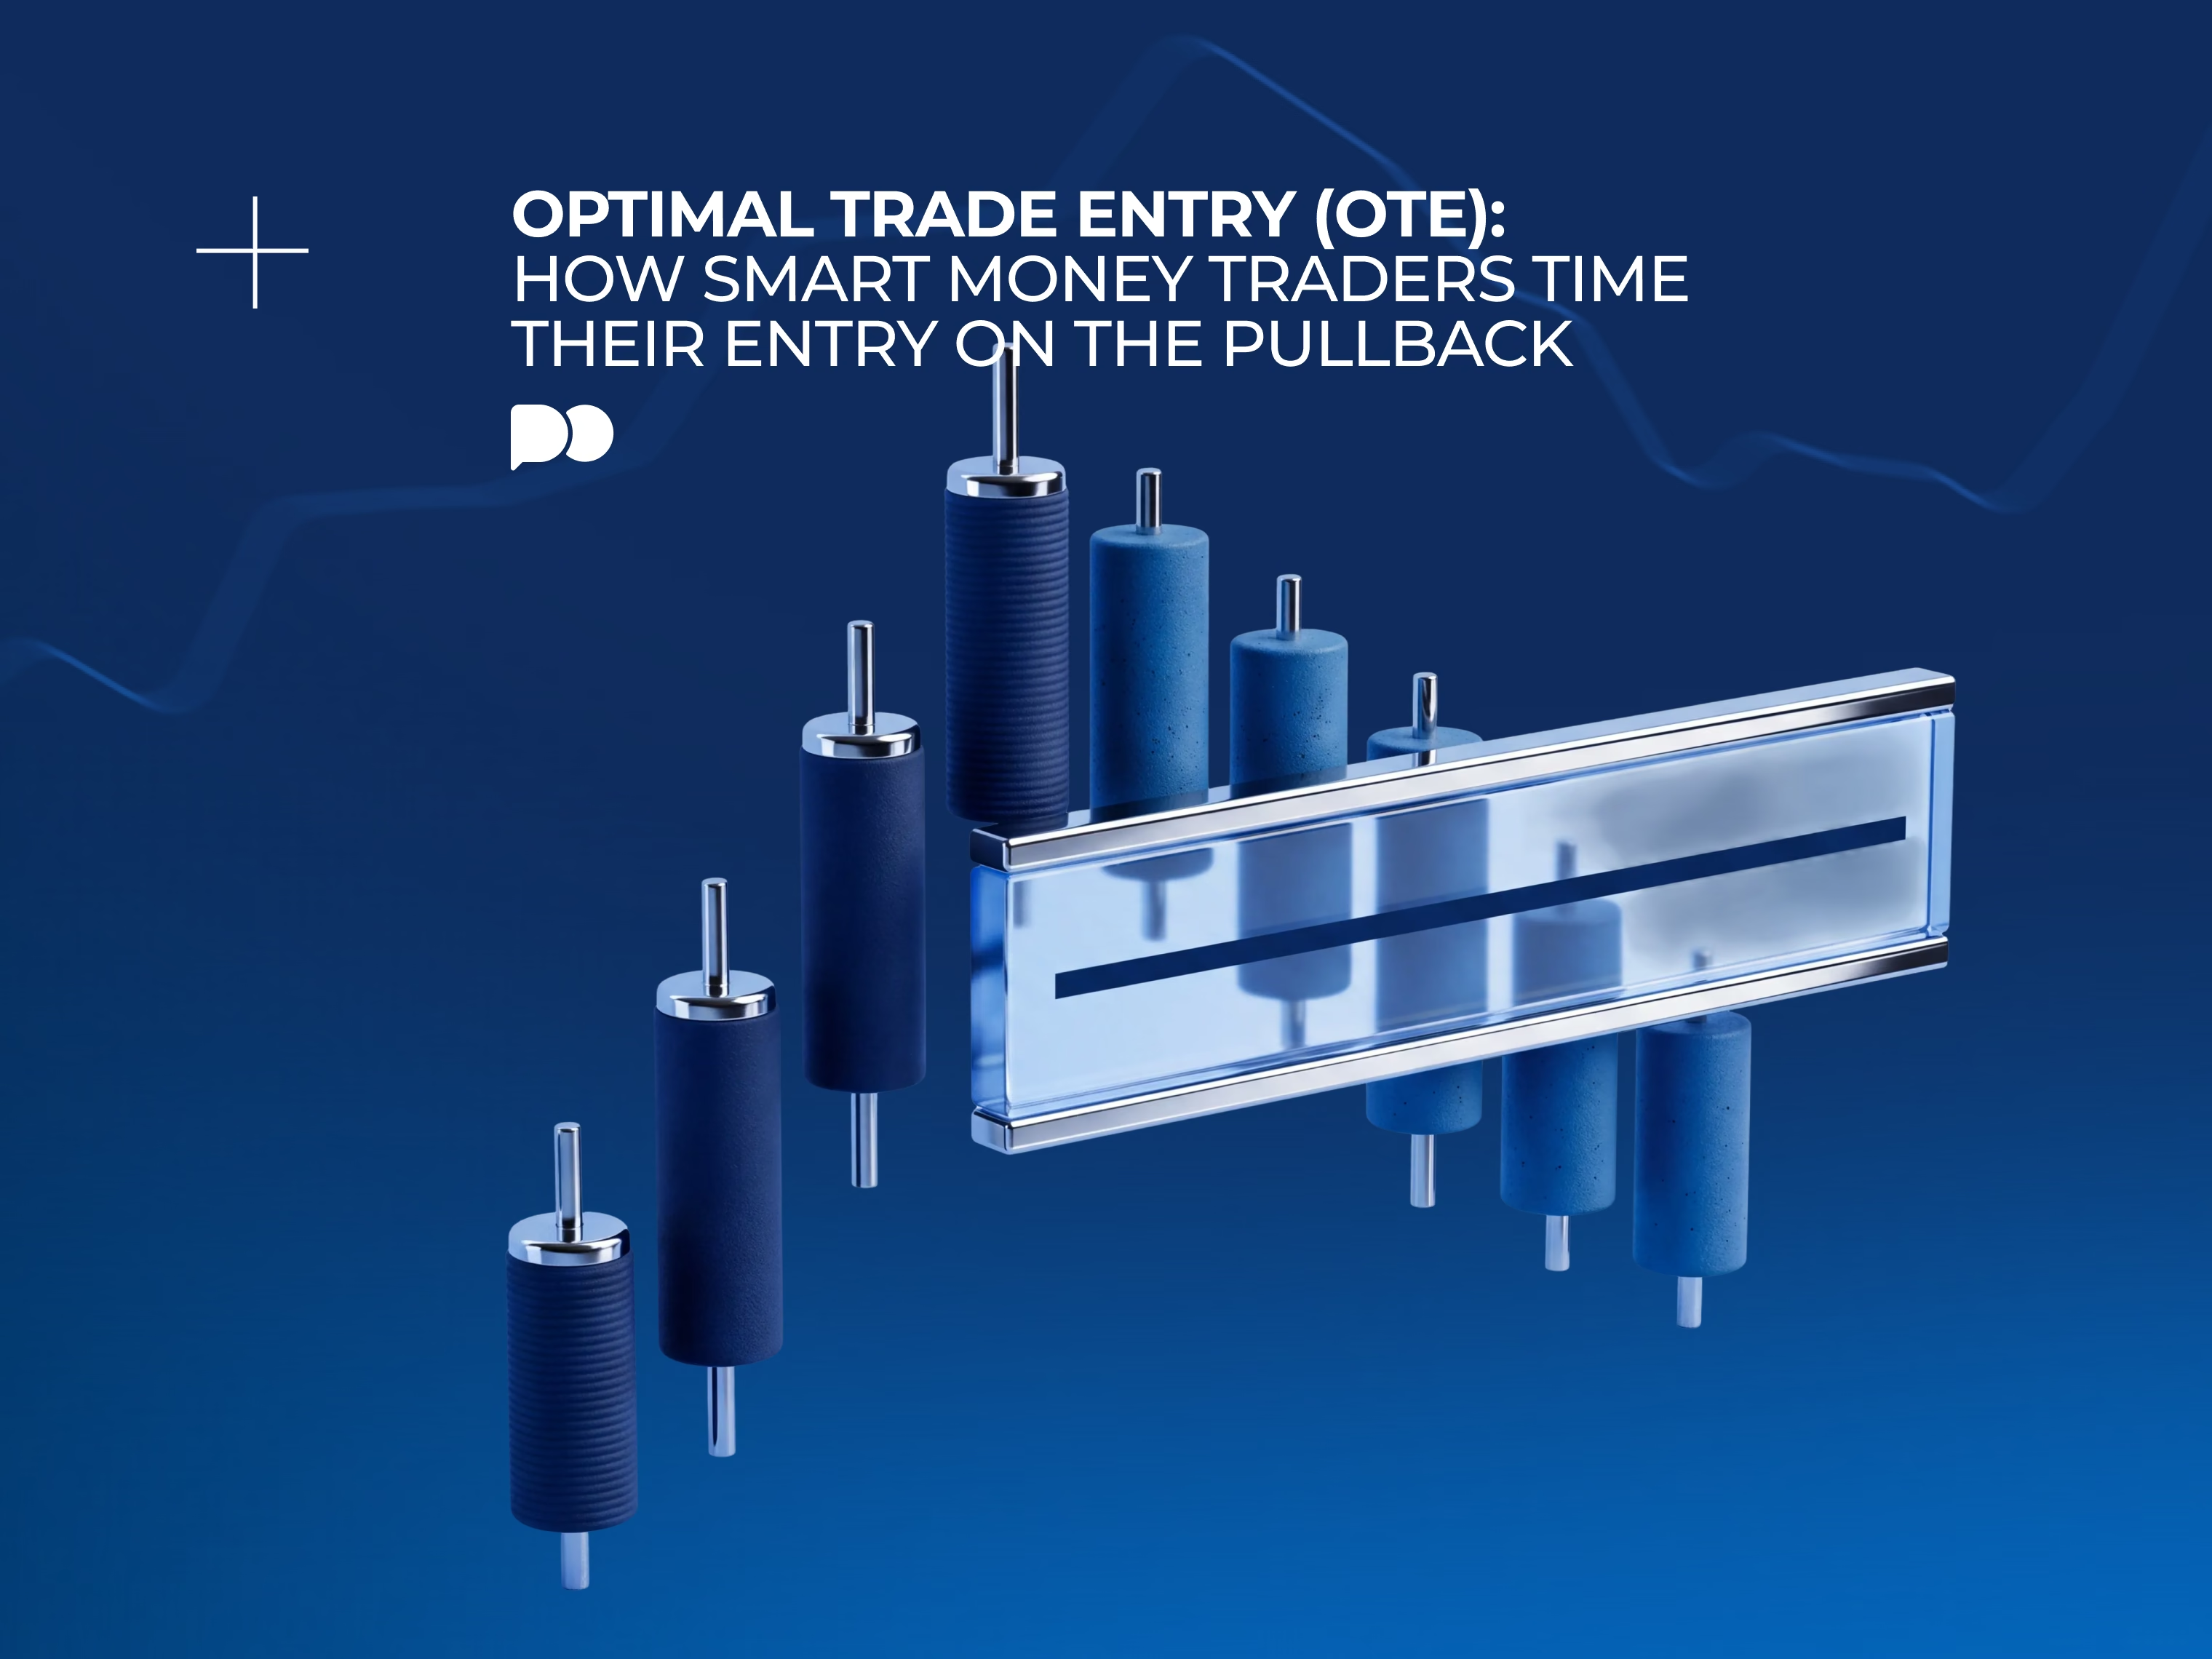
Optimal Trade Entry (OTE): How Smart Money Traders Time Their Entry on the Pullback
Many pullbacks get bought too soon, and some are too late. Optimal trade entry is one way to curb that habit. You let a sharp run finish what it’s doing, wait for price to go back into the 62% to 79% Fibonacci band, and execute the Optimal Trade Entry, for (theoretically) better returns. But how does this work?
 Diego FernándezBearish
Book Value Per Share: What's Left for Shareholders If a Company Shuts Down Tomorrow
In many cases, the true answer to the title question is less than you expect and, in some cases, nothing. It is important to know the real meaning of book value per share in order to understand how far this figure can be trusted. In this article, we will discuss this metric, subtract from it the assets that would not survive liquidation and understand which companies it estimates accurately.
 Albert RobertsonBearish
Accrual Accounting: What the Accrual Basis Is, How It Works and Why It Matters
A company can show positive results for a quarter despite negative cash flow. No fraud occurred, no one misreported and auditors will confirm that. That is how the system works. Understanding this difference is the most valuable insight when analyzing financial statements. The article explains the origins of this difference, follows a transaction through it, and presents a test of whether reported profit is supported by cash.
 Albert RobertsonBearish
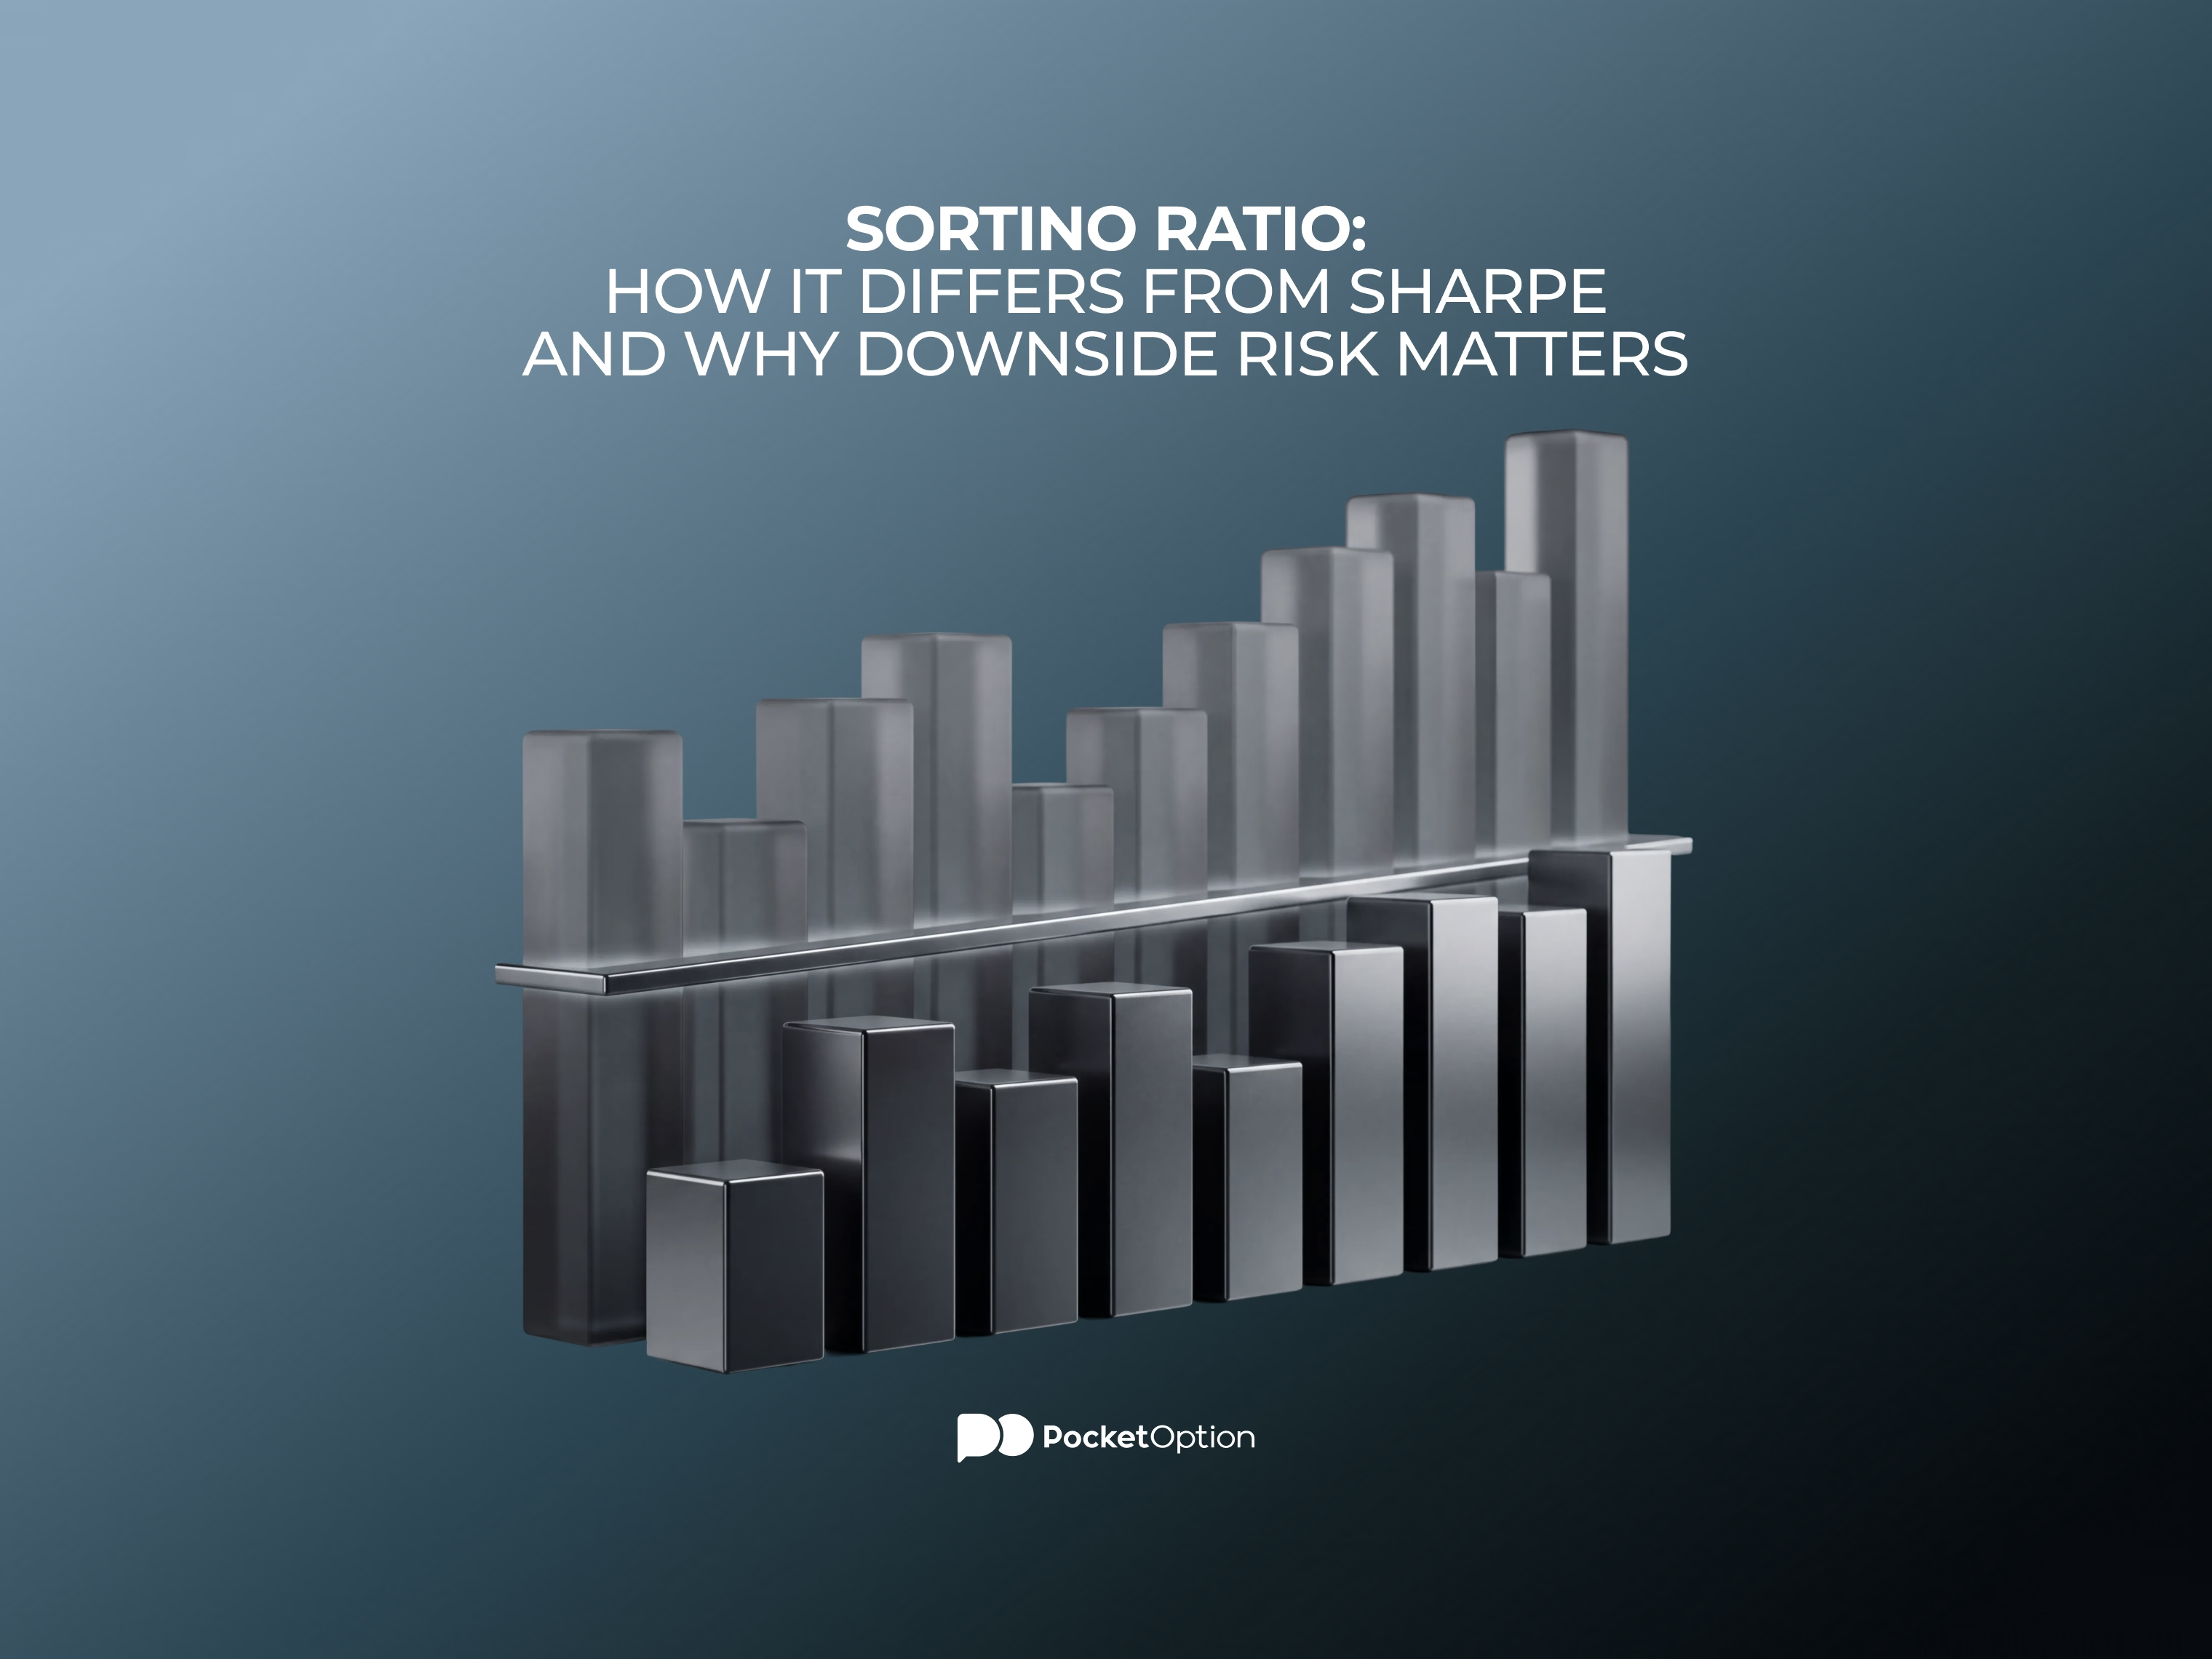
Sortino Ratio: How It Differs from Sharpe and Why Downside Risk Matters
So, what is the Sortino ratio? It’s a useful metric in trading and investing that calculates your returns, per unit of downside deviation. This is a risk-adjusted return that’s meant to ‘penalize’ the bad periods, where returns didn’t quite hit the benchmark. Meanwhile, good periods (with only upside volatility) get through fine, which is the entire point.
 Albert RobertsonBearish
What Is the Phillips Curve? Inflation and Unemployment Explained
The Phillips curve links inflation and unemployment in a simple short-run trade-off. This guide explains how the curve works, how the short-run and long-run versions differ, why expectations and supply shocks move it, and where the model falls short.
 Albert RobertsonBearish
What Is Quantitative Tightening (QT) and How Does It Affect Financial Markets?
Quantitative tightening shrinks a central bank's balance sheet through runoff and, in some cases, active sales. This guide explains how QT works, how it differs from QE and rate hikes, how it can affect bonds, currencies and stocks, and why its market impact varies.
 Albert RobertsonBearish
What Is the Fed Dot Plot? How to Read FOMC Interest Rate Projections
The Fed dot plot collects individual FOMC rate projections in one chart. This guide explains what each dot represents, how to read the years and the longer-run column, what the median and the spread suggest, and what to compare in each new release.
 Albert RobertsonBearish
What Is the Fisher Effect? Inflation and Interest Rates Explained
The Fisher Effect links nominal interest rates, real interest rates, and expected inflation. This guide explains the exact and simplified formulas, works through a plain numeric example, and covers why the observed relationship can diverge from the clean theory in practice.
 Albert RobertsonBearish
What Is the Taylor Rule? Formula and How It Guides Interest Rate Policy
The Taylor Rule is a formula that suggests a short-term interest rate based on inflation and economic activity. This guide explains the classic 1993 formula, what the inflation gap and output gap mean, why the neutral real rate matters, and how traders can interpret the rule as a reference point rather than a trading signal.
 Albert RobertsonBearish
Volatility Clustering in Financial Markets: What It Is and Why It Happens
Volatility clustering describes how periods of large price changes and calm periods with small changes each tend to group together over time. This guide explains why the pattern happens, how it differs from a single volatility spike, how ARCH and GARCH models capture it, and what it means for assessing risk.