Price Elasticity of Demand: Definition, How It Works and Real-World Examples
Increase the price of petrol by 10% and the quantity purchased remains pretty much the same. Increase the price of one brand of crisps by 10% and the consumer switches brands. In both instances, a 10% change in price elicits very different reactions, and the measurement tool which describes the differences between the two is one of the most useful concepts in economics.

What Is Price Elasticity of Demand: Definition
So what is price elasticity of demand? This is a measure of how responsive the quantity purchased changes when the price changes. This is the core idea, and everything else is mathematics built on top of it.
The price elasticity definition economics textbooks use is a ratio between the percentage change in quantity demanded and the percentage change in price. As price and quantity tend to move in opposite directions, the result is typically negative, and most people tend to omit the minus sign while referring to price elasticity.
Put simply, the price elasticity meaning is sensitivity. A large number means that consumers are highly responsive to changes in price, while a small number means that the demand does not change much regardless of the price change. Price elasticity of demand measures that responsiveness for a certain good, in a certain market, over a certain period of time, and all three factors are important.
It's important to emphasize what elasticity does not do. Elasticity is a description of the past demand behaviour or of the expected future demand behaviour. It is a description of a phenomenon rather than a guarantee of an outcome. That nuance will be crucial when further discussing this concept in this article.
The Price Elasticity of Demand Formula
The price elasticity of demand formula is simple: PED = (% change in quantity demanded) / (% change in price)
The main sources of confusion here are two: firstly, the sign of the price elasticity. Demand normally falls as price increases, and hence the result is normally negative. However, for simplicity's sake, people compare the absolute values, hence the negative sign is omitted.
Secondly, what base should the change in price be measured from: the starting price or the final price? Calculating the percentage change from the starting price will give one result, while calculating the percentage change from the final price will give another, although in both cases the change would be the same. Economists solve this problem by using the midpoint method, which divides the change by the average of the two numbers. The result will be independent of the direction of price movement, and that's exactly what we need.
For most practical purposes, the simplified formula is sufficient. Simply stick to one base and be careful about the way in which any price elasticity is calculated.
A Worked Example
Let us consider an example in order to understand how price elasticity of demand is calculated. A coffee shop sells 800 cups of coffee per week for £3.00. It increases the price to £3.30, and sales drop to 720 cups of coffee.
Starting with the calculation of price change, using the midpoint method described above. Price has changed from £3.00 to £3.30, and the change is £0.30. The average of the two prices is £3.15, and dividing £0.30 by £3.15, we get about 9.52%. Now consider quantity change. Quantity has dropped from 800 to 720 cups, which is a change of 80 cups. The average of the two quantities is 760, and dividing 80 by 760 gives us about 10.53% in the opposite direction.
Now dividing the change in quantity by the change in price: 10.53%/9.52%≈1.1. Omitting the minus sign, we find that price elasticity is about 1.1, just above the unitary elasticity threshold discussed in the next section, so demand here is slightly elastic. Revenue confirms it: 720*£3.30=£2,376, a little below the £2,400 taken before the change.
Now changing one of the figures and observing the effect on the firm's revenues. If the quantity sold decreased to 640 instead of 720, that would be a drop of about 22.22% (a fall of 160 cups, divided by the average quantity of 720) against the 9.52% price increase, resulting in elasticity of about 2.33. In this case, the revenue prior to the price increase was 800*£3.00=£2,400. After the change, the revenue is 640*£3.30=£2,112. As we see, the price has increased, and the revenue has decreased, which is what elastic demand does to a poorly chosen price increase.
Conversely, if the sales only dropped to 780, that would be a drop of about 2.53% (a fall of 20 cups, divided by the average quantity of 790) against the 9.52% price increase, resulting in elasticity of about 0.27. The corresponding revenue has gone from £2,400 to £2,574, meaning that despite the increase in price, the revenue has risen.
Price dynamics are different on a live chart.
Get StartedTypes of Elasticity: Elastic, Inelastic, Unitary
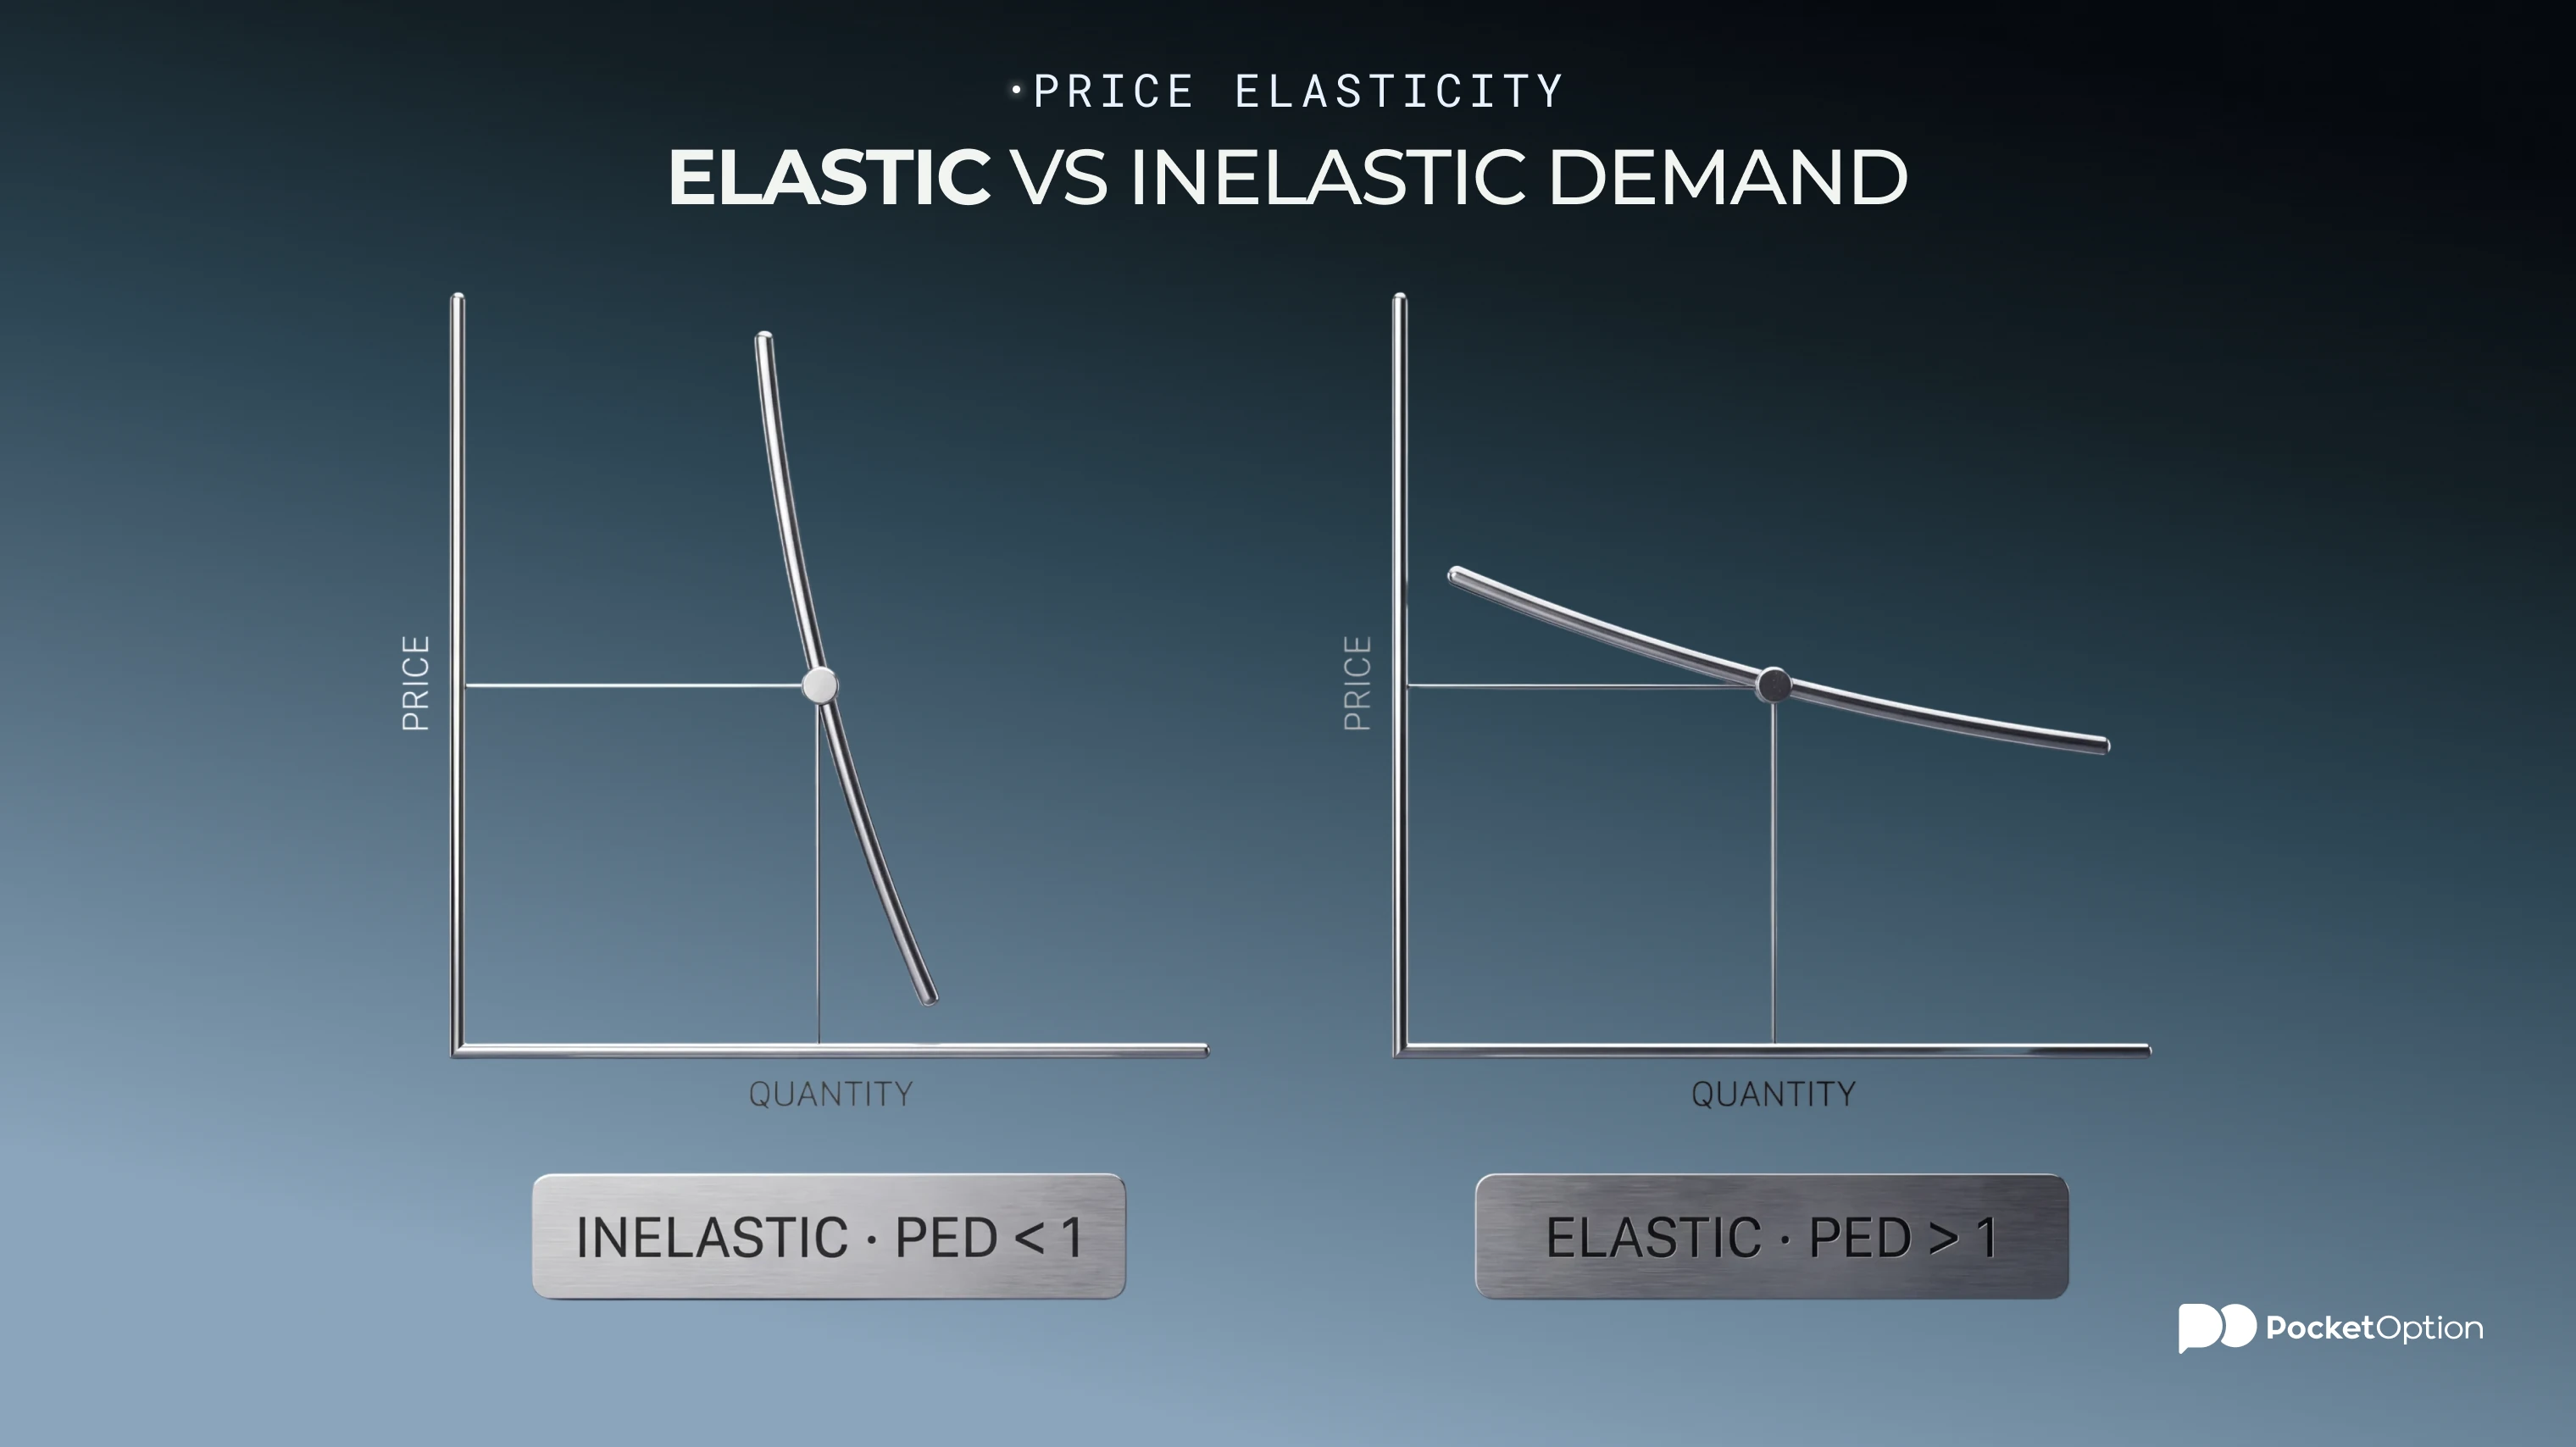
Everything depends on whether the number is larger or smaller than 1. That single threshold tells you the direction in which revenue moves as the price changes.
Students who encounter what is price elasticity as a formula first often miss this part. The calculation gives you a number; you only make use of it once you know the position of that number relative to 1.
Price elasticity of demand is plotted on a simple spectrum with five defined regions, which describe the behaviour of consumers towards price changes and the effect these have on revenue:
Type | PED value | What consumers do | Effect of a price rise on revenue |
|---|---|---|---|
Perfectly inelastic | 0 | Buy the same amount regardless of the price increase | Revenue changes in the same proportion as the price |
Inelastic | Between 0 and 1 | Reduce purchases, but not enough to overcome the price increase | Revenue increases |
Unitary | Exactly 1 | Reduce purchases by exactly the same percentage as the price rise | Revenue stays the same |
Elastic | Above 1 | Reduce purchases by a larger percentage than the price increase | Revenue decreases |
Perfectly elastic | Infinite | Stop purchasing altogether at even the slightest increase | Revenue collapses |
Those two extremes represent theoretical boundaries, rather than actual observations, as no product is purchased in the same quantities at any possible price, and no product loses all consumers due to a small increase in price. Nevertheless, they indicate the limits of the spectrum.
Unitary elasticity represents the threshold. At the inelastic side of the spectrum, revenue increases despite falling sales as the price increases. On the elastic side, higher prices bring greater volume losses than per unit gains. Businesses which offer discounts rely on being on the elastic side of the spectrum, while firms which increase the prices rely on being on the other side.
Main Determinants of Price Elasticity
Five factors account for most of the variation, and the determinants of price elasticity of demand are worth understanding individually, since they explain how elasticity changes depending on circumstances.
Availability of substitutes. This is the single most influential factor. If there is a substitute which is just as similar, then the demand is elastic. If nothing performs the function of the product, it is not. Market definition is key here; the demand for one particular brand of petrol is elastic, while the demand for petrol in general is not.
Share of the budget. The product which costs just a few pennies a week is hardly registered even if its price is doubled, while the product which takes a quarter of the budget is immediately noticed and may be reduced.
Time horizon. Elasticity increases with time. A commuter cannot change car this month, but within five years he or she might buy a more efficient car, move closer to workplace, or switch to public transportation. Short-run figures underestimate the ultimate response of consumers.
Necessity against luxury. Essentials such as insulin are bought regardless of the price, while luxury or discretionary products such as eating at restaurants are immediately sacrificed in hard times.
Brand loyalty and switching costs. Consumers' habit, contracts and effort required to switch to an alternative make consumers less responsive, and hence why subscription-based businesses invest so much into making sure their product becomes a habit for consumers.
These factors combine, rather than sum up. A branded medicine without alternatives, consumed daily and taking a tiny portion of the budget, has four reasons for its inelasticity. Identifying those factors in relation to a company's products is part of what separates a superficial read from proper fundamental analysis of stocks.
Real-World Examples
Here are some price elasticity of demand examples, with one illustrating why precision is more complicated than textbook examples would make you think.
Product | Typically | Reason |
|---|---|---|
Petrol and diesel | Inelastic in the short run | Few immediate alternatives, trips already planned |
Prescription medicine | Highly inelastic | No substitute, necessity, often paid through insurance |
Salt and basic necessities | Very inelastic | Tiny share of the budget, no meaningful alternative |
A single brand of cereals | Elastic | Many identical alternatives on the shelves |
Consumer electronics | Elastic | Discretionary, postponable, heavily price-compared |
Subscriptions | Moderately elastic | Easy to cancel, habit and bundling mitigate that effect |
Airline tickets, leisure travel | Elastic | Trips can be postponed, compared on the spot |
Airline tickets, business travel | Inelastic | The travel date is fixed and the consumer is usually not the one paying |
That last pair is the one useful in business. The exact same seat on the exact same flight shows different levels of elasticity depending on who buys and why, which is precisely why airlines charge different prices for the same seat.
Now for the honest complication. Petrol is the most widely researched example in literature, and economists cannot agree about the precise figure. Espey's 1998 meta-analysis of over 300 estimates put the median short-run figure at approximately 0.23. Hughes, Knittel and Sperling found a range between 0.03 and 0.08 for the early 2000s. Coglianese, Davis, Kilian and Stock estimated 0.37 in 2017 using variation in fuel taxes by states. Every one of these studies points that demand for petrol is inelastic, yet the numbers vary by more than tenfold.
This is not a flaw of economics. This is what measuring behaviour looks like. Direction is settled and magnitude is dependent on time, approach and the sample chosen. That whole pattern is something to keep in mind before believing in a single precise figure.
No deposit needed to start.
Try DemoWhy Elasticity Matters for Pricing Decisions
The demand elasticity of a product decides whether increasing the price is a good decision or not. For a business, it is a matter of pure mathematics rather than opinion.
The rule follows straightforwardly from the mathematics outlined above. When the demand is inelastic, then raising the price increases the revenue as the volume lost is smaller than the price gain. When the demand is elastic, then reducing the price increases the revenue as the volume gained is larger than the price loss. Making this mistake costs a lot in both directions.
However, revenue is not equal to profit, and that's where the simplistic rule fails. Selling more units means producing more units, and hence the elastic product gaining volume from the price reduction also gains the cost of production. The calculation of interest is the one comparing the change in revenue and the change in total cost, not revenue alone.
Elasticity explains a lot of commercial behaviour once you know where to look for it. Loyalty programs and subscriptions exist partly in order to reduce elasticity by increasing switching costs. Premium branding exists in order to make the product appear less substitutable. Discounting to liquidate surplus is a bet that the short-run response is elastic enough to move the volume.
When you analyse a business, this is a structural issue. A business whose consumers are tied has pricing power, and pricing power translates into the ability to maintain margins despite inflation. A business whose product is substitutable is not protected by such a structure, despite whatever management says.
What This Means for Market Behavior and Trading
The relationship is true, and needs to be stated carefully because it is easy to oversell.
The correct statement is this. Demand elasticity is a well-documented empirical regularity about the direction. Increasing the price of something which has a substitute leads to the decrease in demand for it. Financial markets are less tidy: rate decisions, inflation statistics and earnings reports do shift participant behaviour, but the direction of that shift depends on what was already expected and priced in, and it cannot be reliably known in advance.
What neither of them gives you is a precise forecast. With economists disagreeing on the magnitude of the price elasticity of petrol by a factor of ten over 50 years of research, it is impossible to take a prediction of exact market response to a news report seriously. Neither the direction of the movement nor its magnitude, timing or persistence can be predicted with any certainty, and risk is always present.
There is also behavioural parallel. Elasticity changes with time as the process is gradual. Participant behaviour in financial markets works the other way round: reacting strongly at the moment of the news event and subsequently revising their actions. That is the exact same process as the overreaction outlined in this piece on why traders dump positions at the worst possible moment. And it is based on the same truth about the human reaction being uneven.
Hence the practical lesson is not a trading signal. It is a reminder to consider multiple possible outcomes and not rely on a single point estimate. And also a reminder to treat the analysis which promises you precise results with the same healthy scepticism with which you would treat any price elasticity figure. If you are new to how prices are set in the financial market, there is a plain explanation of how the stock market works to read alongside this.
Conclusion
Ask yourself what the buyer's alternative is, and you'll find the majority of the answer before you even calculate the price elasticity of demand.
Substitution is the dominant determinant, while the rest of the factors are auxiliary. The product which has an alternative on the next shelf will have elastic demand no matter how the accounts are set. The product which has nothing comparable, purchased out of habit and taking a tiny part of budget does not. You can tell whether you face one or another in a matter of seconds, and this rough check is going to be right more often than the exact figure calculated from one price change and one period of time. The number is useful for measurement of the past, while the substitution question will tell you about the future, and that's what you need to ask first.
Disclaimer: The information provided in this article is for informational purposes only and is not investment advice. Trading and investing are associated with significant risks of capital loss, and economic models reflect tendencies rather than predict market outcomes.
See more:Knowledge baseTrading