How Do You Read Volume and Trend Signals With the Klinger Oscillator?
The Klinger oscillator combines price movement and volume into one reading of volume flow. This guide covers Volume Force, signal-line crossovers, zero-line context, divergence, and its limits.

Klinger Volume Oscillator: What KVO Actually Measures
A simple water meter counts how much water passes through a pipe, regardless of which way it's flowing. A directional flow meter does something more specific: it weighs volume differently depending on whether the flow is moving one way or the other, turning raw volume into a signed measure of pressure in a particular direction. The Klinger oscillator works on a similar idea with price and volume.
It's a volume-based oscillator built to gauge the direction of volume flow and how that flow is shifting over time. The Klinger oscillator doesn't show actual money moving in or out of an asset directly. It calculates its own measure from price movement and volume data, a computed reading rather than a literal count of cash changing hands.
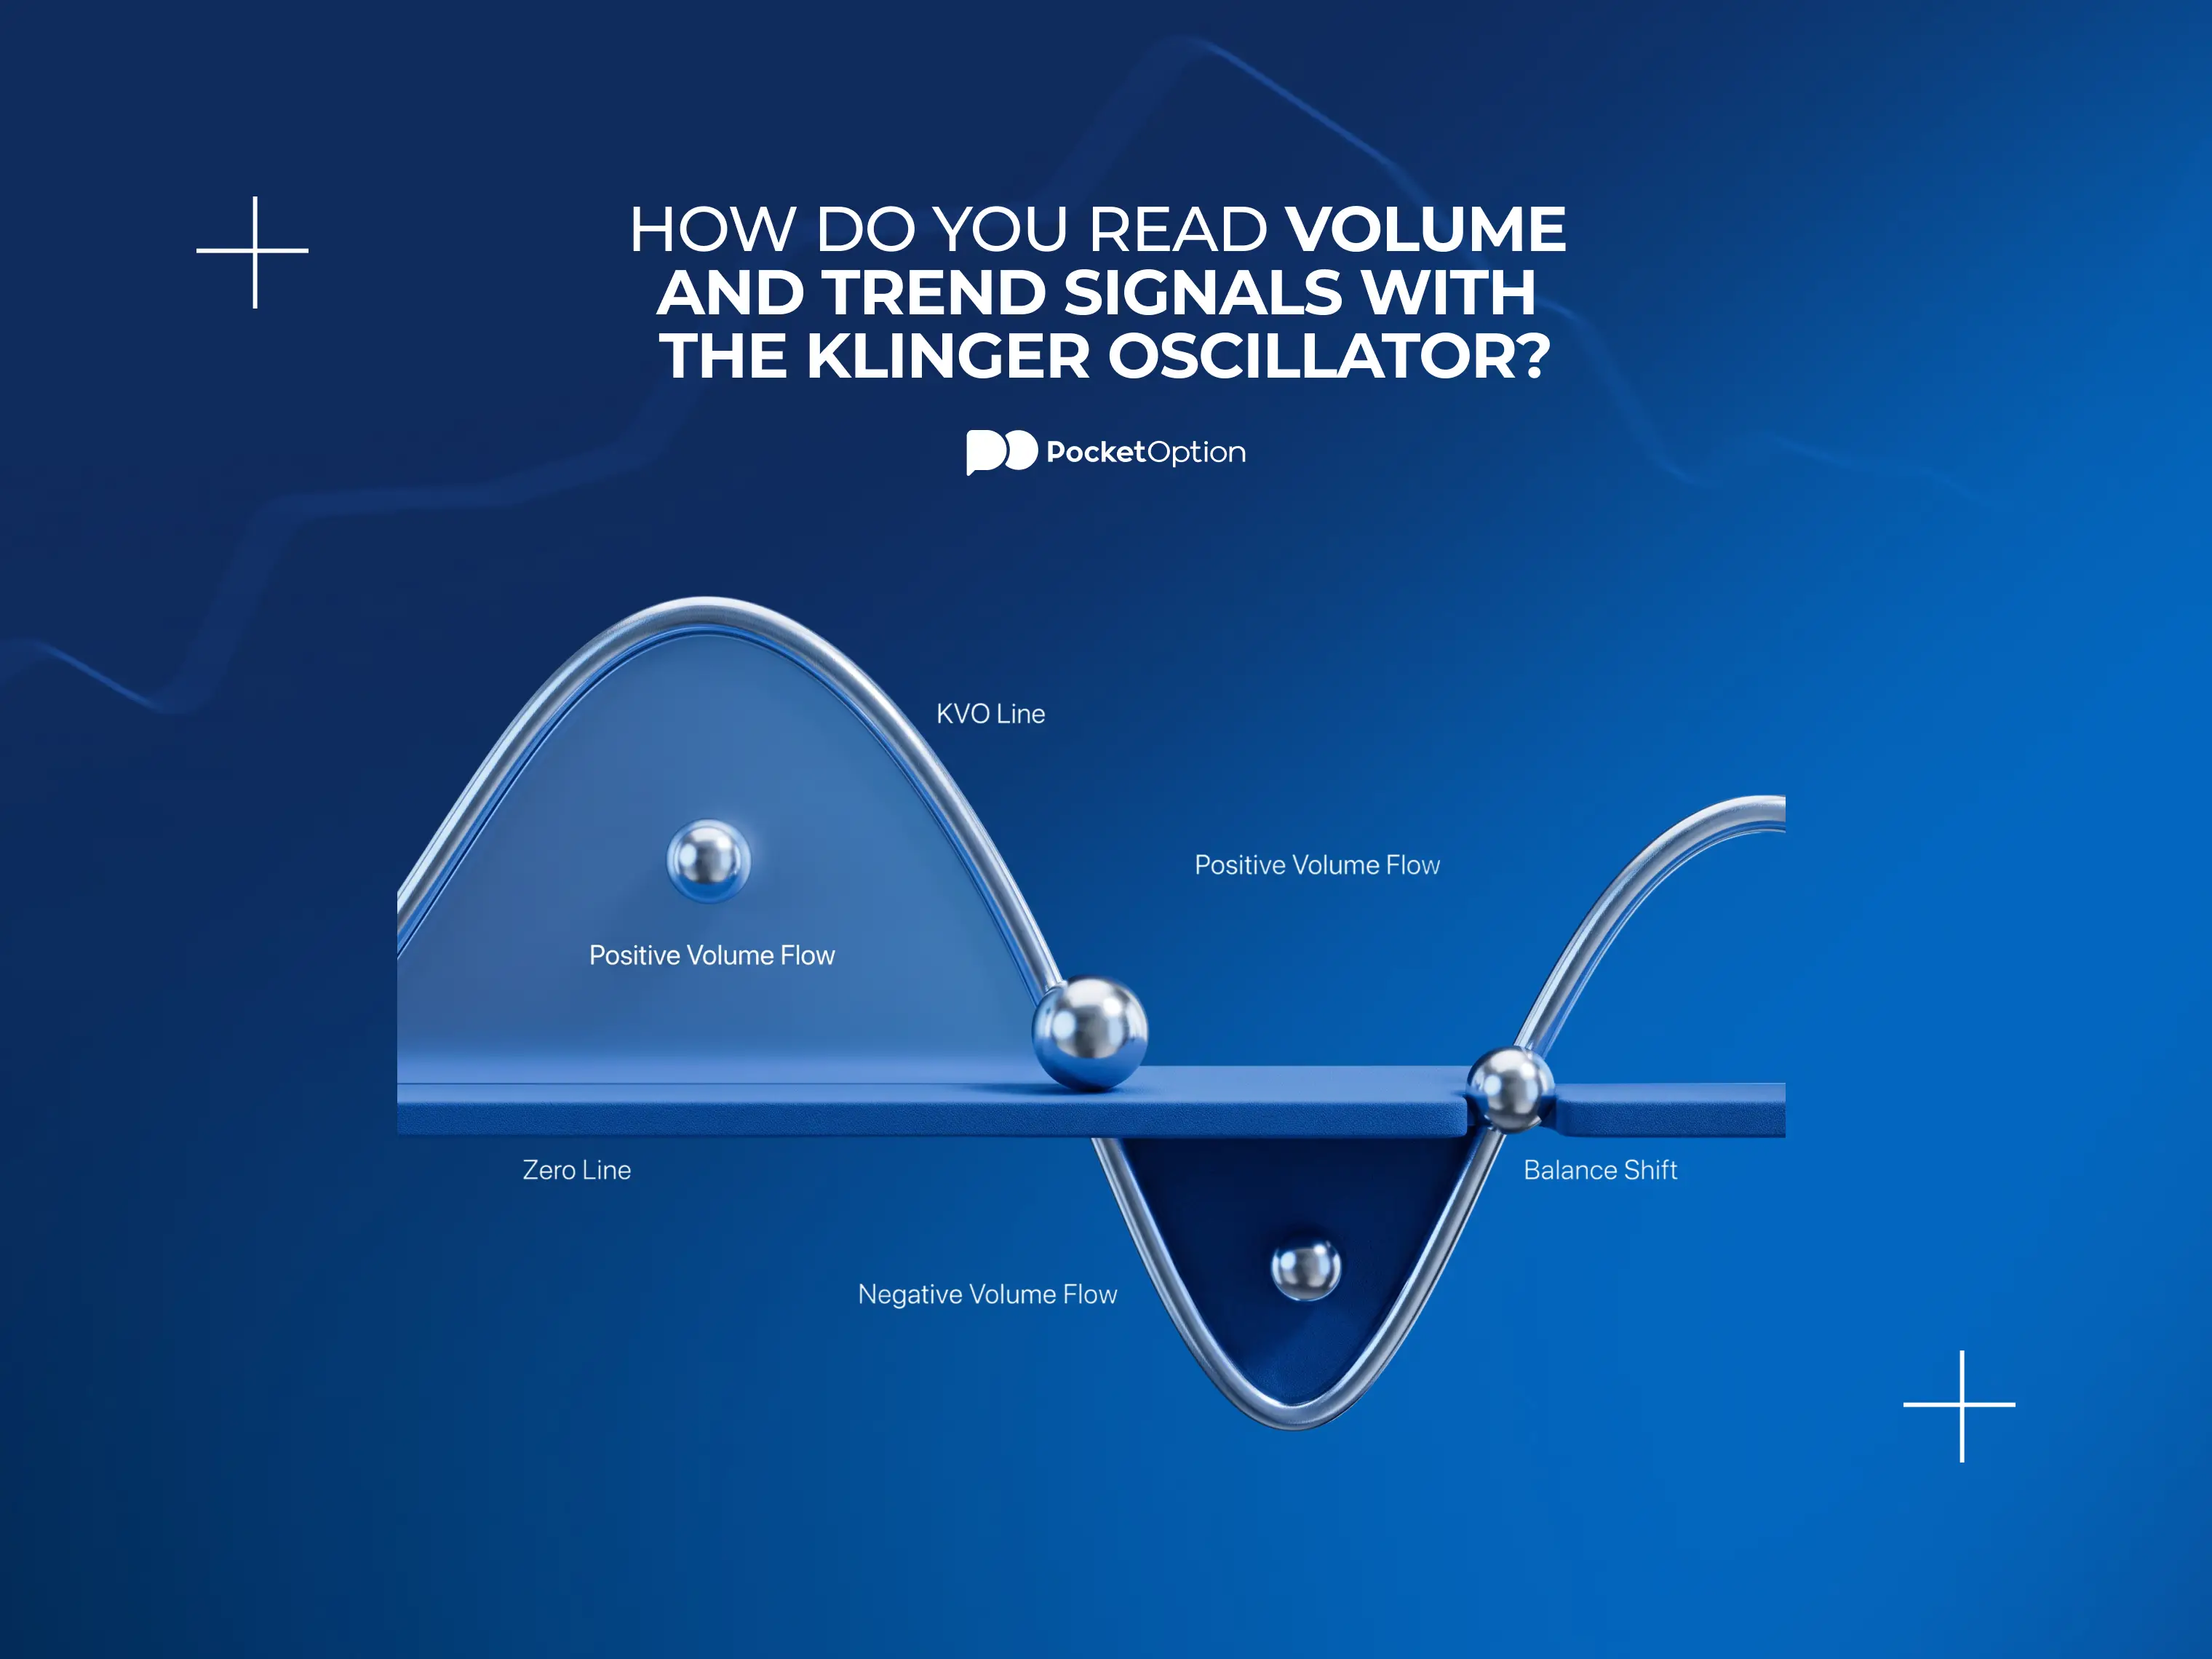
A handful of pieces make up how this Klinger oscillator reading actually gets used in practice: Volume Force, the KVO line itself, a signal line, the zero line, and divergence against price. Each piece gets its own look further down. Neither a positive nor a negative reading, on its own, amounts to a ready command to open a trade.
Seeing the Klinger oscillator actually respond to live price and volume tends to make the mechanics click faster than reading about them in the abstract.
Open a free demo account and watch how volume flow and price move together, using virtual funds.
Try Demo AccountCurious how this actually plays out against live price and volume? Reading about the mechanics only goes so far. Watching the KVO line respond to real price and volume shows the pattern faster than any explanation can.
Open ademo trading account and watch how volume flow and price move together, with virtual funds and nothing real on the line.
Klinger Volume Oscillator Formula: From Volume Force to KVO
The general shape of the klinger volume oscillator calculation starts with Volume Force, a measure that combines trading volume with the direction and extent of price movement over a given period. That combination produces a signed value: positive when the underlying pressure leans one way, negative when it leans the other.
From there, the klinger volume oscillator itself comes from comparing two smoothed versions of Volume Force, a faster-reacting average against a slower-reacting one. The gap between them is what actually gets plotted.
Step | Component | What It Represents |
|---|---|---|
Volume Force | Price movement combined with volume | A signed measure of directional pressure |
Fast smoothing | Shorter EMA of Volume Force | Reacts more quickly to recent changes |
Slow smoothing | Longer EMA of Volume Force | Reacts more slowly, smoother overall |
KVO line | Fast smoothing minus slow smoothing | The oscillator reading itself |
Signal line | Smoothed average of the KVO line | Used for reading crossovers |
None of this requires working through the underlying math by hand. What matters for reading a klinger volume oscillator chart is understanding what each piece represents, not memorizing the exact calculation.
Checking how this actually builds out on your own charts through your Pocket Option login account tends to make the mechanics click faster than reading through the formula alone.
Why the 34, 55, and 13 Periods Matter
A classic setup for the klinger volume oscillator formula uses a 34-period EMA for the faster smoothing, a 55-period EMA for the slower one, and a 13-period signal line on top. Shorter periods react faster and pick up more noise. Longer periods smooth things out further, trading responsiveness for stability.
None of these numbers get crowned the single best setting for every asset or every timeframe. They show up often as a starting reference, confirmed through documentation like TradingView's, not as a fixed rule every klinger volume oscillator formula has to follow.
Klinger Oscillator Signals: Start With the Signal-Line Crossover
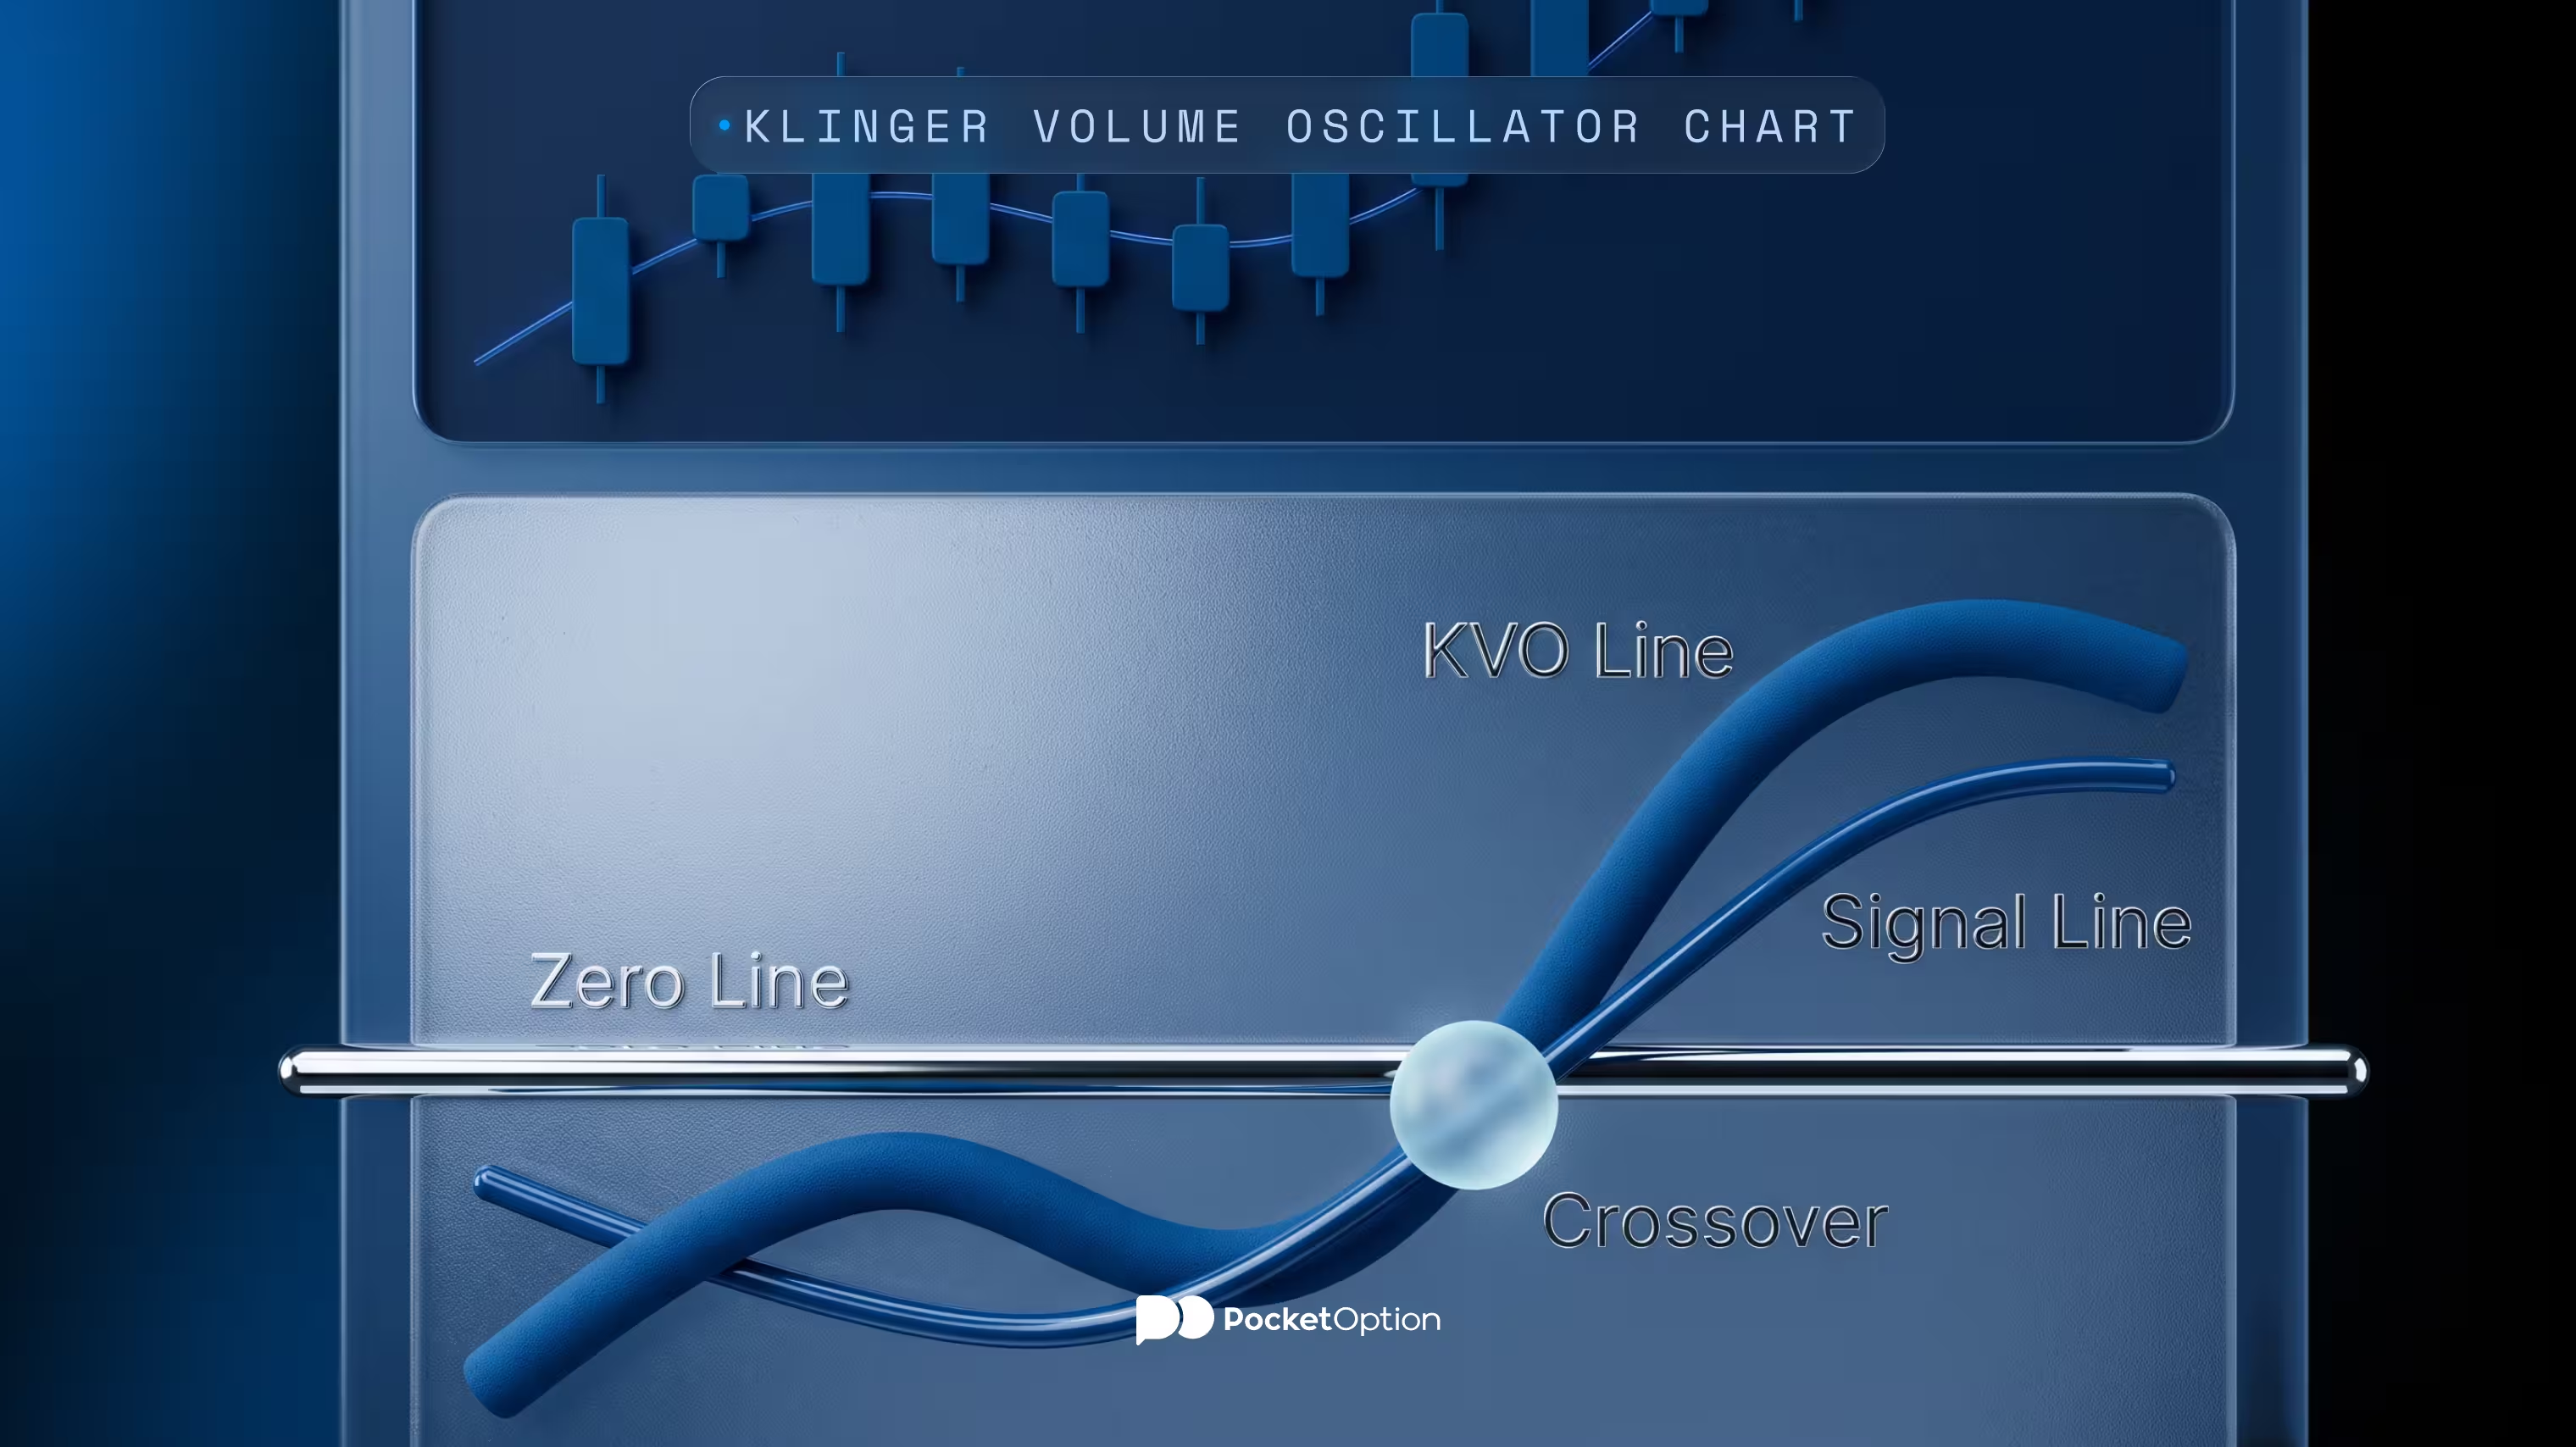
A crossover above the signal line means the KVO line has moved above its own smoothed average. A crossover below means the opposite. That direction can reflect a shift in momentum and volume-flow context, though what it actually means depends on where it happens relative to zero, the prevailing trend, and how price itself is behaving.
Calling every single crossover on a klinger indicator an automatic buy or sell signal overstates what one crossing actually shows on its own.
What the Zero Line Adds to the Picture
Where the reading sits relative to zero reflects the balance between the fast and slow EMA of Volume Force. Crossing that line marks a shift in that balance, not a guarantee the move continues. A kvo indicator can cross zero and snap right back within a short stretch, so that kind of signal isn't something worth reading in isolation.
KVO Divergence: When Price and Volume Flow Stop Agreeing
Bullish divergence shows up when price prints a lower low while KVO prints a higher low, volume-flow pressure quietly improving even as price keeps falling. Bearish divergence works the other way: price makes a higher high while KVO makes a lower high, that pressure weakening even as price still climbs.
Divergence can point toward the current move losing steam, without pinning down exactly when a reversal actually happens. TradingView specifically flags that premature and false divergence signals show up with this indicator, and a divergence pattern can persist for a stretch without price reacting to it right away. Treating divergence as a standalone reversal strategy skips past that uncertainty.
Why Trend Context Matters for KVO
Checking a KVO signal against the direction of the current trend and the broader price structure tends to say more than the signal alone. Picture two purely illustrative scenarios: a bullish signal-line crossover forming inside an established uptrend, price already making higher highs, versus that same direction of crossover showing up in a choppy or declining market with no clear structure. The first carries more context behind it.
The same logic applies in reverse for a bearish crossover. Confirmation here can mean checking price structure, a nearby support or resistance level, or one additional trend tool, not stacking multiple indicators together as a required combination. Agreement between pieces doesn't remove the risk of a false signal either.
Use Price Structure Before Adding More Indicators
A sequence of higher highs and higher lows, or lower highs and lower lows, tends to offer clearer context for a KVO reading than mechanically layering on several more oscillators. A moving average can serve as one simple example of trend context worth checking, without turning this into a separate strategy built around moving averages specifically.
When Klinger Oscillator Signals Can Mislead You
A handful of real limitations are worth keeping in mind:
False signal-line crossovers that don't lead anywhere durable
Zero-line crossings that reverse back quickly rather than holding
Divergence appearing well before any actual reversal, if one happens at all
Readings that can shift depending on the specific settings and volume data used
Disagreement between the indicator and price action in choppy conditions
Divergence doesn't show up before every reversal, and its presence alone doesn't reliably pin down timing. Adding a second indicator on top doesn't automatically resolve these limitations either. It just adds another input worth weighing alongside the rest.
Risk Disclaimer:Trading involves significant risk of capital loss. This article is for educational purposes only and does not constitute financial advice. Always conduct independent research and consider your risk tolerance before making any trading decisions.
See more:InterestingTrading Strategies