How Do You Read Momentum Signals With the True Strength Index (TSI)?
The true strength index is a momentum oscillator built on double-smoothed price change, oscillating around a zero line. This guide covers the formula, how settings change sensitivity, zero-line and signal-line crossovers, divergence, and its limits.

True Strength Index: What TSI Actually Measures
Water passed through two filters in sequence comes out cleaner than water passed through just one. The first filter catches the big particles. The second filter, working on water that's already been through the first, catches what's left over. The true strength index runs on a similar idea, just with price data standing in for water.
It's a momentum oscillator: a tool built to gauge the direction and strength of momentum by smoothing price changes not once but twice. The result oscillates around a zero line. A positive true strength index reading reflects positive smoothed momentum. A negative reading reflects the opposite. Neither one, on its own, amounts to a ready signal to open a trade. Reading the true strength index this way, as a momentum gauge rather than a verdict, sets up everything that follows.
A handful of pieces make up how this actually gets read in practice: the underlying formula, where the line sits relative to zero, its relationship to a signal line, divergence against price, and how current readings compare to past extremes. Each piece gets its own look further down.
Seeing how the true strength index actually behaves against live price movement tends to make the concept click faster than any explanation alone.
Open a free demo account and watch momentum indicators respond to real price action, using virtual funds.
Try Demo AccountCurious how this actually looks on a live chart? Reading about momentum shifts only goes so far. Watching the indicator respond to real price movement shows the pattern faster than any description can.
Open a demo trading account and watch how momentum readings shift alongside real price action, with virtual funds and nothing real on the line.
True Strength Index Formula: Why Double Smoothing Matters
The general shape of the tsi indicator formula looks like this: take the double-smoothed price change, divide it by the double-smoothed absolute price change, then multiply the result by 100. That's the structure. The reasoning behind it matters more than memorizing the exact math.
Smoothing the regular price change captures direction, since gains and losses partially cancel out over the smoothing window. Smoothing the absolute price change separately captures overall magnitude of movement, regardless of direction, since nothing cancels out when every value gets treated as positive. Dividing one by the other produces a ratio that reflects both how strongly price has been moving and which way. That's what makes the tsi indicator distinct from a plain single-smoothed momentum measure.
Step | Calculation | Purpose |
|---|---|---|
Price change | Current price minus prior price | Captures raw directional movement |
First smoothing | Smooth the price change over a chosen period | Reduces short-term noise |
Second smoothing | Smooth that already-smoothed result again | Further reduces noise, double-filtered |
Absolute price change | Same price change, treated as always positive | Captures magnitude regardless of direction |
Double-smoothed absolute change | Same two-step smoothing applied to the absolute version | Produces a magnitude baseline for comparison |
Final ratio | Double-smoothed change ÷ double-smoothed absolute change × 100 | Produces the TSI reading itself |
A classic sequence uses 25 periods for the first smoothing pass and 13 for the second, with the tsi indicator often paired with its own signal line on top of that. That combination shows up often as an example, not as the one correct setting for every market, every instrument, or every timeframe.
Checking how these settings actually change the reading, directly through your Pocket Option login account against a live chart, tends to make the underlying logic click faster than working through it in the abstract.
How TSI Settings Change the Indicator's Sensitivity
Shorter smoothing periods make the true strength indicator react faster to price changes, picking up shifts sooner but also picking up more noise along the way. Longer periods smooth that reaction out further, trading responsiveness for a steadier read. The signal-line period works the same way in miniature: a shorter one reacts faster to the TSI line itself, a longer one lags further behind it. No single combination gets crowned the best setting here, since the right balance depends on the instrument, the timeframe, and what a given trader is actually trying to catch.
TSI Indicator Signals: Start With the Zero Line
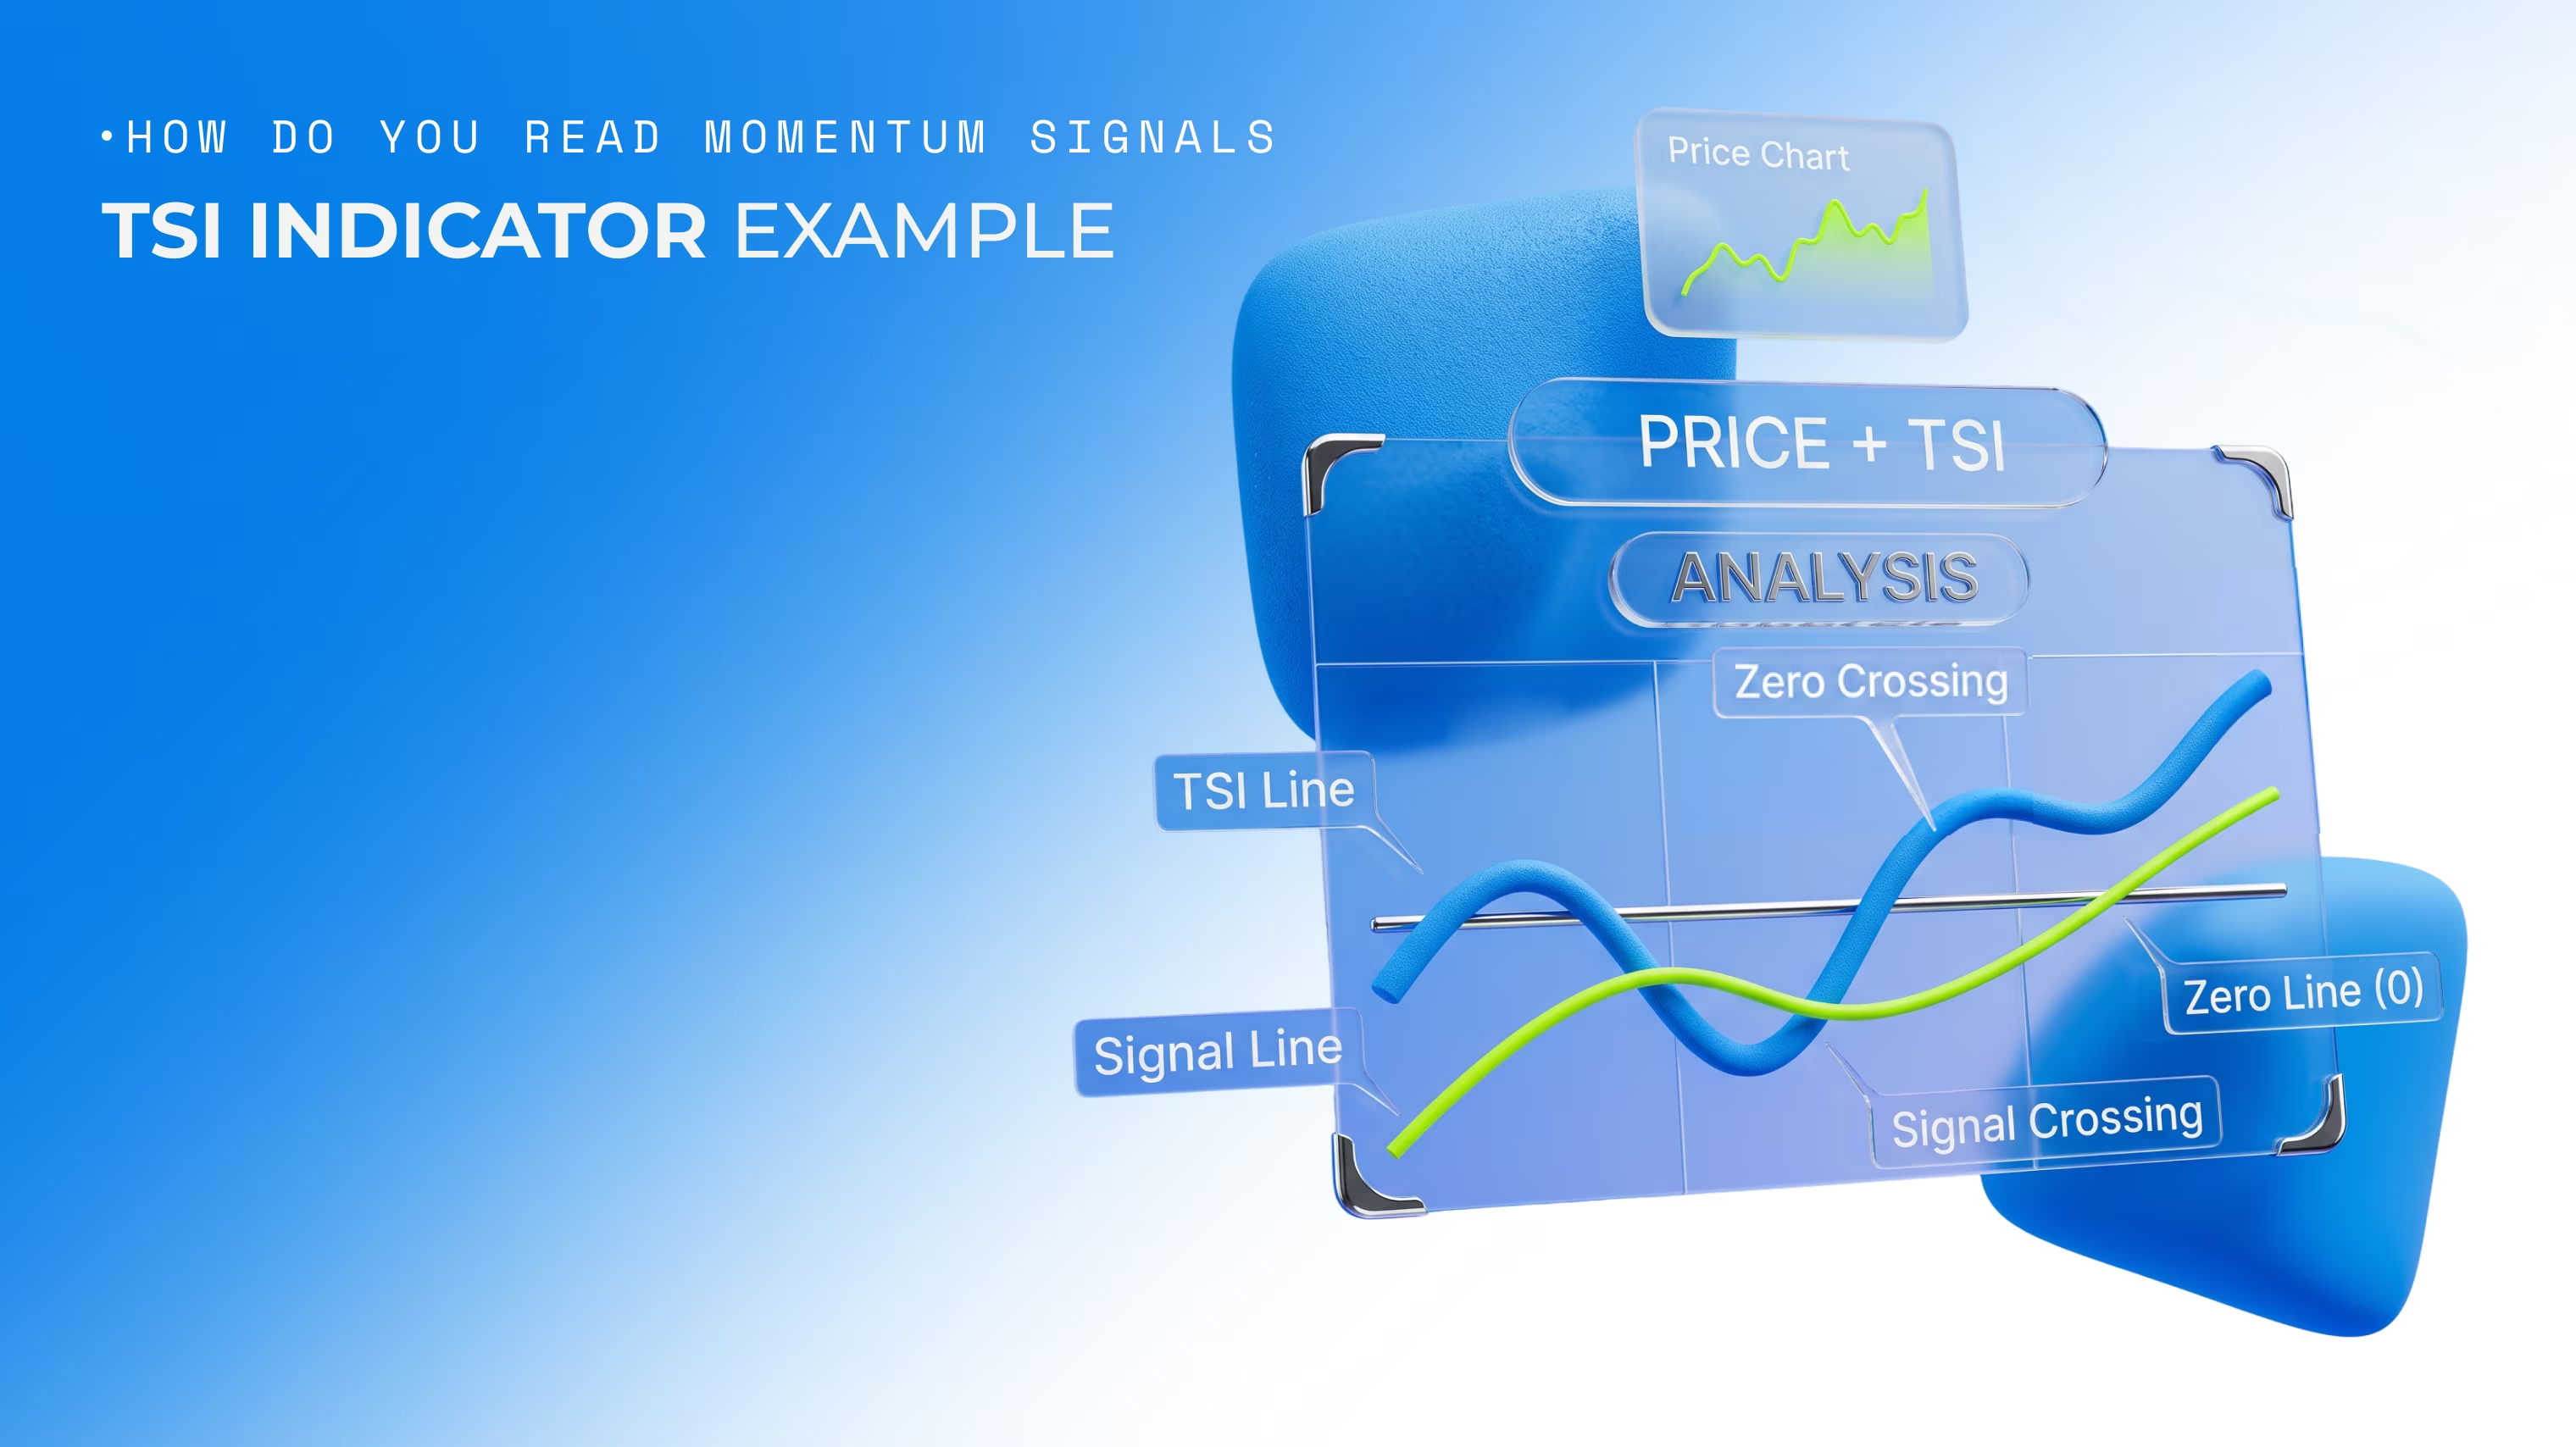
Centerline interpretation is the simplest starting point for reading a true strength index indicator. Above zero reflects positive smoothed momentum. Below zero reflects the opposite. Crossing that line marks a shift in the momentum backdrop itself, not an automatic command to buy or sell whatever happens to be moving.
Picture a purely illustrative scenario: price has been drifting sideways while the true strength index indicator sits just under zero. A modest upward move in price coincides with the line crossing above zero. That crossing says something changed in the underlying momentum picture. It doesn't say how far the move continues from there, or whether it holds.
What a Signal-Line Crossover Adds
A signal line adds a second layer on top of the true strength index formula itself, typically a moving average of the TSI line. A signal-line crossover can react faster to shorter-term momentum shifts than a zero-line crossover does. That speed cuts both ways. Crossings between the TSI and its signal line, built directly from the true strength index formula, can happen often, and more than a few turn out to be false signals rather than the start of anything durable.
TSI Divergence: When Price and Momentum Stop Agreeing
Bullish divergence shows up when price prints a lower low while the indicator prints a higher low, momentum quietly improving even as price keeps falling. Bearish divergence works the other way: price makes a higher high while the indicator makes a lower high, momentum weakening even as price still climbs.
In tsi trading specifically, divergence gets treated as a sign that current momentum may be losing steam, not as a timer counting down to an exact reversal. A divergence pattern can persist for a long stretch before price actually turns, if it turns at all within any useful timeframe. Treating divergence as a standalone reversal strategy skips past that uncertainty.
Overbought and Oversold With TSI: Why Fixed Levels Can Mislead
Comparing a current reading against historical extremes for that specific instrument offers one way to gauge how stretched a move looks. A single universal set of overbought or oversold levels doesn't hold up well across different assets, though, since typical range depends on the instrument's own volatility, the smoothing settings chosen, and its historical behavior specifically. Reaching some particular level, on its own, doesn't mean a reversal is imminent, any more than tsi divergence guarantees one on a fixed schedule.
TSI Trading: How to Put the Signals in Context
Several pieces can get weighed together: where the reading sits relative to zero, its current direction, its behavior relative to the signal line, and any divergence against price. Price structure and the broader trend add outside context beyond the indicator itself.
Picture two purely illustrative scenarios. In one, the reading sits above zero, trending upward, tracking above its signal line, with price making higher highs alongside it, several pieces pointing the same direction at once. In the other, the reading sits above zero but trending down, with price still climbing, a genuine disagreement between price and momentum. Neither scenario amounts to a fixed checklist promising a profitable setup.
When the True Strength Index Can Mislead You
A handful of real limitations are worth keeping in mind:
Lag from the double-smoothing process itself, since the indicator reacts to price that's already moved
Frequent signal-line crossovers that don't lead anywhere durable
False signals showing up during choppy, directionless conditions
Divergence appearing without any reversal actually following it
Meaningfully different readings depending on which settings and timeframe get used
None of this means adding a second indicator on top automatically clears up false signals. It's worth evaluating this reading alongside price action and the broader market context it's actually operating in, rather than treating any single signal as sufficient on its own.
Risk Disclaimer: Trading involves significant risk of capital loss. This article is for educational purposes only and does not constitute financial advice. Always conduct independent research and consider your risk tolerance before making any trading decisions.
See more:InterestingTrading Strategies