How Do Bullish and Bearish MACD Crossovers Work?
A macd trading strategy built around crossovers means reading each cross as a shift in momentum context, not a guaranteed signal. This guide covers bullish and bearish crossovers, why zero line position matters, and how to weigh a cross against trend and price structure.

MACD Crossover Strategy: What the Cross Actually Means
A car's instant speedometer reading and a smoothed average of your last few minutes of driving tell two different stories. When current speed climbs above that smoothed average, real acceleration has been happening relative to your own recent pace. That crossing point only shows up after the acceleration has already been underway for a while, since the average needs time to catch up. A macd trading strategy built around crossovers runs on a similar principle.
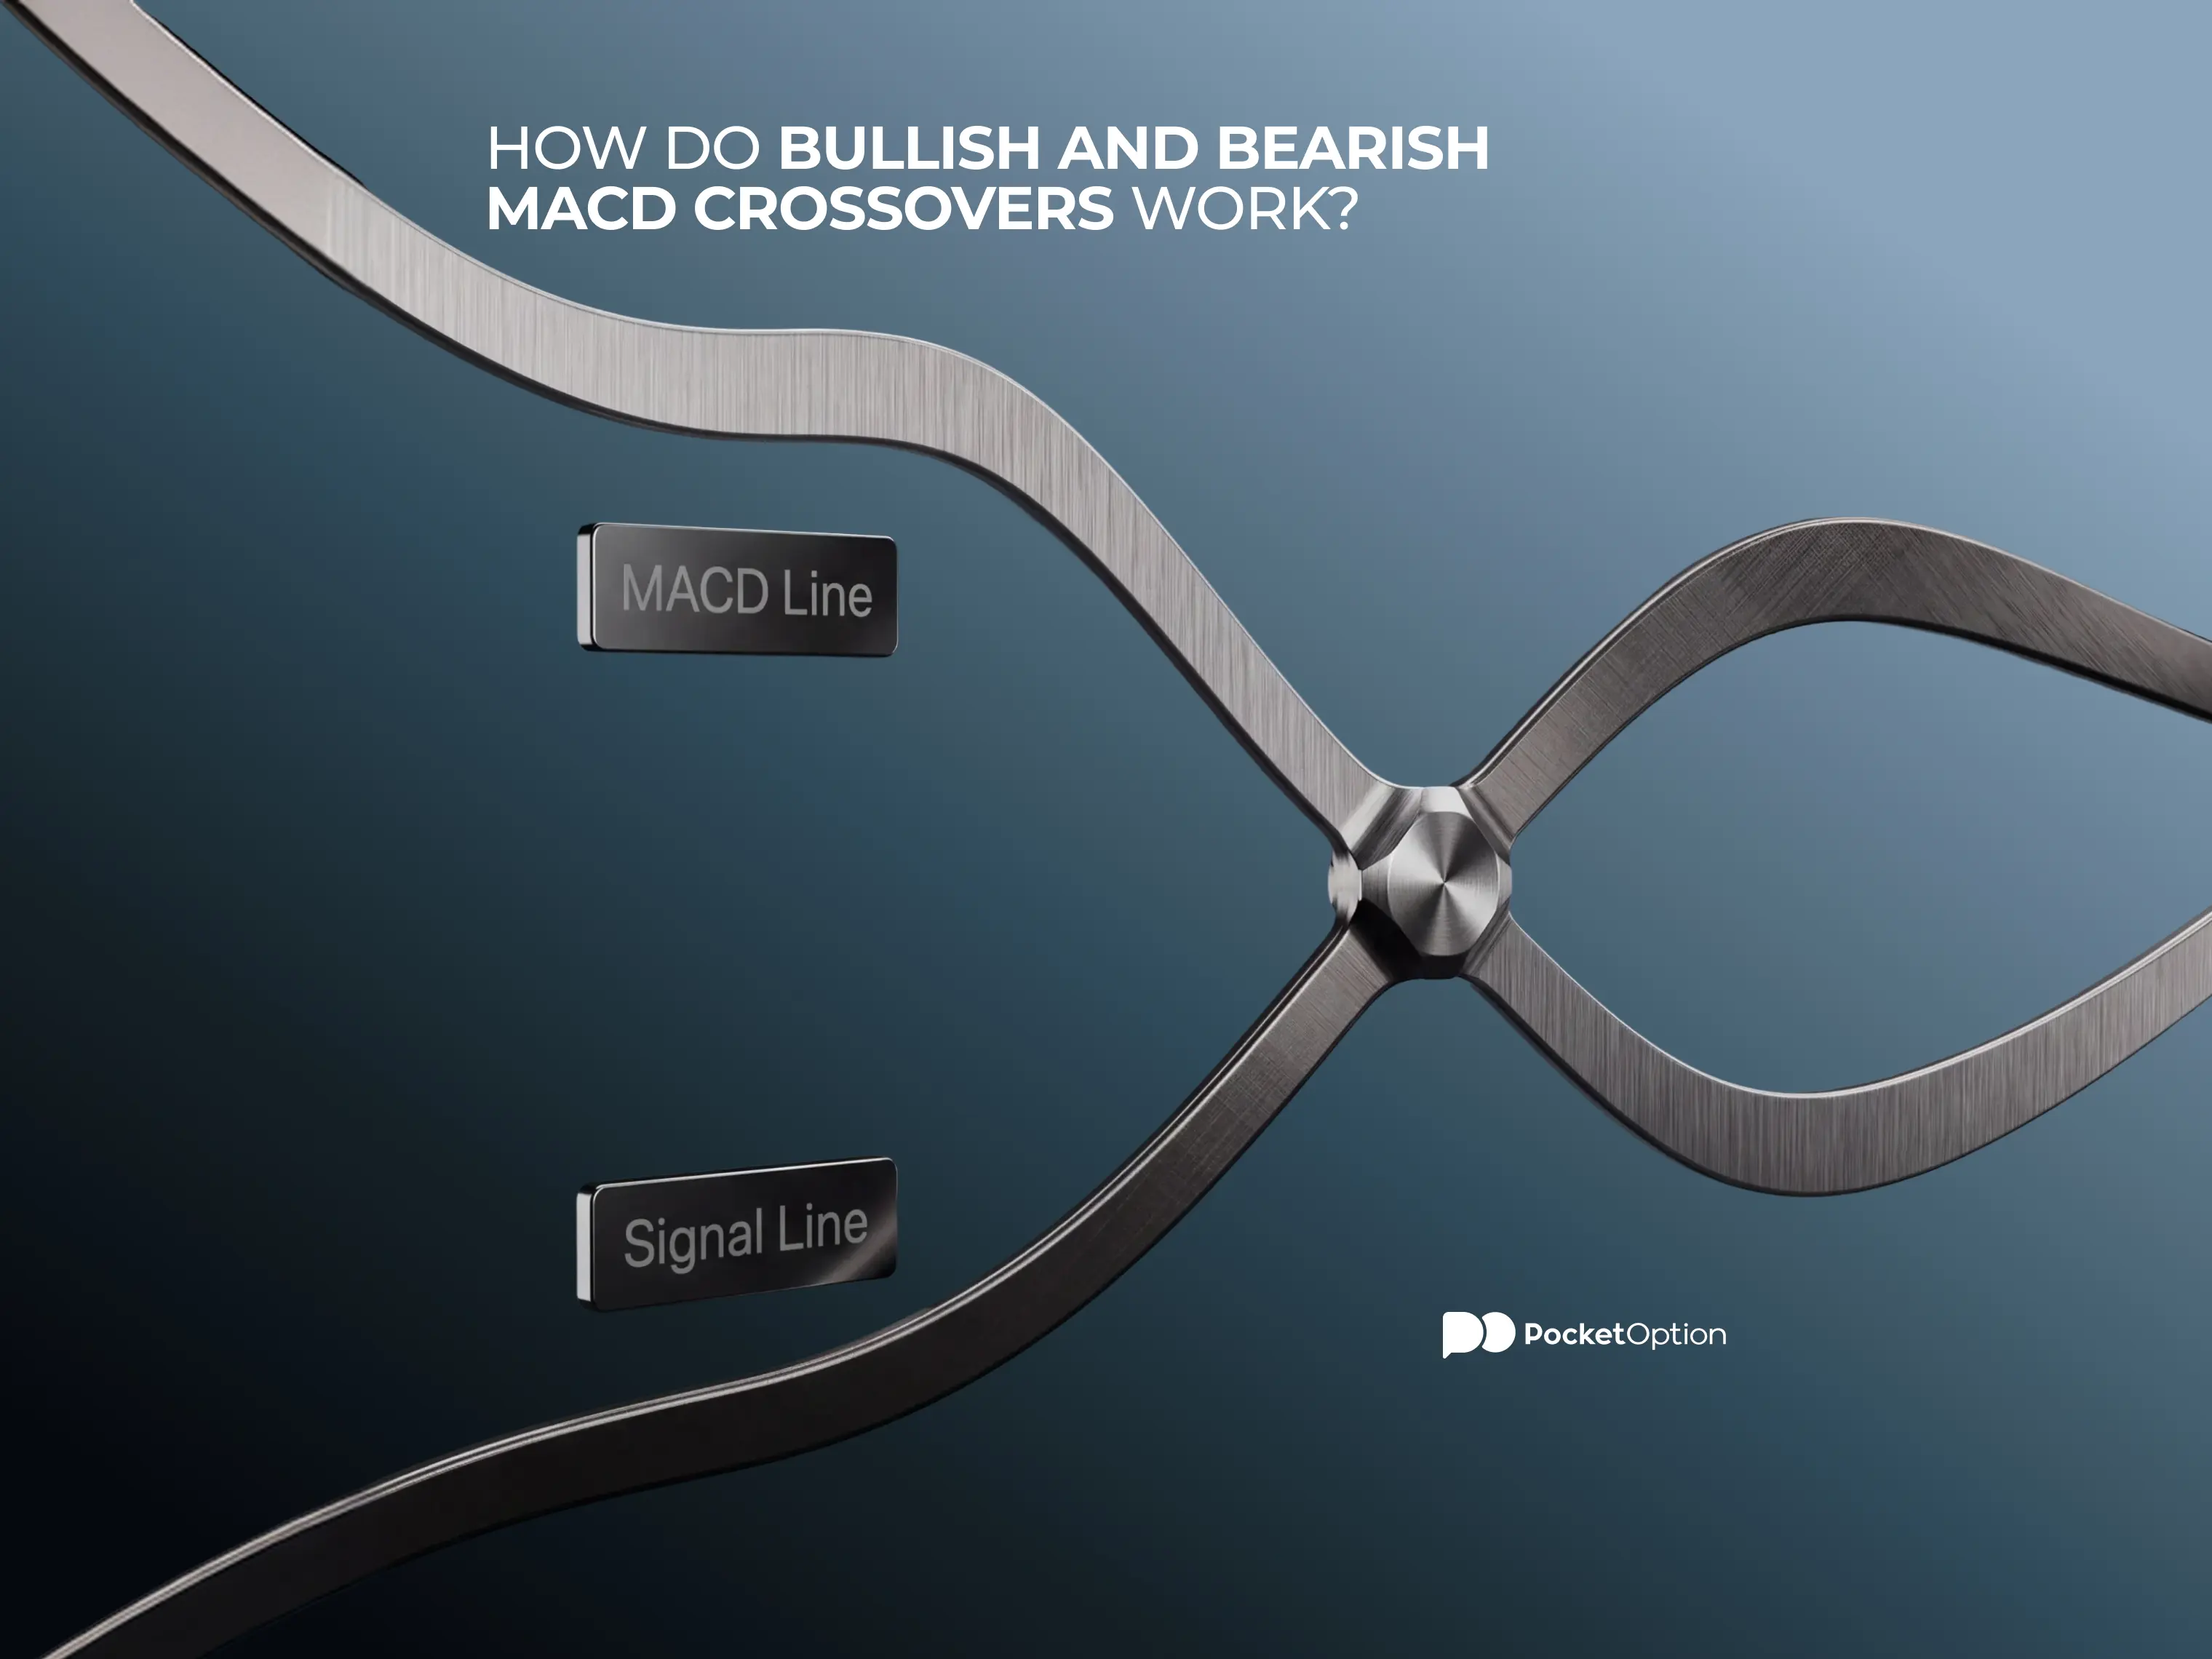
MACD line tracks the gap between a faster moving average and a slower one, reacting relatively quickly to price change. Signal line is a smoothed average of the MACD line itself, reacting more slowly. A crossover happens when these two lines swap positions relative to each other. Histogram just visualizes that gap as bars, shrinking toward zero as the lines converge and growing as they pull apart. None of this is a full MACD walkthrough. It's the minimum needed to make sense of what a crossover actually shows.
What a crossover reflects is a shift in momentum context, not a forecast of where price heads next. Building a macd trading strategy around crossovers means treating each cross as one data point about changing momentum, not a prediction with a guaranteed outcome attached. None of that makes a macd trading strategy inherently unreliable. It means treating the cross as context, not as a standalone verdict.
Open a free demo account and watch MACD line and signal line behave against real price action, using virtual funds.
Try Demo AccountCurious how this actually plays out against live price movement? Reading about crossovers only goes so far. Watching the MACD line and signal line actually move shows the pattern faster than any explanation can.
Open a demo trading account and watch how these lines behave in real time, with virtual funds and nothing real on the line.
Bullish and Bearish MACD Crossovers: Reading Both Sides
The direction of a crossover splits into two basic types, each reflecting a different momentum shift. Neither type on its own accounts for where MACD sits relative to zero, the prevailing price trend, or the surrounding market structure. Those pieces come later. Here's just the basic direction.
Crossover | What Happens | Momentum Context | What It Does Not Guarantee |
|---|---|---|---|
Bullish | MACD line crosses above signal line | Momentum shifting upward | A new uptrend or a profitable trade |
Bearish | MACD line crosses below signal line | Momentum shifting downward | A new downtrend or a profitable trade |
Any macd strategy built on crossovers alone, without checking these other pieces, skips past context that genuinely matters. Checking your own charts directly through your Pocket Option login account tends to make bullish and bearish crossovers easier to tell apart than reading about them alone, and it's a habit worth building into any macd strategy from the start.
Bullish MACD Crossover: When the MACD Line Moves Above the Signal Line
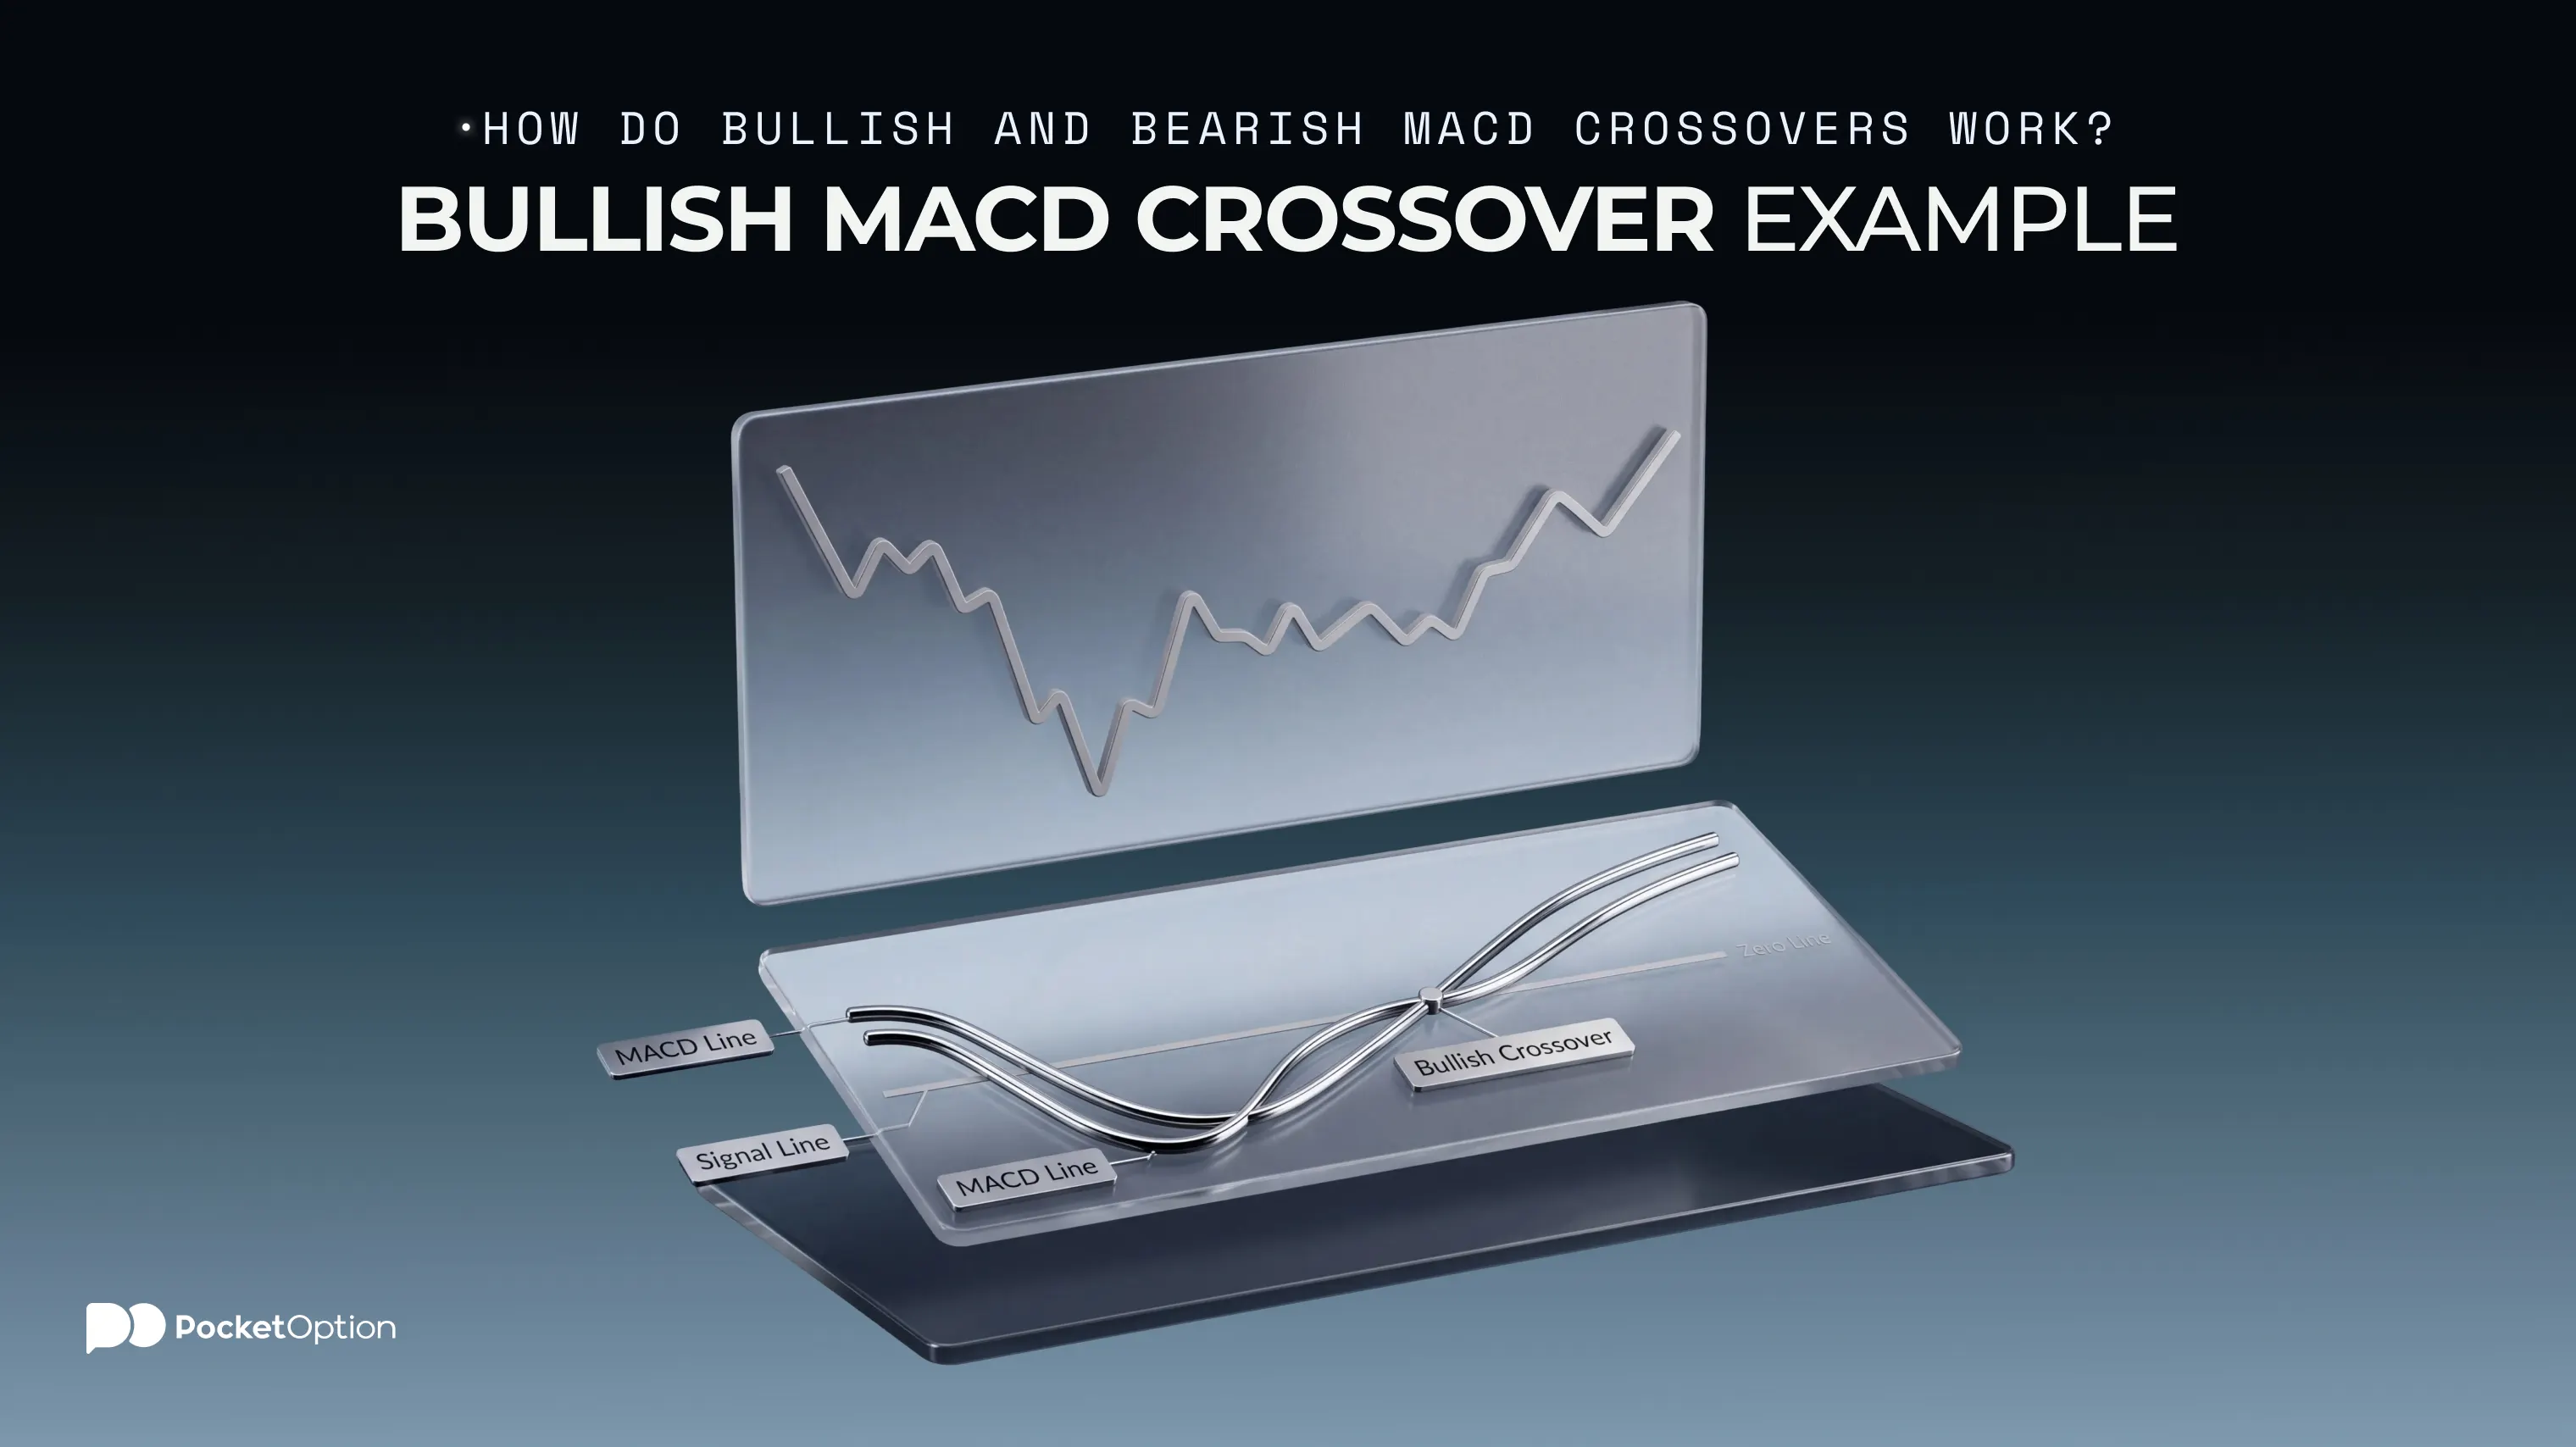
The MACD line moving from below the signal line to above it marks this specific direction of the cross. Picture a purely illustrative scenario: price has been drifting, then starts climbing modestly as a macd crossover happens in this direction. The shift signals improving upward momentum. It doesn't, on its own, confirm a new uptrend is actually underway. Calling every macd crossover in this direction a buy signal without checking the surrounding context overstates what one cross actually shows. Reading a macd crossover this way, as one input rather than a verdict, keeps expectations realistic.
Bearish MACD Crossover: When the MACD Line Drops Below the Signal Line
The MACD line moving from above the signal line to below it marks the opposite direction. On a similarly illustrative example, price stalling and then easing lower as the lines cross downward shows the same logic in reverse, momentum shifting toward the downside. That doesn't mean a sustained downtrend has automatically started. Any macd crossover strategy that treats this direction as an automatic sell signal skips past that same need for context. Applying a macd crossover strategy consistently to both directions, rather than trusting one side more than the other, keeps the approach balanced.
Why the Zero Line Changes the Crossover Context
The same crossover pattern can carry a different context depending on where it happens relative to zero. Above zero, the MACD value reflects the faster moving average sitting above the slower one overall. Below zero, that relationship flips, the faster average sits below the slower one overall.
Picture two purely illustrative scenarios: a cross happening below zero, where momentum is turning up but still starting from an overall weaker footing, versus that same direction of cross happening above zero, where momentum was already positioned more favorably to begin with. The reverse logic applies on the downside too. A macd signal line crossover doesn't become automatically reliable or automatically false just from its position relative to zero. It's added context, not a verdict on its own.
MACD Trading Strategy: Why a Crossover Needs Context
Checking a crossover against the direction of the broader trend, the price structure, and where price sits relative to meaningful support or resistance areas tends to say more than the crossover alone. Where relevant volume data exists for a given market, a genuine shift in trading activity around the cross can add another layer, though treating volume as a required confirmation everywhere overstates what's actually available across every market.
Picture two purely illustrative examples. A bullish macd crossover forming inside an established uptrend, with price already making higher highs, lines up several pieces pointing the same direction at once. A bearish cross forming while price keeps climbing tells a different story, a genuine disagreement between the signal and the broader structure. Neither example amounts to a fixed checklist, and agreement between pieces here doesn't remove the risk of a false signal.
Check the Trend and Price Structure First
Picture a purely illustrative comparison: a bullish cross forming inside a clearly established uptrend, where price has been making higher highs and higher lows, versus that same direction of cross showing up in a chaotic, directionless market with no clear structure. The first carries more context behind it. A bearish macd crossover forming inside a clear downtrend, price making lower highs and lower lows, works the same way in reverse. None of this requires a rigid checklist. Crossovers lining up with the prevailing trend tend to get read differently than ones fighting against it.
Use Support, Resistance, and Volume as Context
How close a crossover sits to a notable support or resistance area can shift how it gets read. A cross happening right at a level people are already watching carries different weight than one happening in open space with nothing nearby. Where relevant volume data exists for a given market, a genuine pickup in trading activity around the cross can add supporting information about how many participants are actually involved in that price move. None of this means a level breaking or volume increasing automatically confirms anything, and there's no universal threshold that applies the same way across every market.
When MACD Crossovers Turn Into False Signals
A handful of real limitations are worth keeping in mind:
Lag baked into the moving averages themselves, since both lines react to price that's already moved
Whipsaw during choppy or weak-trend conditions, with frequent crossings in opposite directions that don't lead anywhere
A cross showing up only after part of the actual price move has already happened
Conflict between the crossover and the broader price structure or prevailing trend
Adjusting the underlying settings can change how sensitive or how delayed a crossover shows up, though the specifics of tuning those settings belong to a separate discussion, not this one. Adding a second indicator on top doesn't eliminate false signals either. It just adds another input worth weighing alongside the rest.
Risk Disclaimer: Trading involves significant risk of capital loss. This article is for educational purposes only and does not constitute financial advice. Always conduct independent research and consider your risk tolerance before making any trading decisions.
Ver más:InterestingTrading Strategies