How Do You Read Volume Profile Levels in Trading?
Volume profile shows which price levels saw the most trading activity during a chosen period, not just when trading happened. This guide covers POC, Value Area, HVN, LVN, and where these levels can mislead you.

What Is Volume Profile in Trading?
Counting how many people pass a certain spot each hour tells you about busy times of day. It doesn't tell you where along a long street people actually stopped, gathered, and spent time. Volume profile asks that second kind of question about a market instead of the first.
Standard volume, the kind shown as a histogram beneath most charts, plots how much trading happened over time. Volume profile plots that same trading activity differently: horizontally, against price, showing which specific price levels saw the most activity during a chosen period. Volume profile doesn't ask when trading happened. It asks where, in terms of price.
A tall bar on that kind of chart marks a price level where a large amount of trading activity took place. A short bar marks a level that saw comparatively little. None of this, by itself, says whether that activity was buying pressure or selling pressure pushing price around. Volume profile shows where activity concentrated, not which direction it leaned.
Seeing volume profile actually build out on a live chart tends to make the concept click faster than reading about it in the abstract.
Open a free demo account and see how trading activity distributes across price levels, using virtual funds.
Try Demo AccountCurious what this actually looks like while the price is moving? Reading about the concept only goes so far. Watching the profile build out bar by bar against live price shows the pattern faster than any explanation can.
Open a demo trading account and watch how trading activity actually distributes across price levels, with virtual funds and nothing real on the line.
POC and Value Area: Where Most Trading Took Place
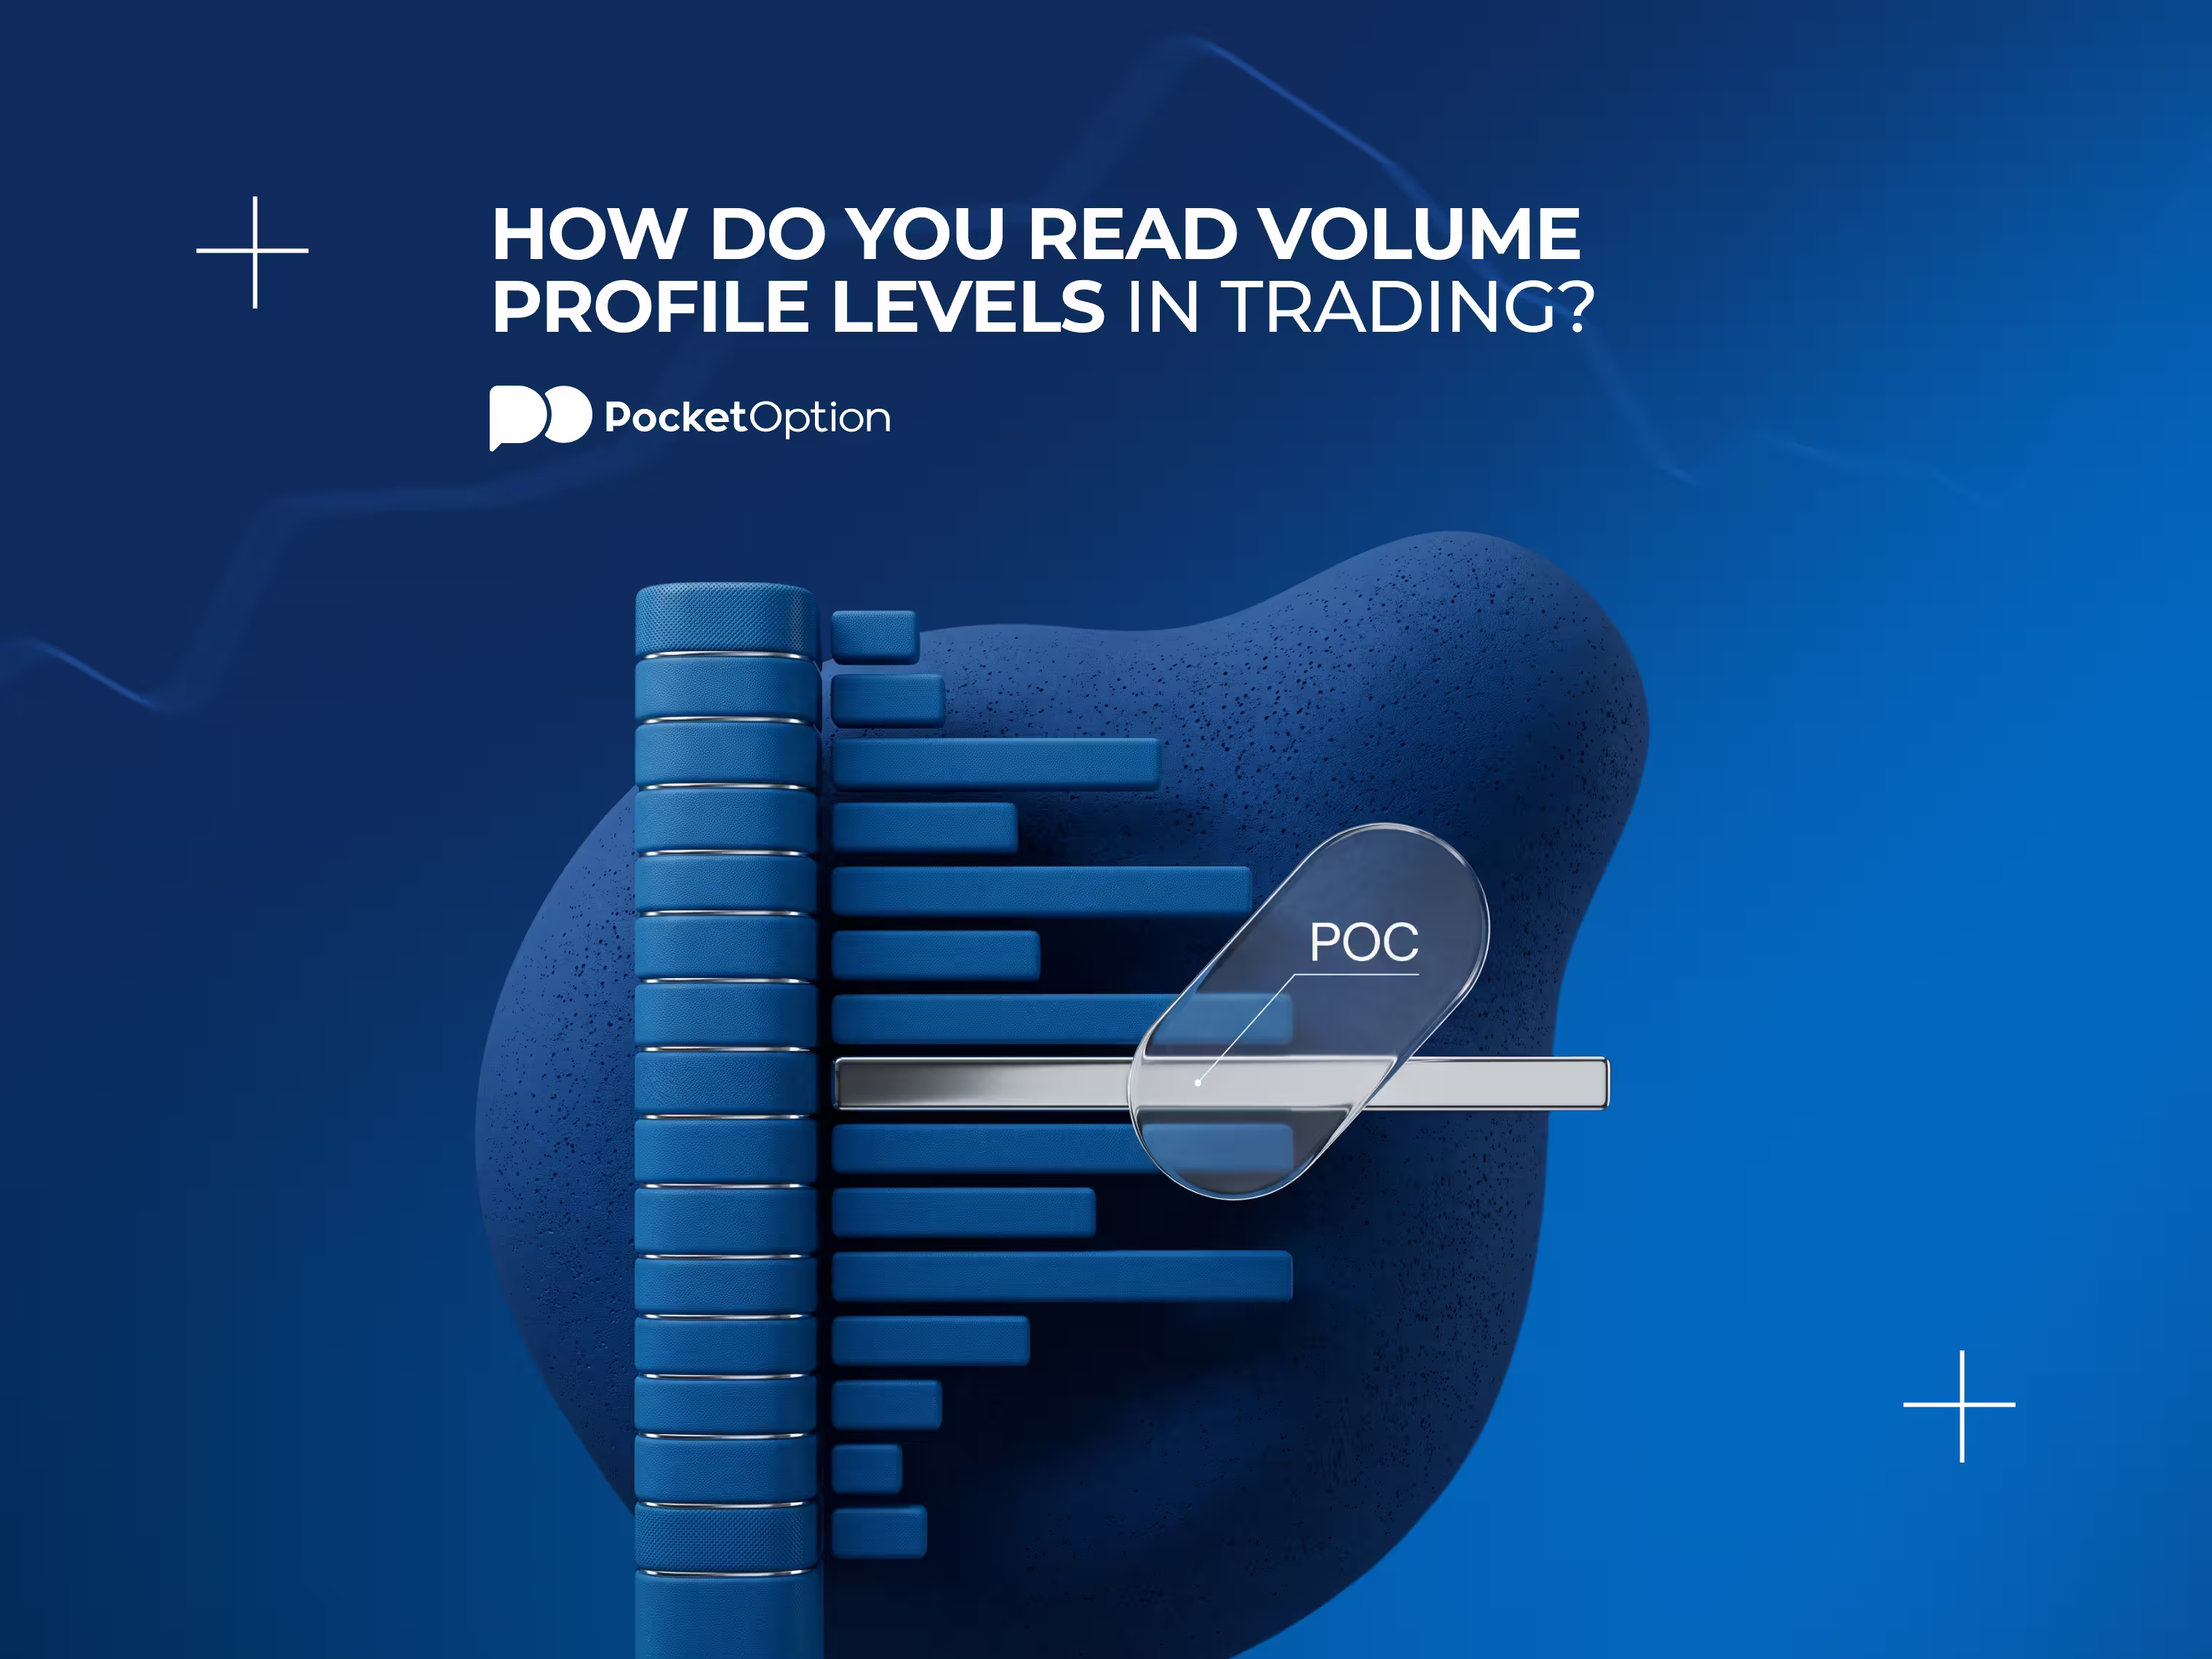
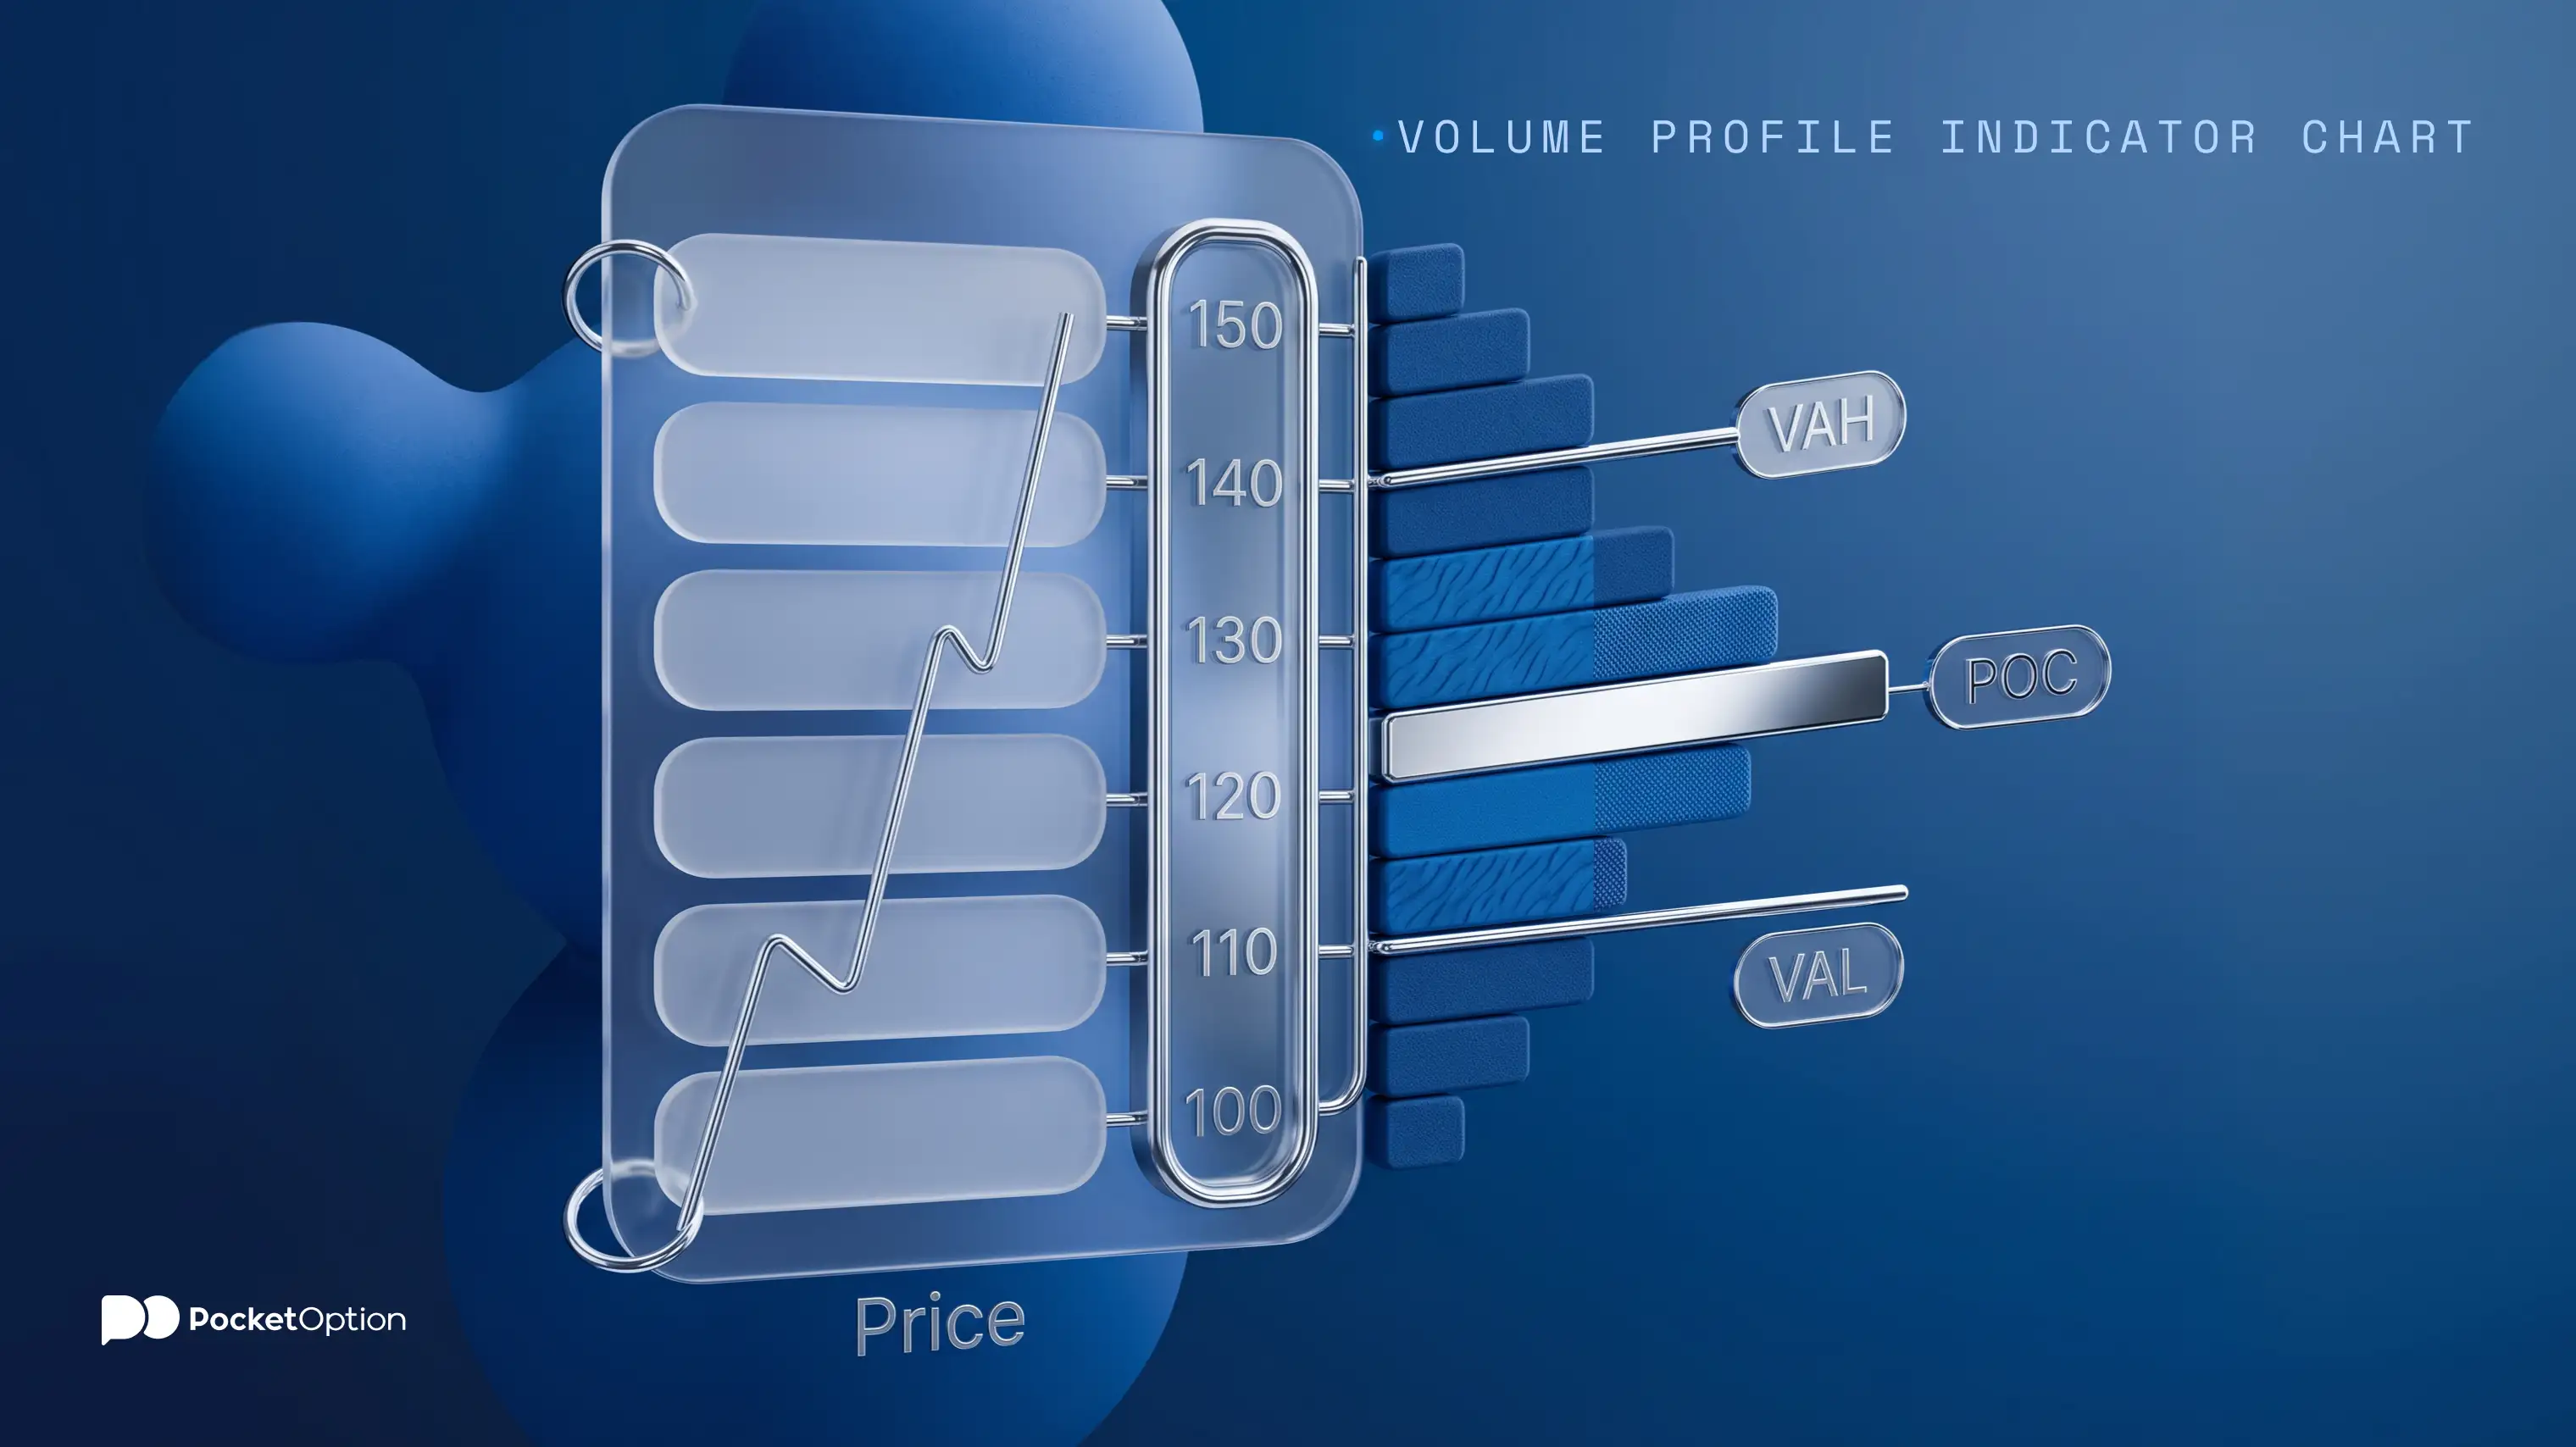
Point of Control, POC, marks the single price level with the highest traded volume inside a given profile. It's the tallest bar on the chart, the level where the most activity concentrated during that period.
Value Area extends outward from there, covering a chosen share of the total volume in that profile, commonly 70 percent, though that percentage isn't a fixed setting every instrument or platform has to follow. Value Area High, VAH, and Value Area Low, VAL, mark the top and bottom edges of that range.
Level | What It Shows |
|---|---|
Point of Control (POC) | The single price level with the highest traded volume in the profile |
Value Area High (VAH) | The upper edge of the range covering the chosen share of total volume |
Value Area Low (VAL) | The lower edge of that same range |
High Volume Node (HVN) | A price area with relatively concentrated trading activity |
Low Volume Node (LVN) | A price area with noticeably less trading activity |
None of these levels comes with a fixed meaning attached. Grasping volume profile fixed range meaning for a specific chart means reading POC and Value Area against what price is actually doing around them, not treating either one as an automatic support or resistance level on its own.
Checking these levels directly on your own charts through your Pocket Option login account tends to make the relationship between POC and price easier to follow than reading about it alone.
Volume Profile Indicator: Inside vs Outside the Value Area
Where price sits relative to VAH, VAL, and the broader Value Area adds a layer of context on any volume profile indicator. Price moving inside that range sits within an area that previously saw substantial activity. Price moving outside it has left that zone behind, for whatever reason.
Treating a move above VAH as an automatic buy, or a move below VAL as an automatic sell, overstates what a volume profile indicator actually shows on its own. Whether that move outside the Value Area continues or reverses back inside depends on factors the indicator itself doesn't capture.
HVN and LVN: Reading the Peaks and Gaps in Volume
High Volume Nodes mark areas of the profile with relatively concentrated trading activity, tall sections where a lot of volume built up. Low Volume Nodes mark the opposite: noticeably thinner sections where comparatively little activity took place.
Part of answering what is volume profile in trading in practical terms means understanding what these two node types actually represent. An HVN reflects a price area the market spent real time trading through. An LVN reflects one it moved past more quickly, with less participation along the way.
Why Price Can Behave Differently Around HVNs and LVNs
Picture a purely illustrative scenario: price returns to a prior HVN and slows down noticeably, spending time there before continuing. In another scenario, price passes straight through a prior LVN with barely a pause. Neither outcome is guaranteed. Current trend, volatility, liquidity, and new information all factor into how price actually behaves in the moment.
In volume profile trading specifically, these nodes help form a hypothesis about where the market previously accepted price or spent less time, not a forecast with a guaranteed outcome. Treating historical volume profile trading distribution as a promise about future behavior overstates what the data can actually tell you.
Volume Profile Trading: Turning Levels Into Context
Putting a volume profile trading strategy into practice, without turning it into a rigid system, starts with picking a relevant profile range or session. From there, POC, VAH, VAL, and the notable HVNs and LVNs get marked, then weighed against where current price sits and what the broader price structure looks like.
Picture two purely illustrative examples: price reacting near a high-volume area, slowing and reversing somewhat, versus price moving cleanly through a low-volume area with little resistance. Any volume profile trading strategy built around these levels works better as an organizing lens for that kind of price action than as a source of ready-made entry or exit signals.
When Volume Profile Levels Meet Support and Resistance
POC, VAH, VAL, or a volume node can sometimes land close to a support or resistance area already visible on the chart, or near a swing point that already stood out. That overlap, often called confluence, doesn't guarantee a reaction just because multiple things line up in the same place. Treating that overlap as a required checklist before considering a level relevant skips past how differently price can behave from one instance to the next.
Fixed Range Volume Profile: Why the Selected Range Matters
The specific range fed into this kind of calculation shapes the result directly. Session-based, fixed-range, and visible-range approaches each define that window differently, and different boundaries can produce meaningfully different POC, Value Area, and node placements for the exact same chart.
Calculation resolution and the underlying volume data source can shift results further still. None of this points toward one universally correct profile range for every market and every trading style. The range that makes sense depends on what's actually being analyzed.
When Volume Profile Levels Can Mislead You
A handful of real limitations are worth keeping in mind:
Levels depend heavily on the specific range and settings chosen, not a fixed universal calculation
The data itself is historical, reflecting where activity already happened rather than where it's headed
Market conditions can shift enough that older levels stop mattering the way they once did
Price can break through a high-volume area without the reaction some might expect
Behavior around an LVN carries no guaranteed outcome either way
Volume data itself isn't uniform across every source either. A given charting platform might use actual trade volume for stocks while relying on tick volume for certain forex, index, or CFD instruments, so treating all of this data as identical in origin overlooks that difference. Adding price action analysis or another indicator on top doesn't eliminate false signals, either. It just adds another input worth weighing alongside the rest.
Risk Disclaimer: Trading involves significant risk of capital loss. This article is for educational purposes only and does not constitute financial advice. Always conduct independent research and consider your risk tolerance before making any trading decisions.
See more:InterestingTrading Strategies