Leading Indicators in Trading: How They Differ From Lagging Indicators
Leading indicators try to flag a possible shift in momentum or direction before it fully shows up in price, while lagging indicators confirm a move after it's already underway. This guide covers how each type works, common examples like RSI and MACD, and why traders often combine both.

Windshield or rear-view mirror? That's the whole debate. The windshield shows the road ahead, but fog blurs it. The mirror is crystal clear. About the road you already drove. Traders pick between those two views every day, usually without noticing.
What Are Leading Indicators in Trading?
Leading indicators in trading try to flag a shift before price shows it. A change in momentum. A possible reversal. A turn in direction. They work from current and past market data. The aim is to get ahead of the move, not confirm it afterwards.
Here's the catch. Leading doesn't mean accurate. A signal can fire too early. Or turn out false. Think of a smoke alarm that chirps over burnt toast. Useful, until it isn't. One more note on scope. This is about technical tools on a chart. Not macro data like PMI or consumer confidence. Different animal entirely. Traders love these tools for one reason. Nobody wants to be late.
So treat leading indicators in trading as early hints, not promises. Everything below builds on that.
Open a demo account and watch leading and lagging indicators shift on a real chart.
Try Demo AccountEarly hints are easier to judge on a moving chart.
Open a chart on a busy afternoon. Add a momentum oscillator. Watch it turn before price does. Sometimes it's right. Sometimes it's embarrassingly wrong. That's the whole story of leading indicators in trading on one screen. A demo account lets you run the experiment with virtual funds. You can study the false alarms up close. Without paying for any of them.
Give demo trading one afternoon and count how many early signals actually held.
How Leading Indicators Work on a Trading Chart
So what are leading indicators in trading doing under the hood? No formulas needed. Many of them measure momentum. Others track where price sits inside a recent range. Some pick up shifts that tend to appear before the trend visibly changes. You don't get confirmation. You get an early warning. Context, really. A hint, not a verdict.
Not sure where momentum tools live on the platform? The pocket option tutorial shows the way.
That's the trade-off. React earlier and you may catch a momentum shift sooner. But premature and false signals come with the territory. Picture a stochastic oscillator sliding into oversold after a sharp drop. The textbook says a bounce is near. Sometimes it is. Sometimes price just keeps sliding. Ask anyone who bought the first oversold reading in a falling market. Now flip it. RSI hits 70 in a strong rally. The textbook says overbought. Price keeps climbing for weeks. The warning wasn't wrong, exactly. It was just early. Very early.
Common Examples of Leading Indicators
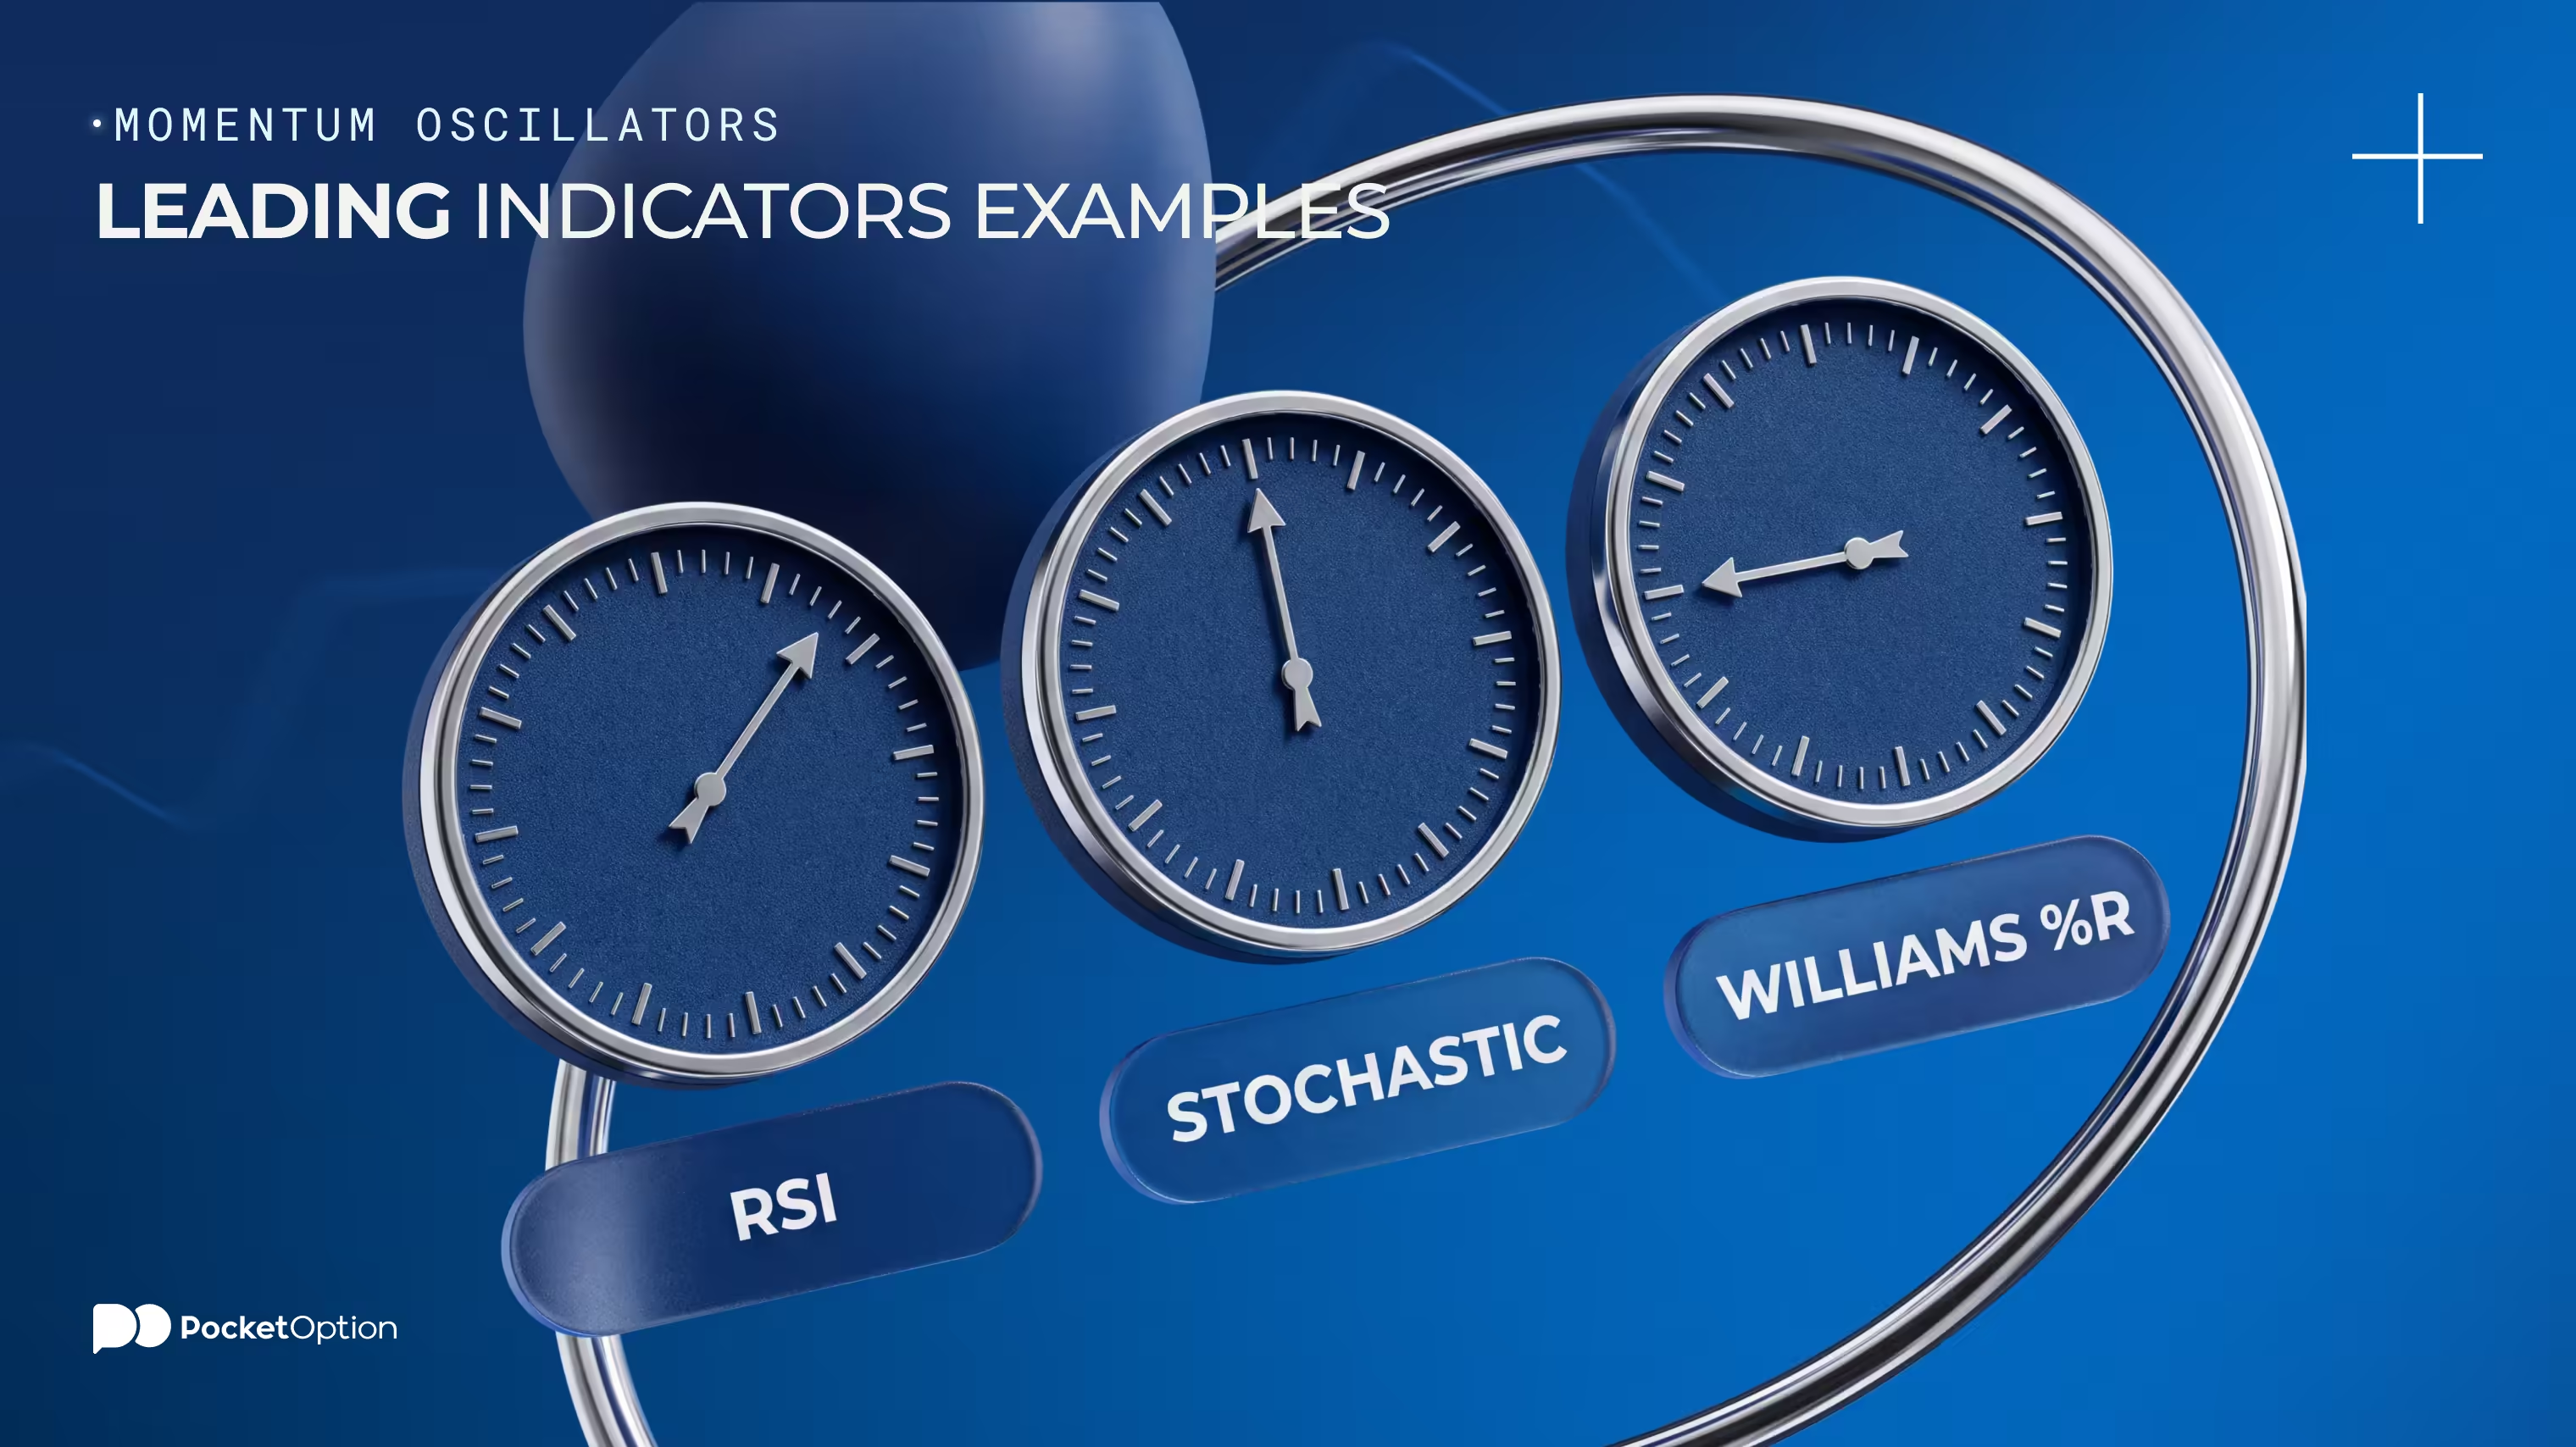
Ask traders what are the leading indicators in trading. Three names come up. RSI. The stochastic oscillator. Williams %R. On-Balance Volume gets a brief nod too, as a volume-based option. Most of them are momentum oscillators. They help gauge overbought and oversold conditions. And possible turning points. The details come right below.
RSI and Stochastic Oscillator
J. Welles Wilder introduced RSI back in 1978. George Lane built the stochastic oscillator earlier still. Both measure momentum. Both help judge weakening momentum, overbought and oversold readings, and possible turning points. Overbought doesn't mean a drop is coming. Oversold doesn't promise a bounce. A strong trend can hold those readings for weeks. RSI usually defaults to 14 periods. That's convention, not law. Neither tool ships with universal settings. Neither hands you an entry signal.
Williams %R and Other Momentum Signals
Williams %R follows the same logic as the stochastic oscillator. Larry Williams built it. Momentum again. The general idea holds across the whole family. Readings can shift before a trend change shows in price structure. That's worth knowing. It's no reason to collect oscillators like trading cards. And no single one times a reversal precisely.
Leading vs Lagging Indicators: What Is the Difference?
Side by side, the practical differences show up fast.
Aspect | Leading Indicators | Lagging Indicators |
|---|---|---|
Primary purpose | Flag a possible shift before it fully shows up | Confirm a move already underway |
Timing of signal | Earlier, sometimes premature | Later, after the move has started |
Typical use | Spotting potential turning points | Confirming trend direction |
Main advantage | Earlier warning | Fewer false signals overall |
Main limitation | Risk of false or premature signals | Confirmation arrives after part of the move |
Examples | RSI, stochastic oscillator, Williams %R | Moving averages, MACD |
One tries to show a shift before it's obvious. The other confirms a trend that's already developing. Calling either one better misses the point. They do different jobs.
How Lagging Indicators Confirm Price Moves
Lagging indicators react later. They're built on price data that already exists. So they confirm a move after it starts. Moving averages and MACD are the usual examples. A moving average smooths past prices. MACD is calculated from moving averages. Gerald Appel created it in the late 1970s. Bollinger Bands belong in the same family. They're built on a moving average too. Think of the rear-view mirror again. Clear picture. Late news. Later doesn't mean more reliable. It's a different trade-off. That's all.
Strengths and Limitations of Leading Indicators
Start with the good news. Earlier warning. A better shot at catching a momentum change before it's obvious. Real use in ranges and around turning points. Ranges are where these tools earn their keep. Price bounces between two levels. Oscillators flag the turns. Trends are where they struggle.
Now the catch. False signals happen. Premature ones too. Overbought and oversold readings can persist through strong trends. Sharp volatility muddies everything. Different timeframes give conflicting signals. And broader market context beats any single oscillator reading.
Picture an indicator flagging weakening momentum while price keeps charging ahead. It happens constantly. An early signal never guarantees a better entry. It's one more piece of the picture. Nobody gets every signal right. The goal is knowing which kind of mistake you're signing up for.
Why Traders May Combine Leading and Lagging Indicators
Combining them is about roles. Not a ready-made strategy. One flags a possible shift early. The other, or price action itself, confirms a move that's already underway. Say you pair RSI with a moving average. RSI hints at a turn. The average says the trend still points up. Two voices, two stories. Now you have a decision to make, not a signal to follow. Before you combine anything, run a quick check:
What function each indicator actually serves
Whether the tools duplicate the same signal
Which timeframe is being used
Whether the signal fits the broader market trend
Whether price action offers any confirmation
Stacking indicators doesn't remove false signals. It can create contradictory readings. Or pile on more analysis than helps. More lines on the chart rarely means more clarity. Simple beats crowded.
Risk Disclaimer: Trading involves significant risk of capital loss. This article is for educational purposes only and does not constitute financial advice. Always conduct independent research and consider your risk tolerance before making any trading decisions.
See more:Education