PCE vs CPI: What's the Difference and Why Does the Fed Prefer PCE?
PCE and CPI both track US consumer inflation, but differ in coverage, weighting, and data sources. This guide covers what each index measures, why their values can diverge, and why the Fed relies on PCE for its long-run inflation goal.

PCE vs CPI: What Do They Actually Measure?
Two thermometers hanging in the exact same room can still show slightly different readings, depending on where each one sits and what it's actually calibrated to pick up. That's roughly the relationship behind pce vs cpi. Both track how prices for consumers are moving in the US economy. Neither one is measuring something entirely different from the other.
What separates them comes down to spending coverage, the weights each one assigns to different categories, where the underlying data actually comes from, and the specific formula used to calculate the final number. The Bureau of Economic Analysis calculates PCE. The Bureau of Labor Statistics calculates CPI.
Both agencies are measuring the same broad phenomenon, US consumer prices, using different source data and different construction choices. That's often enough on its own to produce two headline numbers that move in the same general direction but land on somewhat different specific figures in any given month.
Getting a handle on pce vs cpi at this level is really just groundwork. The specific differences that make their values diverge get covered section by section from here.
Open a free demo account and follow economic releases on a live calendar.
Try Demo AccountWatching how each index actually gets built beats memorizing the difference. Seeing a live economic calendar in action beats reading definitions cold.
A demo trading account lets you track these releases on a live calendar without risking capital.
What Is the PCE Price Index?
PCE stands for Personal Consumption Expenditures Price Index, and it tracks price changes across the goods and services that make up personal consumption expenditures specifically.
Answering what is PCE in practical terms means recognizing its coverage runs wider than a typical household budget. It captures spending consumers pay for directly, plus certain spending made on their behalf by employers or government programs. Healthcare offers a clear example: someone's employer-sponsored insurance premium gets captured here, even though the employee never personally writes that specific check.
The weights behind what is PCE also move alongside actual shifts in consumer spending patterns, rather than staying locked to one fixed basket.
Checking a live pocket option tutorial shows exactly where these data releases show up on an actual trading calendar.
What Is Core PCE Inflation?
Core PCE strips food and energy out of the broader pce price index specifically to track underlying inflation trends without the noise those two volatile categories tend to add. One thing worth being precise about: the Fed's official long-run 2% inflation goal applies to total, headline PCE, not the core measure specifically.
What Is CPI?
Consumer Price Index tracks price changes for goods and services that urban consumers actually purchase out of pocket. Expenditure weights here get built from the Consumer Expenditure Survey specifically.
CPI doesn't run on some permanently fixed basket, either. The CPI-U and CPI-W weights themselves get updated annually, even if the update cycle differs from how PCE incorporates spending shifts. Compared to what is PCE inflation actually capturing, CPI leans more heavily toward direct household out-of-pocket spending specifically.
PCE vs CPI: The Key Differences at a Glance
Laid out side by side, the specific differences get a lot clearer.
Aspect | PCE | CPI |
|---|---|---|
Publisher | Bureau of Economic Analysis (BEA) | Bureau of Labor Statistics (BLS) |
Spending coverage | Consumer spending plus certain third-party spending | Primarily direct household out-of-pocket spending |
Data / weights source | National accounts data, broader source set | Consumer Expenditure Survey |
Weighting method | Chain-type Fisher-Ideal formula | Modified Laspeyres formula |
Response to changing spending patterns | Adjusts relatively quickly | Updates on an annual cycle |
The BEA itself groups the reasons these two indexes diverge into a handful of categories: formula effect, weight effect, scope effect, and a catch-all for other effects. Neither index counts as objectively better or more correct here. They're built to answer somewhat different questions.
Who and What Each Index Covers
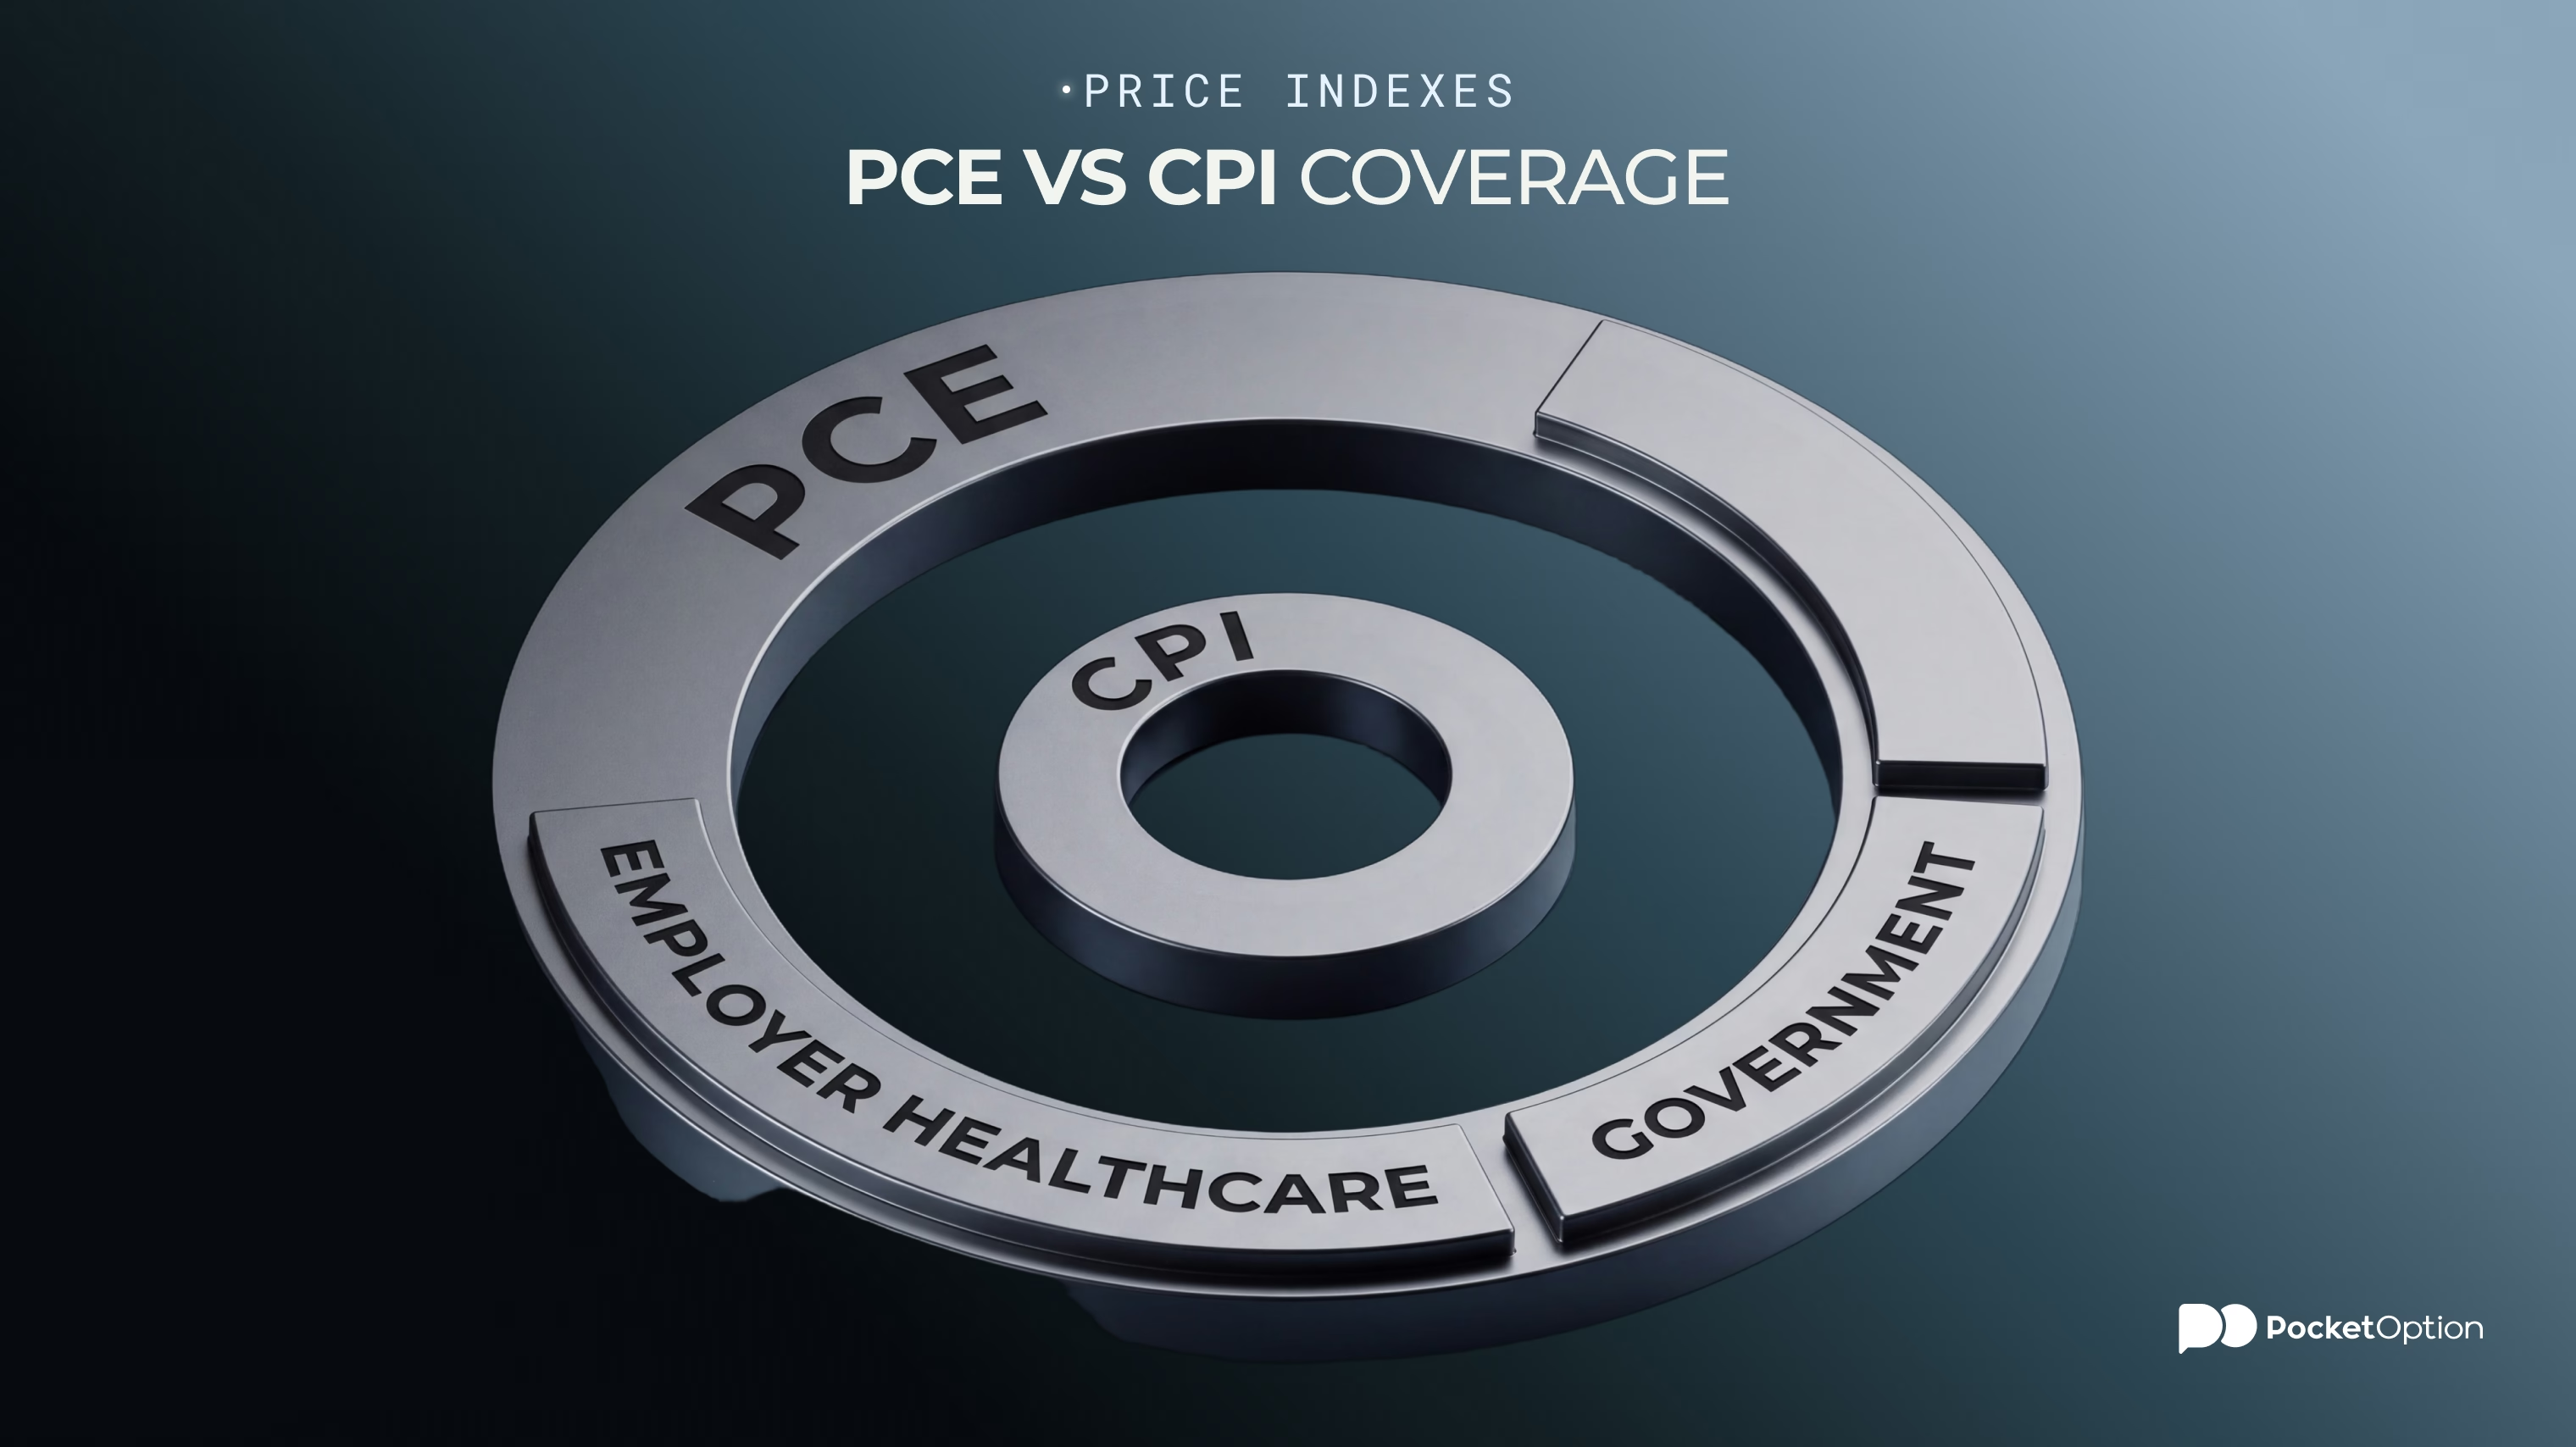
PCE covers spending by consumers and spending made on behalf of consumers. CPI leans more heavily toward out-of-pocket household spending specifically. Healthcare again makes a useful example: employer and government contributions toward medical costs show up differently across the two measures, which is part of why one category's relative weight can look meaningfully different between them.
Housing costs offer another area where the two indexes can diverge, since each one handles owner-occupied housing and rental equivalence calculations through its own specific methodology. Neither approach is inherently flawed. They're simply built around different definitions of what counts as consumer spending in the first place.
How the Weights React to Consumer Behavior
PCE's chain-type Fisher-Ideal approach reflects shifts in spending patterns faster than CPI's annually updated weights do. A simple example: if one product gets noticeably more expensive and consumers start buying an alternative instead, that substitution shows up somewhat differently across the two calculations. CPI isn't blind to substitution entirely, it just incorporates those shifts on a different cycle.
Where the Data and Formulas Differ
CPI's expenditure weights lean on the Consumer Expenditure Survey specifically. PCE sits inside the broader national accounts framework BEA maintains, drawing from a wider set of underlying sources. PCE uses a chain-type Fisher-Ideal formula. CPI uses a modified Laspeyres formula. These methodology differences connect directly to why the two indexes can report somewhat different inflation rates even when covering overlapping ground.
Why Does the Federal Reserve Prefer PCE?
This is really the core reason the topic matters at all. The Fed leans on PCE specifically because of its broader coverage and its ability to reflect shifting consumer spending patterns more responsively. That responsiveness matters to a central bank trying to gauge underlying price pressure across the whole economy, not just what a typical household happens to buy directly out of pocket.
The FOMC's long-run 2% inflation goal gets expressed through this particular measure specifically for this reason. That said, the Fed doesn't ignore CPI or other inflation data either, it factors those in too, alongside labor market data, growth figures, and a range of other economic indicators. A PCE reading landing above or below 2% doesn't automatically translate into some specific rate decision on its own.
How Traders Should Read PCE and CPI Data
Neither release amounts to a trading strategy on its own, but both carry genuine practical value. CPI offers a read on consumer inflation broadly. PCE carries particular weight specifically because of how directly the Fed references it. A short checklist helps before interpreting either release:
Headline versus core figures
Month-over-month versus year-over-year comparisons
The actual reading against market expectations
The previous value and whether it got revised
Broader Fed commentary and macro context surrounding the release
A single release doesn't guarantee any particular direction for USD, stocks, or other assets. Market reaction can end up looking quite different from what seemed like the obvious expectation going in.
Risk Disclaimer: Trading involves significant risk of capital loss. This article is for educational purposes only and does not constitute financial advice. Always conduct independent research and consider your risk tolerance before making any trading decisions.
See more:Education