What Is the Asset Turnover Ratio? Formula, Calculation and Interpretation
How much selling can a company get, out of the stuff that it owns? This is the question people ask when they determine the asset turnover ratio. On the surface, it’s a single line of arithmetic, but in reality, it can easily determine the direction of an investment or a trade.

What Is the Asset Turnover Ratio: Definition
Asset turnover holds the value of a year of sales of a business, up next to what the company actually owns (during that same year). And compares the two. Result of 2 means that there are two dollars of sales, for every dollar of assets that sits on the books. Sales are quite decent, or assets are relatively small. If we see a result of 0.4, it means the asset base is rather heavy, and the current selling is not keeping up with it. Here, asset turnover can be said to be low, although this heavily depends on the type of the business, of course. The asset turnover formula is short enough to run in your head, if you have the two inputs required.
One thing to remember is that it’s an efficiency measure and not a profit one. A company might be struggling, but have a very high asset turnover rate. A company can post a high asset turnover ratio, but still lose money on every sale, because the sum doesn’t looks at costs. All it looks at is how much revenue the asset base managed to produce.
Why the Formula Uses Average Total Assets, Not Ending Assets
Revenue slowly piles up across twelve months. Total assets, on the other hand, is not a flow, but a snapshot. One line of a singular moment on a balance sheet. It is taken on the very last day of the period, and it might not represent the entirety of what’s happening under the hood.
This is why people use average total assets, and it patches this mismatch, roughly. Opening balance plus closing balance, split by two, to determine how much assets the company had. Crude, possibly not ideal, but at least it drags the denominator into the same period the revenue came from, which is the point.
This, of course, matters most when a company changed size partway through. If a firm bought a factory in November, and that company hasn’t really produced any assets worth selling yet, then using just a closing balance sheet would drag the asset turnover ratio down without a big reason for it. A company is investing into its future, but some people might think it’s actually doing badly, on paper, because of this purchase. Using average assets over the whole period avoids this problem.
Total Asset Turnover Ratio Formula
Here is the total asset turnover ratio formula, in its simplest version:
Total asset turnover = Net sales ÷ Average total assets
In this case, Average total assets = (Beginning total assets + Ending total assets) ÷ 2
Net sales just means revenue (after returns, allowances, and discounts have come off). The top line in the income statement, basically. Meanwhile, bottom half comes off the balance sheet, both ends of it. It’s crucial to use the same period on both sides, or the total asset turnover formula will hand you a number that means next to nothing, and just muddies the picture.
You will also sometimes see this called the net asset turnover ratio, and here it can get a bit confusing, as the name doesn’t always point at the same sum. Most of the time it is identical to the formula above, and the word ‘net’ only refers to net sales. But some analysts use a net asset turnover ratio formula where the bottom half is net assets instead, meaning total assets minus liabilities, and that gives a different number. So when comparing two companies, it’s worth checking which denominator is being used in each case.
Test ideas with virtual funds.
Try Free DemoFixed Asset Turnover Ratio Formula
The fixed variant slightly narrows the bottom of the sum. It includes just the property, plant and equipment used in this period, net of depreciation. So the formula becomes:
Fixed asset turnover = Net sales ÷ Average net fixed assets
Why keep this formula around? Because ‘total assets’ means cash, receivables and inventory. So if a company just sat on a big pile of cash, and you think it’s not that useful to use, a fixed version might be cleaner. It strips non-productive assets back, so you get a narrower, more direct and concrete answer: how much selling is the machinery itself producing?
The trade-off with this formula is that working capital is not counted in, and of course for some businesses that is exactly where the money is tied up. That’s how it is with retailers, for instance. Inventory is the asset that does the work there, and fixed asset turnover will barely register it.
Step-by-Step Calculation Example
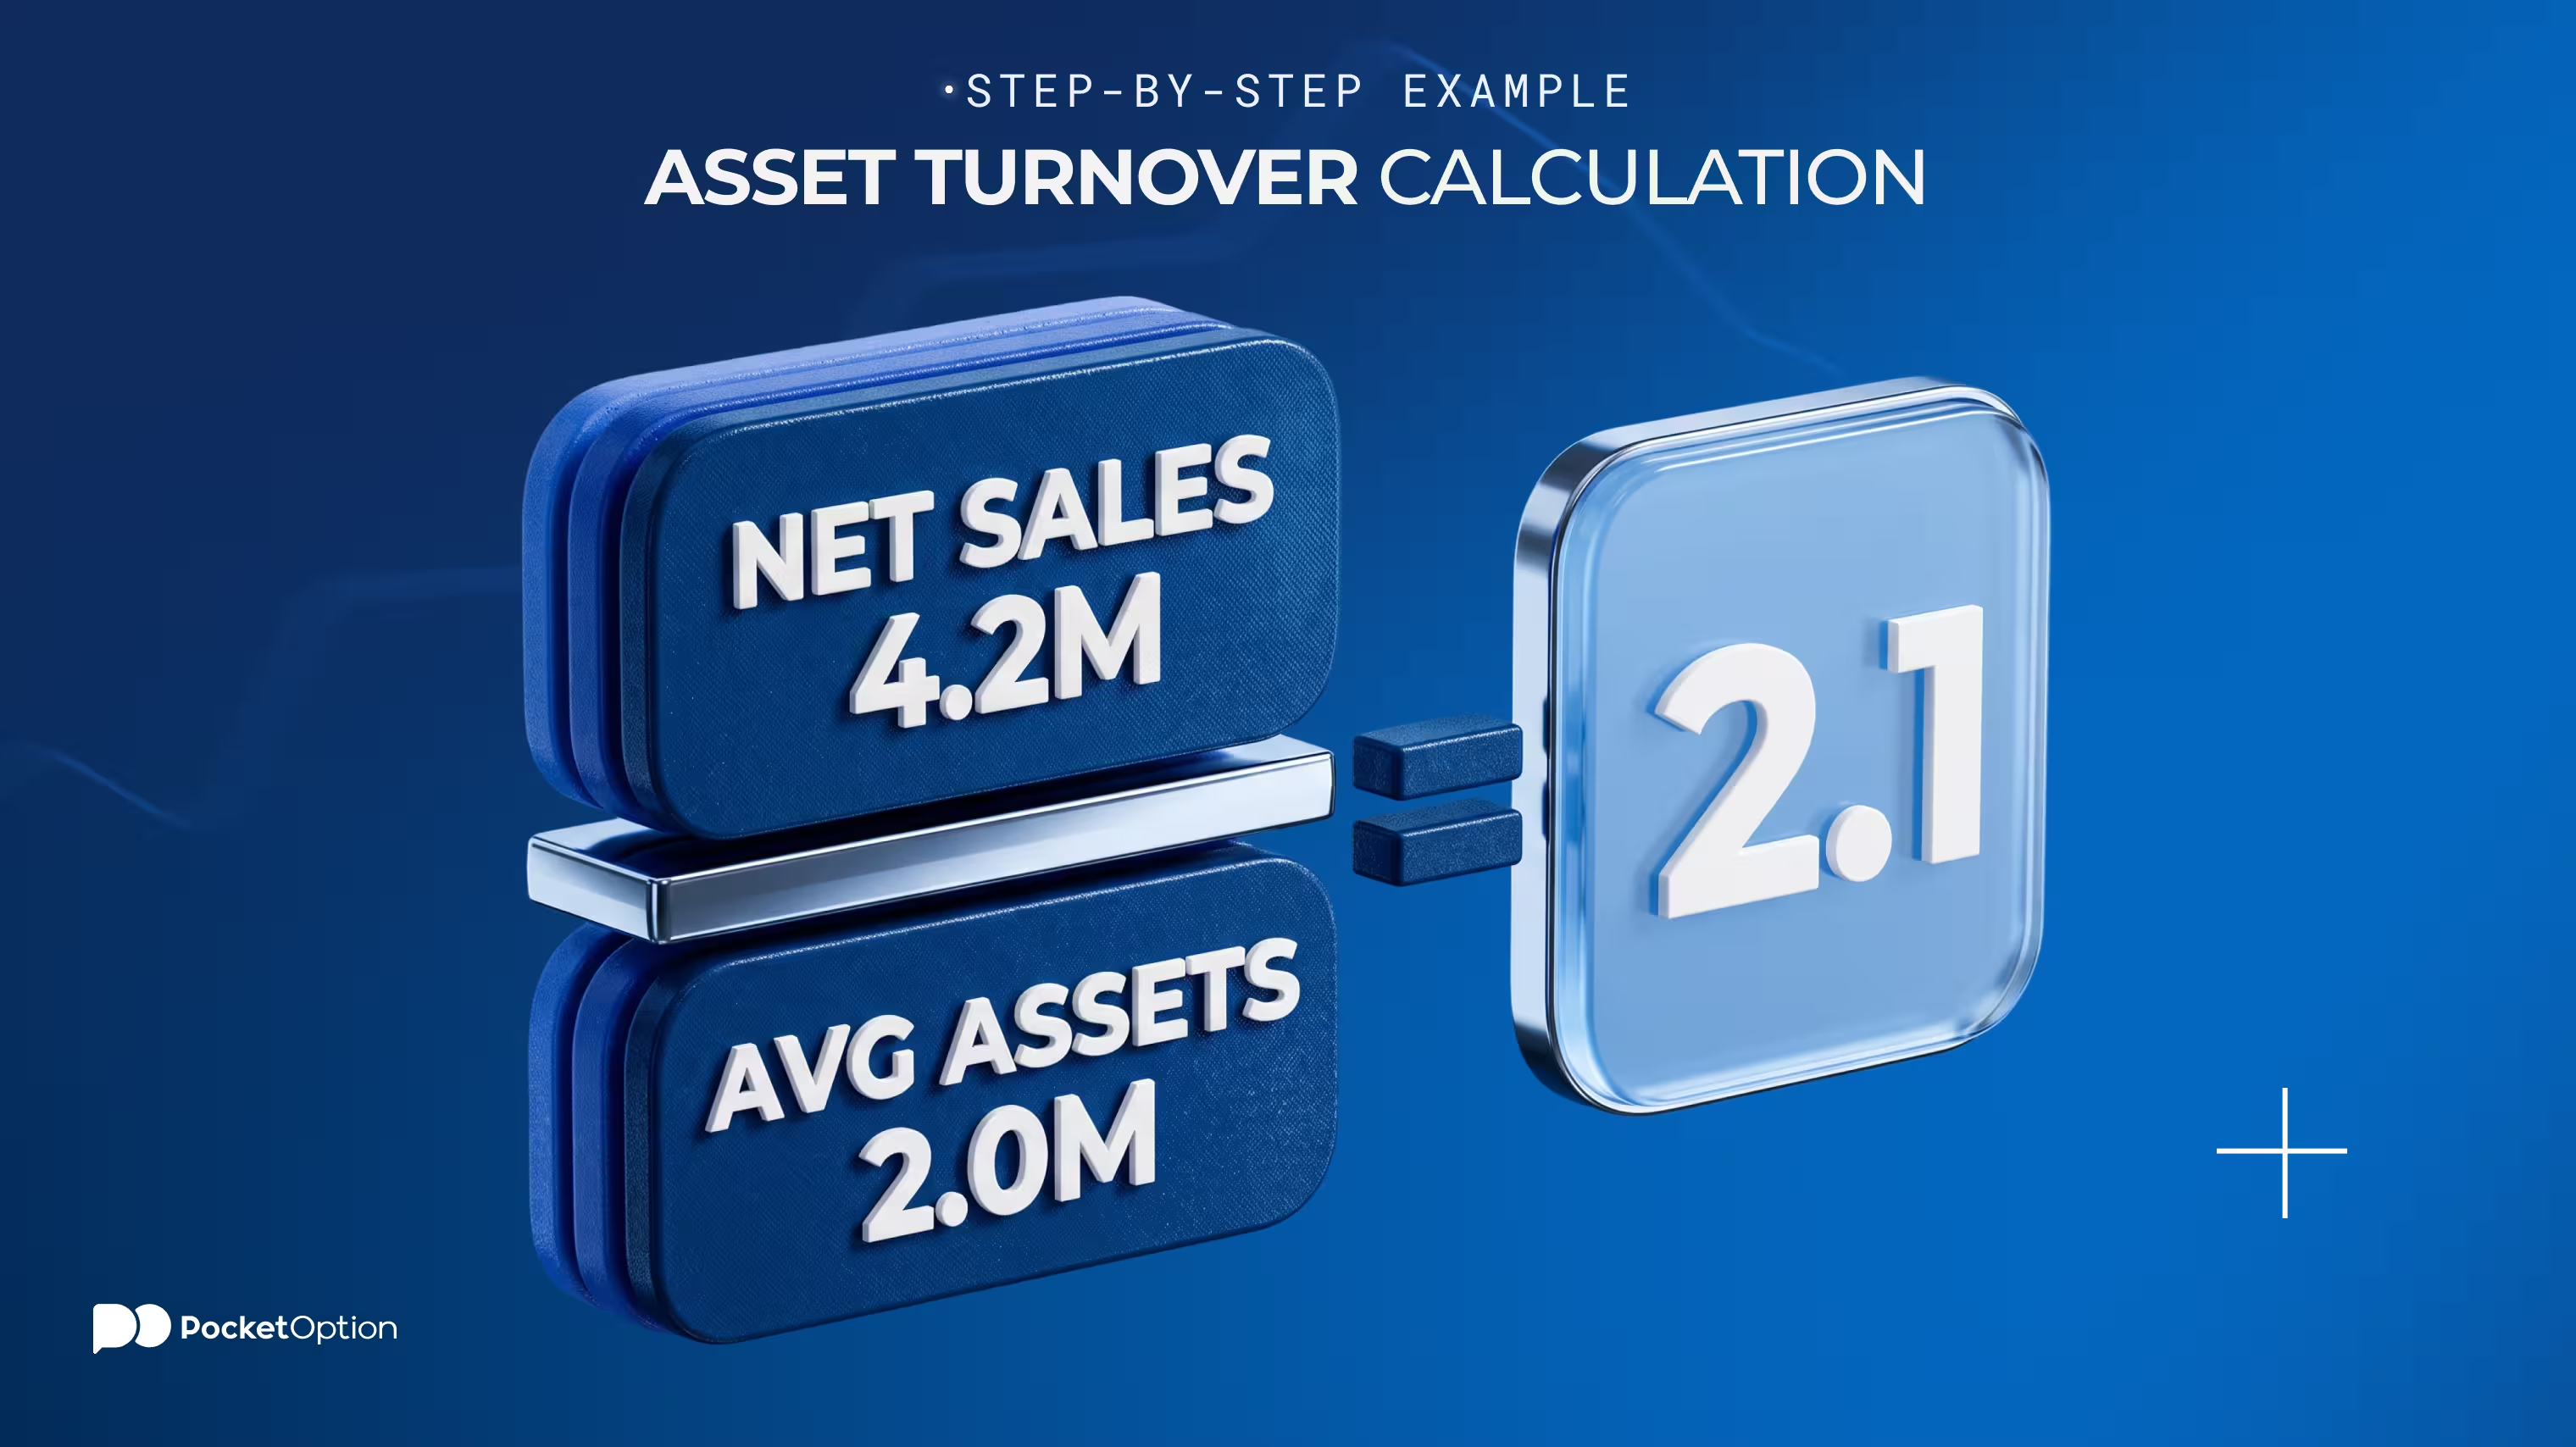
Let’s take a manufacturer as an example. At December year end, they had:
Net sales for this particular year: $4,200,000.
Total assets at the start of the year: $1,800,000. At the close: $2,200,000.
Average total assets, therefore, will be (1,800,000 + 2,200,000) ÷ 2 = $2,000,000.
Asset turnover here is 4,200,000 ÷ 2,000,000 = 2.1.
Now for the fixed version, which needs net property, plant and equipment: $900,000 opening and $1,100,000 closing, so $1,000,000 average.
Fixed asset turnover: 4,200,000 ÷ 1,000,000 = 4.2.
So for every dollar of assets, a company managed to produce $2.10 in sales across this year. Meanwhile, every dollar of plant and equipment made them $4.20. With these numbers in hand, investors can plan their next move, and the company might decide, whether it’s worth buying extra equipment, and whether the one they have is good enough with its output.
What Is a Good Asset Turnover Ratio
There is no single number, of course. The answer to what is a good asset turnover ratio is: it depends. On the other companies working in the same sector, mainly. A grocery chain that’s running 2.5 is somewhat unremarkable. But a power utility running 2.5 would be extraordinary, and very impressive. That is because asset bases, customers, and revenue sources of those two companies have next to nothing in common.
So for understanding if the ratio is good, it’s worth taking the same industry, same period, and ideally even the same accounting standards. Then the comparison and the number will make sense, put into perspective.
How to Interpret the Ratio by Industry
Asset-heavy vs asset-light is the split. The more assets are required in the industry, the less the ratio will be, on average. This walkthrough of what a stock actually is can set the base. Some rough numbers for asset turnover ratio are:
Sector | Usual shape of the ratio | What drives it |
|---|---|---|
Grocery, retail | High, can be over 2 | Thin margins, high stock turnover |
Software and services | 1-2 | Small physical kit |
Manufacturing | Around 1, often | Plant and machinery in the denominator drag the ratio down |
Utilities, telecoms, heavy infrastructure | Lower, often under 0.5 | Huge fixed asset base, and slow to turn |
Banks and insurers | Very low, rarely used for them | Assets are loans and securities, so the sum measures something else |
What Causes a High or Low Asset Turnover Ratio
Movement in this number comes from either half of the sum, and it pays to know which half has moved, before jumping to conclusions. What could’ve happened is:
Heavy capital spending. I.e., a new plant suddenly drops into the denominator, and the sales are not caught up to it yet. Ratio dips, recovery will (hopefully) happen over the next period.
Selling/writing down assets. Denominator shrinks, ratio jumps. But the business itself has not improved, despite what a metric might suggest.
Outsourcing or leasing happens. Production is moved to a contractor, and so the assets required for that leave the balance sheet of the company, and move to theirs. Ratio looks better, but in reality it might not be great for the company, as costs of acquiring new products may rise up.
Falling demand. Sales and revenue slide, meanwhile assets stay where they were. Ratio slips. This is often the most troubling outcome.
Limitations of the Asset Turnover Ratio
The ratio has a short memory, and no sense of quality. If a company is running on old equipment that will soon break down, it doesn’t say anything about it. Buying new one might only drag the ratio down, despite it objectively improving the business. In the same way, a one-off asset sale in December flatters the following year's figure, and makes it look better, despite nothing about the business being changed.
Remember that two companies with identical factories can report different net asset values purely because one writes the building off over 10 years and the other over 25. The one carrying older, more depreciated assets actually shows the higher asset turnover. Whereas in reality, of course, it’s not more efficient, successful, or healthy.
So relying on just this asset turnover number is not optimal. It’s just a useful metric to check across a myriad of other ones, and not much more. For proper investing or trading, you need to do a wider fundamental analysis approach, and there’s no one magic ratio that tells it all.
Comparing Companies Using This Ratio
Comparison is often called a thief of joy. But in investing, this is exactly where metrics are often most useful. Line up three-four names from the same sector, during the same period, and see how they compare.
Then look at direction over 3-5 years (instead of just one year), and see what happens to a company. If it’s drifting from 1.8 down to 1.1, while its peers are flat or rising, this might be a red flag for investing (unless you figure out they were doing something very specific). But overall the direction beats a level here, quite often. If a direction is positive, it might say a lot.
Of course, this is still limited, and does not touch market risk, for example. The ratio describes what goes on inside a company. But share prices move on vibes, rates, sentiment, flows, news, etc. So a business can improve its total asset turnover every year, but the stock might still go down over the same period (although this is less likely, on average). Read the explanation of how the stock market works about how to spot gaps between company performance and its market valuation.
Conclusion
The total asset turnover ratio is a useful metric to use in conjunction with others, to determine if a long-term trade or an investment is acceptable, and to see the overall health of the business. It should not be relied on solely, however, as it only holds sales up against assets, and says nothing about costs, profit, or how good the assets behind the number actually are.
Disclaimer: This article is for informational purpose only, it does not constitute financial advice. Trading involves risks of capital loss, and therefore may not be suitable for all investors.
See more:Education