How Do You Read Momentum Signals With the Ultimate Oscillator?
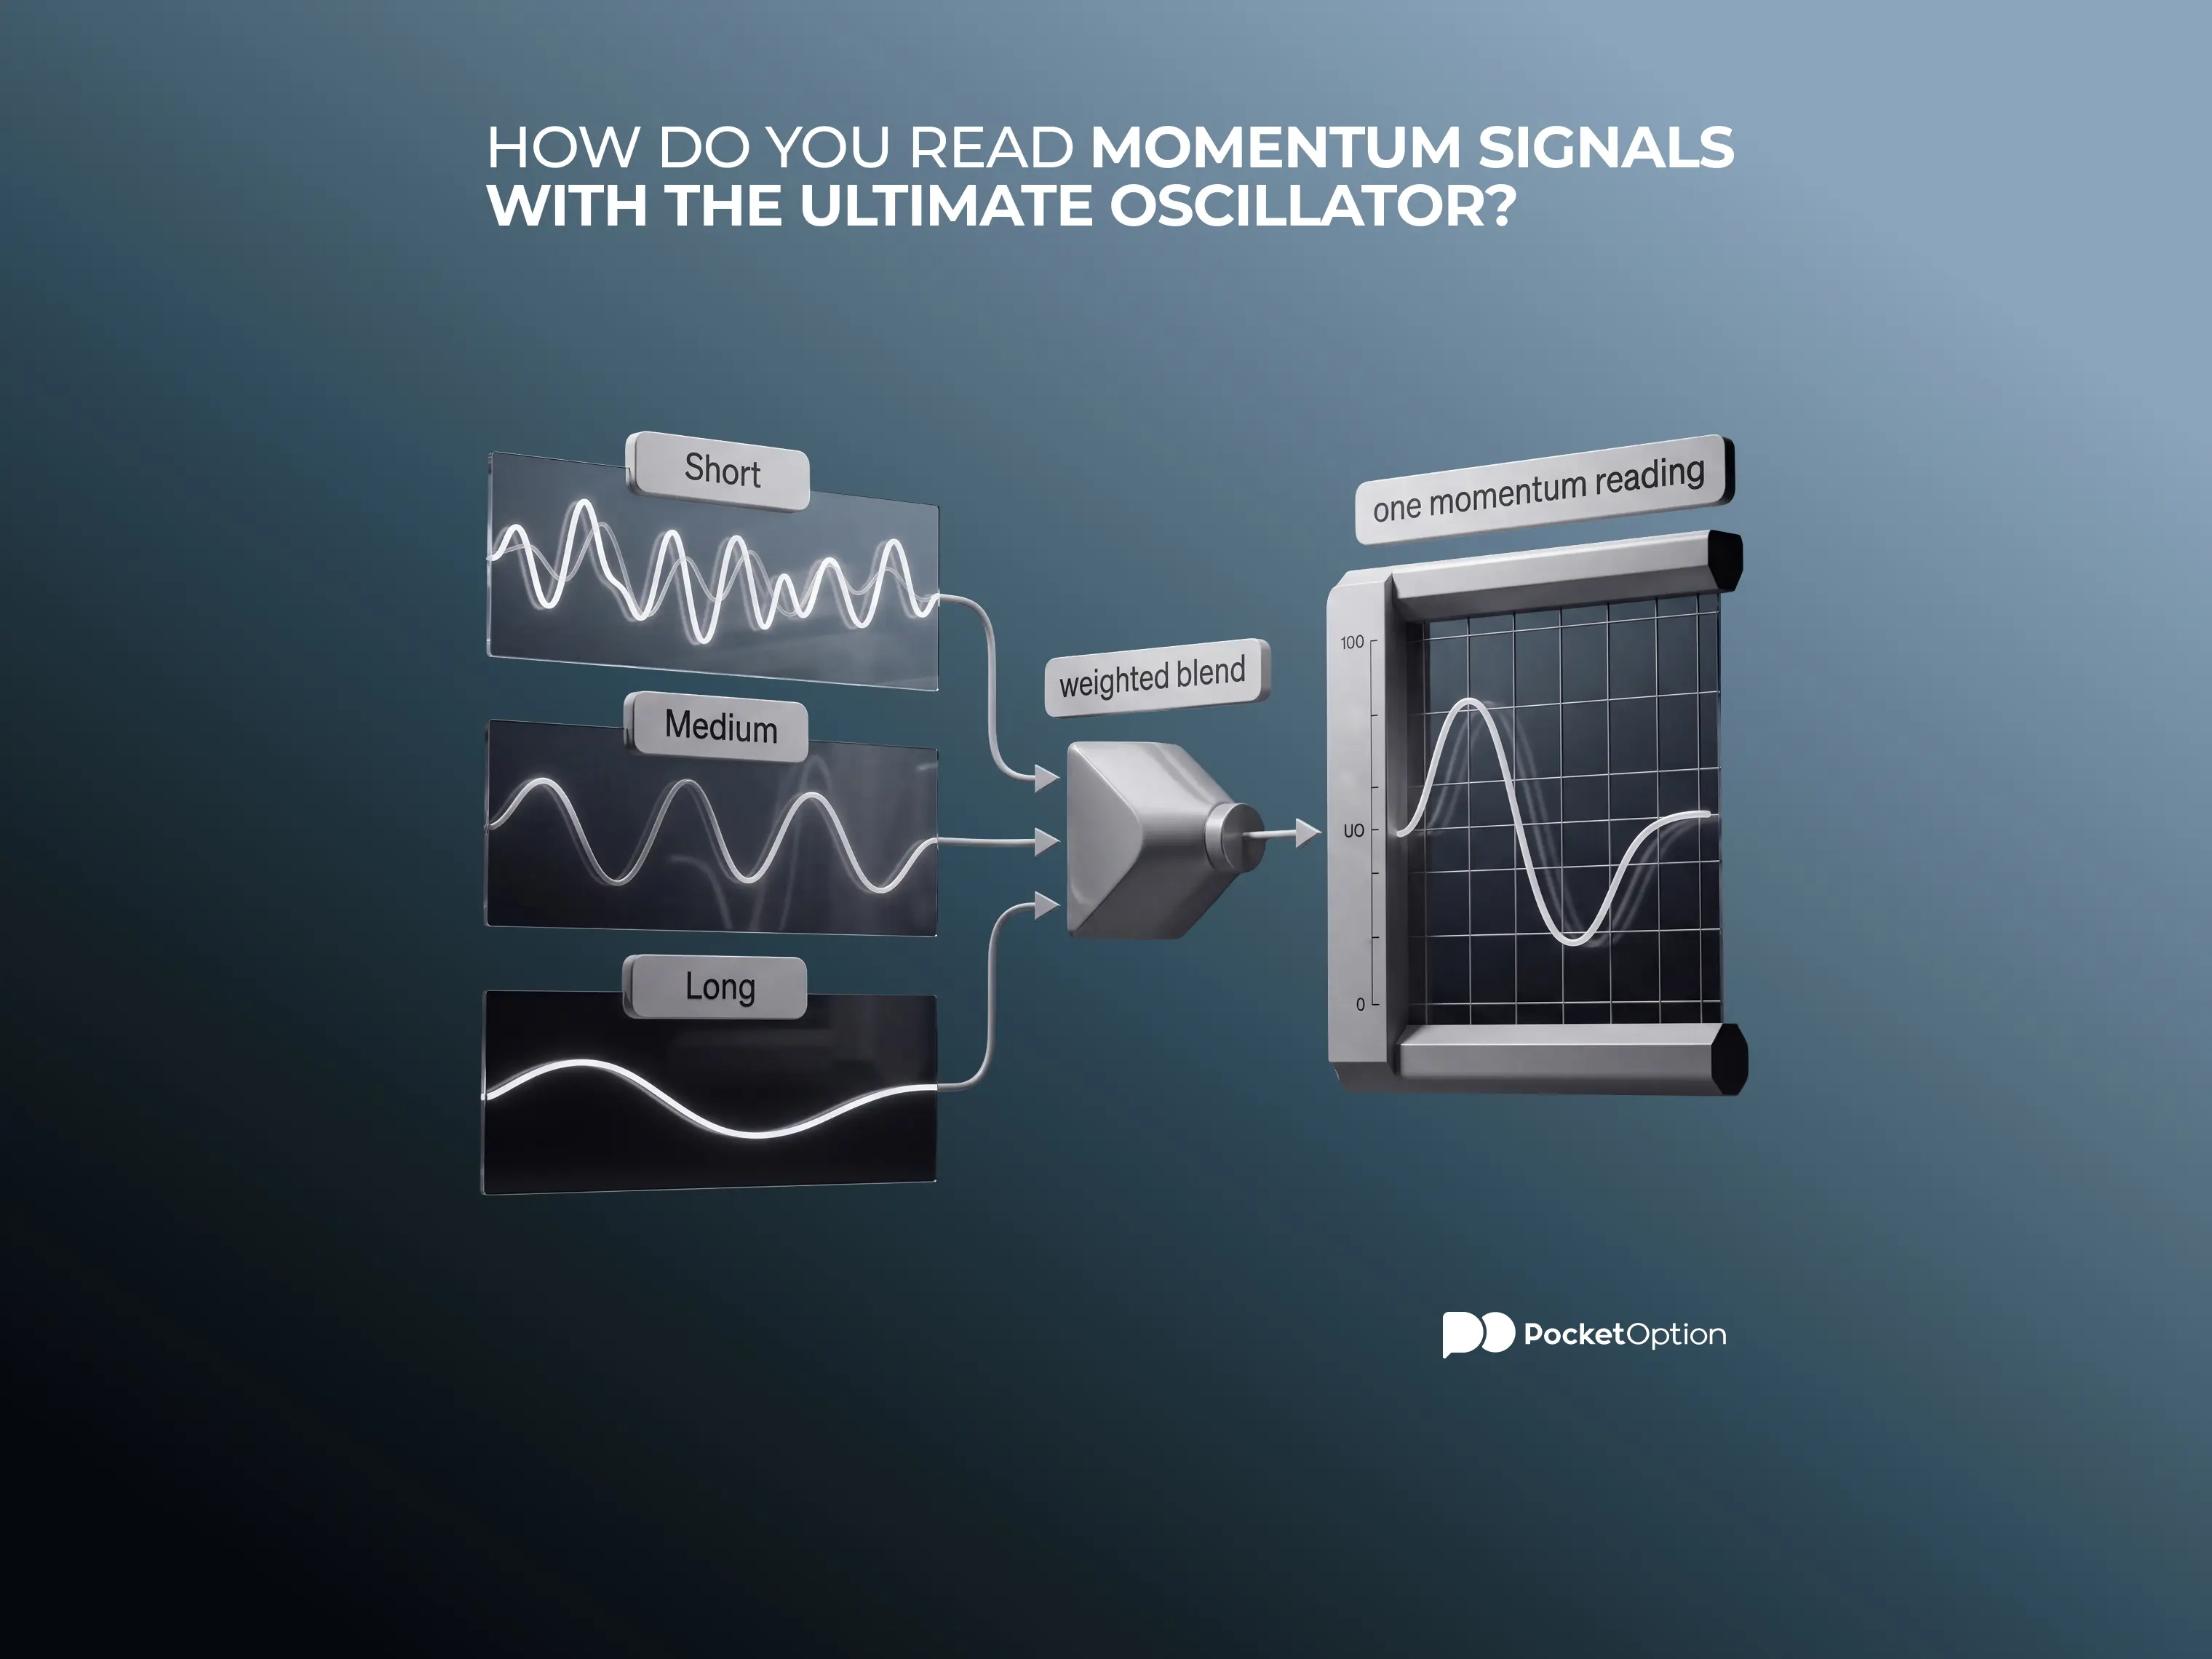
The Ultimate Oscillator blends buying pressure across three time periods into one momentum reading. This guide covers the formula, the 30 and 70 reference levels, divergence, and its limits.

Ultimate Oscillator: Why It Uses Three Time Periods
A course grade rarely comes from just the final exam. A midterm and early quizzes get folded in too, though the final one usually counts for more, since it's the freshest read on where you actually stand right now. The Ultimate Oscillator uses a similar idea with momentum, just across three different time windows instead of three tests.
The Ultimate Oscillator measures buying pressure across a short, a medium, and a longer period at once, rather than relying on just one lookback window. The shorter period carries the most weight in the final reading. The medium and longer periods still factor in, adding broader context the short period alone can't capture.
None of this eliminates false signals entirely. Blending three periods together just means the Ultimate Oscillator reacts to more than a single narrow window of price action, which changes what kind of signals show up, not whether every signal turns out accurate.
Seeing the Ultimate Oscillator actually respond to live price across these three windows tends to make the mechanics click faster than reading about them in the abstract.
Open a free demo account and watch how these three periods blend together, using virtual funds.
Try Demo AccountReading about three-period blending only goes so far. Watching how the short, medium, and long readings actually combine on a live chart shows the mechanics faster than any explanation can.
Open a demo trading account and watch how these three periods blend together in real time, with virtual funds and nothing real on the line.
Ultimate Oscillator Formula: From Buying Pressure to UO
Buying Pressure starts the calculation: closing price minus whichever is lower, the current low or the previous close. True Range follows a similar comparison: whichever is higher between the current high and the previous close, minus whichever is lower between the current low and the previous close.
From there, three separate averages get calculated, one for each period: Average7, Average14, and Average28. Each one divides the sum of Buying Pressure by the sum of True Range across its own specific window. The general shape of the ultimate oscillator indicator formula pulls all three together: 100 times the sum of 4 times Average7, plus 2 times Average14, plus Average28, divided by 7.
Step | Component | What It Represents |
|---|---|---|
Buying Pressure | Close minus the lower of current low or previous close | How much buying pressure showed up that period |
True Range | The full high-low range, accounting for gaps | The total price movement available that period |
Average7 / Average14 / Average28 | Summed Buying Pressure divided by summed True Range, per period | Buying pressure ratio for each specific window |
Final UO value | Weighted combination of the three averages | The oscillator reading itself |
None of this requires working through the math by hand on every candle. What matters for reading an ultimate oscillator indicator is understanding what each piece actually represents.
Checking how these three averages actually build out on your own charts through your Pocket Option login account tends to make the mechanics click faster than reading through the formula alone.
Why the 7, 14, and 28 Periods Carry Different Weight
The classic setup for the ultimate oscillator formula uses 7, 14, and 28 periods, weighted 4, 2, and 1 respectively. That weighting means the shortest period pulls the final reading harder than the other two combined pull it in the opposite direction.
None of these numbers get crowned the single correct setting for every asset or timeframe. They show up often as a starting reference, not as a fixed rule every ultimate oscillator formula has to follow regardless of what's actually being traded.
How to Read 30 and 70 Without Treating Them as Buy and Sell Lines
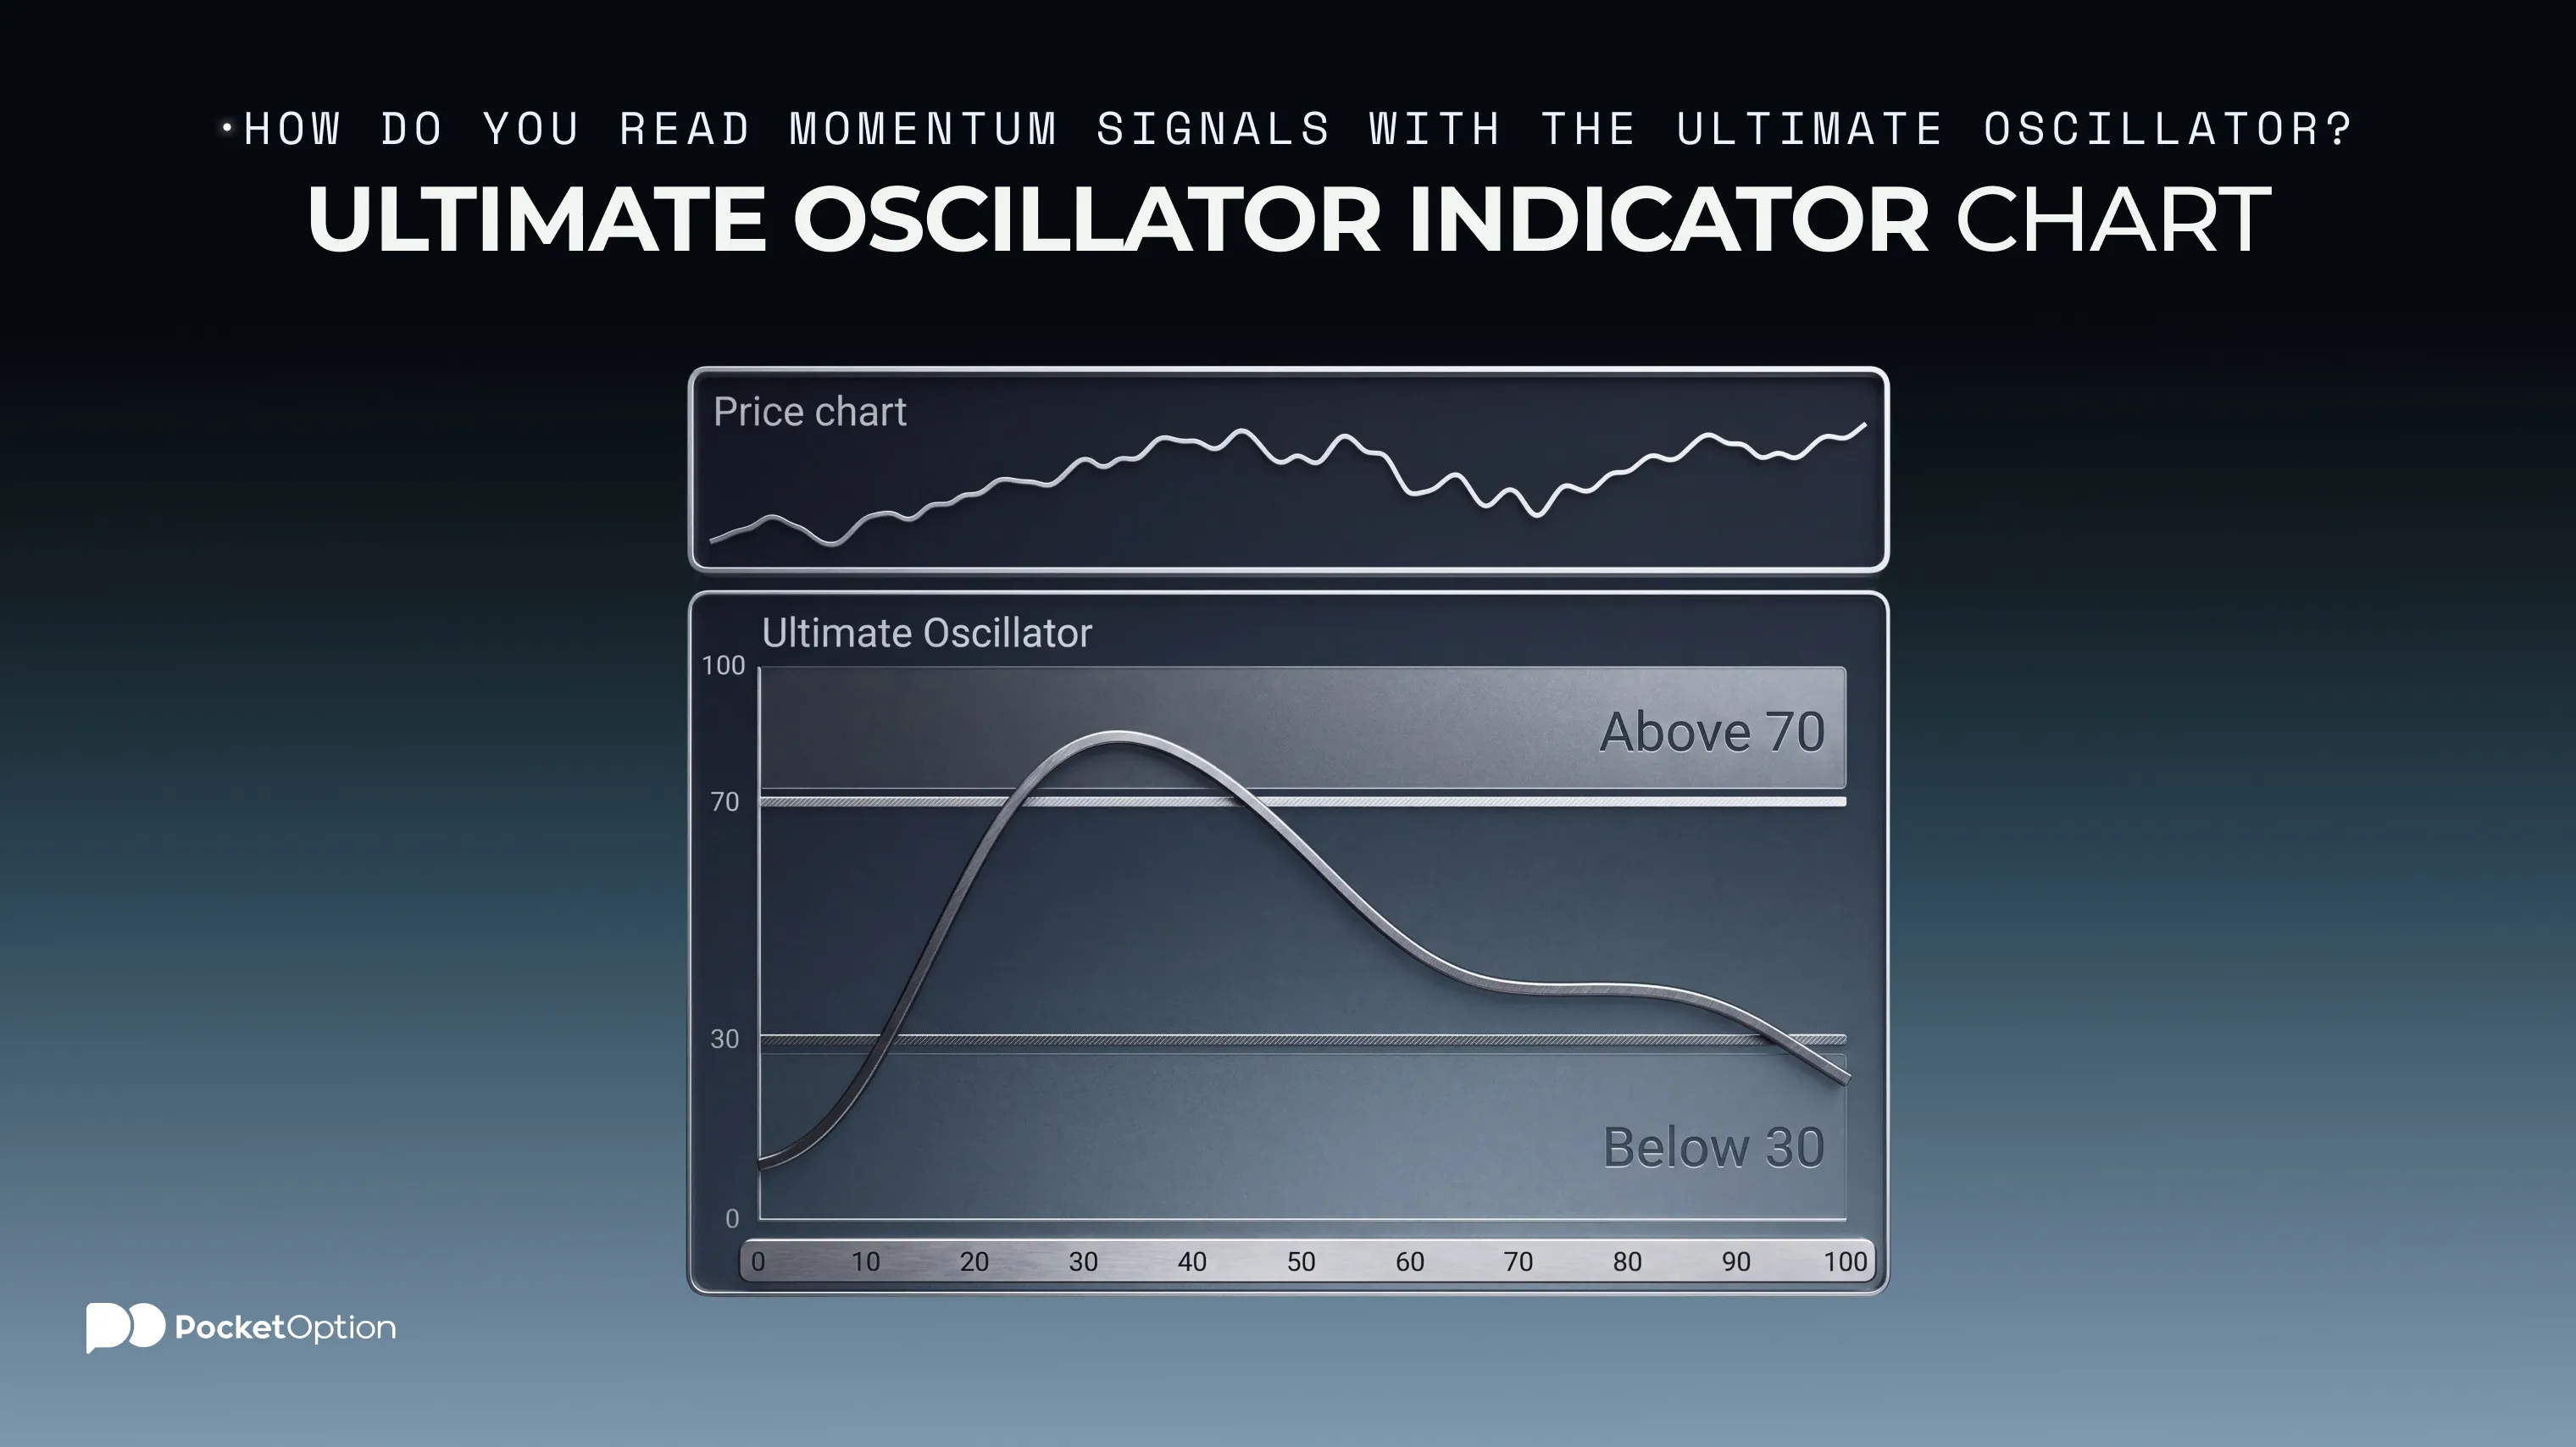
30 and 70 function as reference levels in the classical interpretation, marking readings that sit unusually low or unusually high relative to where the oscillator typically sits. Some setups within a broader ultimate oscillator strategy use these levels as part of a larger condition, not as a rule on their own.
Reaching 30 or 70, by itself, doesn't mean a reversal is imminent. How often a reading actually touches these levels can vary meaningfully depending on the specific instrument's volatility and behavior, so treating below-30 as an automatic buy and above-70 as an automatic sell skips past that variability entirely.
Ultimate Oscillator Strategy: Divergence Needs Confirmation
The classical logic behind reading UO signals centers on bullish or bearish divergence, followed by confirmation from the oscillator itself. Divergence here reflects a shift in momentum context, not a precise forecast of exactly when a reversal happens. Treating the classical conditions as guaranteed entry rules overstates what any single divergence pattern actually shows.
Bullish UO Signal: When Price Makes a Lower Low but Momentum Does Not
The classical bullish sequence unfolds in stages: price prints a lower low while UO prints a higher low, the low point of that divergence sits below 30, and UO then climbs above the local high formed between the two divergence lows. Each stage adds a piece of context. Meeting every condition still doesn't amount to a guaranteed buy signal on its own.
Bearish UO Signal: When Price Makes a Higher High but Momentum Weakens
The reverse classical sequence works the same way in the other direction: price prints a higher high while UO prints a lower high, the high point of that divergence sits above 70, and UO then drops below the local low formed between the two divergence highs. That pattern reflects weakening momentum. It doesn't guarantee a downtrend is starting.
Check Price Structure Before Treating Divergence as a Setup
Current trend, a sequence of higher highs and higher lows or lower highs and lower lows, and nearby support or resistance areas all add context to a UO divergence reading. Picture two purely illustrative scenarios: the same divergence pattern forming inside a clearly established trend, versus that identical pattern showing up in a choppy, directionless market. The first carries more weight behind it. None of this amounts to a required checklist, and agreement between pieces doesn't remove the risk of a false signal.
When Ultimate Oscillator Signals Can Mislead You
A handful of real limitations are worth keeping in mind:
Divergence that appears without any reversal actually following it
A signal showing up before the actual trend shift takes place
Extreme readings above 70 or below 30 that show up rarely or frequently depending on the specific instrument
Meaningfully different results when the underlying periods get changed
Genuine disagreement between UO and the broader price structure
Blending three periods together was designed to ease the false-divergence problem, not eliminate it outright. Adding a second indicator on top doesn't automatically resolve these limitations either. It just adds another input worth weighing alongside the rest.
Risk Disclaimer: Trading involves significant risk of capital loss. This article is for educational purposes only and does not constitute financial advice. Always conduct independent research and consider your risk tolerance before making any trading decisions.
See more:InterestingTrading Strategies