CAGR Explained: How to Calculate Compound Annual Growth Rate
An investment fund promises an average annual return of 12%. After five years, you have 10,000 growing to 15,470. Both figures are correct and refer to the same investment. The discrepancy between them is 2,150 and figuring out where it comes from is the key idea of this article.

What Is CAGR: Definition
CAGR stands for compound annual growth rate. It is the steady growth rate per year that would take a starting value to an ending value over a specified period of time.
So, what does CAGR mean in practice? It denotes a smoothed growth rate. The investment surely didn't grow by exactly the same percentage every year and CAGR doesn't claim it did. It tells you a smaller story: what constant rate would give the same result?
And there you have it, the two biggest strengths and weaknesses of the metric at once. The smoothing makes two investments of different lengths comparable through a single figure, and nothing else can do that as neatly. It also throws away all the information about how the journey went, and those details are what the risk comes from.
What is CAGR in stocks? It is simply a calculation of the same kind applied to a share price plus dividends over whatever timeframe you want. There is nothing stock-specific in the metric and this is why you'll see it used for revenue, subscribers and even real estate.
The CAGR Formula
The CAGR formula looks as follows:
CAGR = (Ending value / Beginning value)^(1 / n) - 1
n is the number of years. The caret (^) means raising to that power, so we're taking the nth root of the growth multiple and then subtracting 1 to get it back into percentages.
There are two frequent errors. First is n. It is the number of years between the two values, not the number of observations of them. Five year-end readings from 2020 to 2024 cover four years, not five, and using 5 will understate the result.
The second is leaving out the minus 1. If you do that, you'll get the growth multiple. A nice 12% would become 112%, for instance. If you get an answer above 100% and it refers to something ordinary, that's likely the cause.
A person interested in how to calculate CAGR formula style, by hand, would require a scientific calculator. Almost everybody calculates it using a CAGR calculator or a spreadsheet. In Excel and Google Sheets, the whole thing can be done in a single cell: =(B2/B1)^(1/5)-1, in percentage format.
Step-by-Step Calculation Example
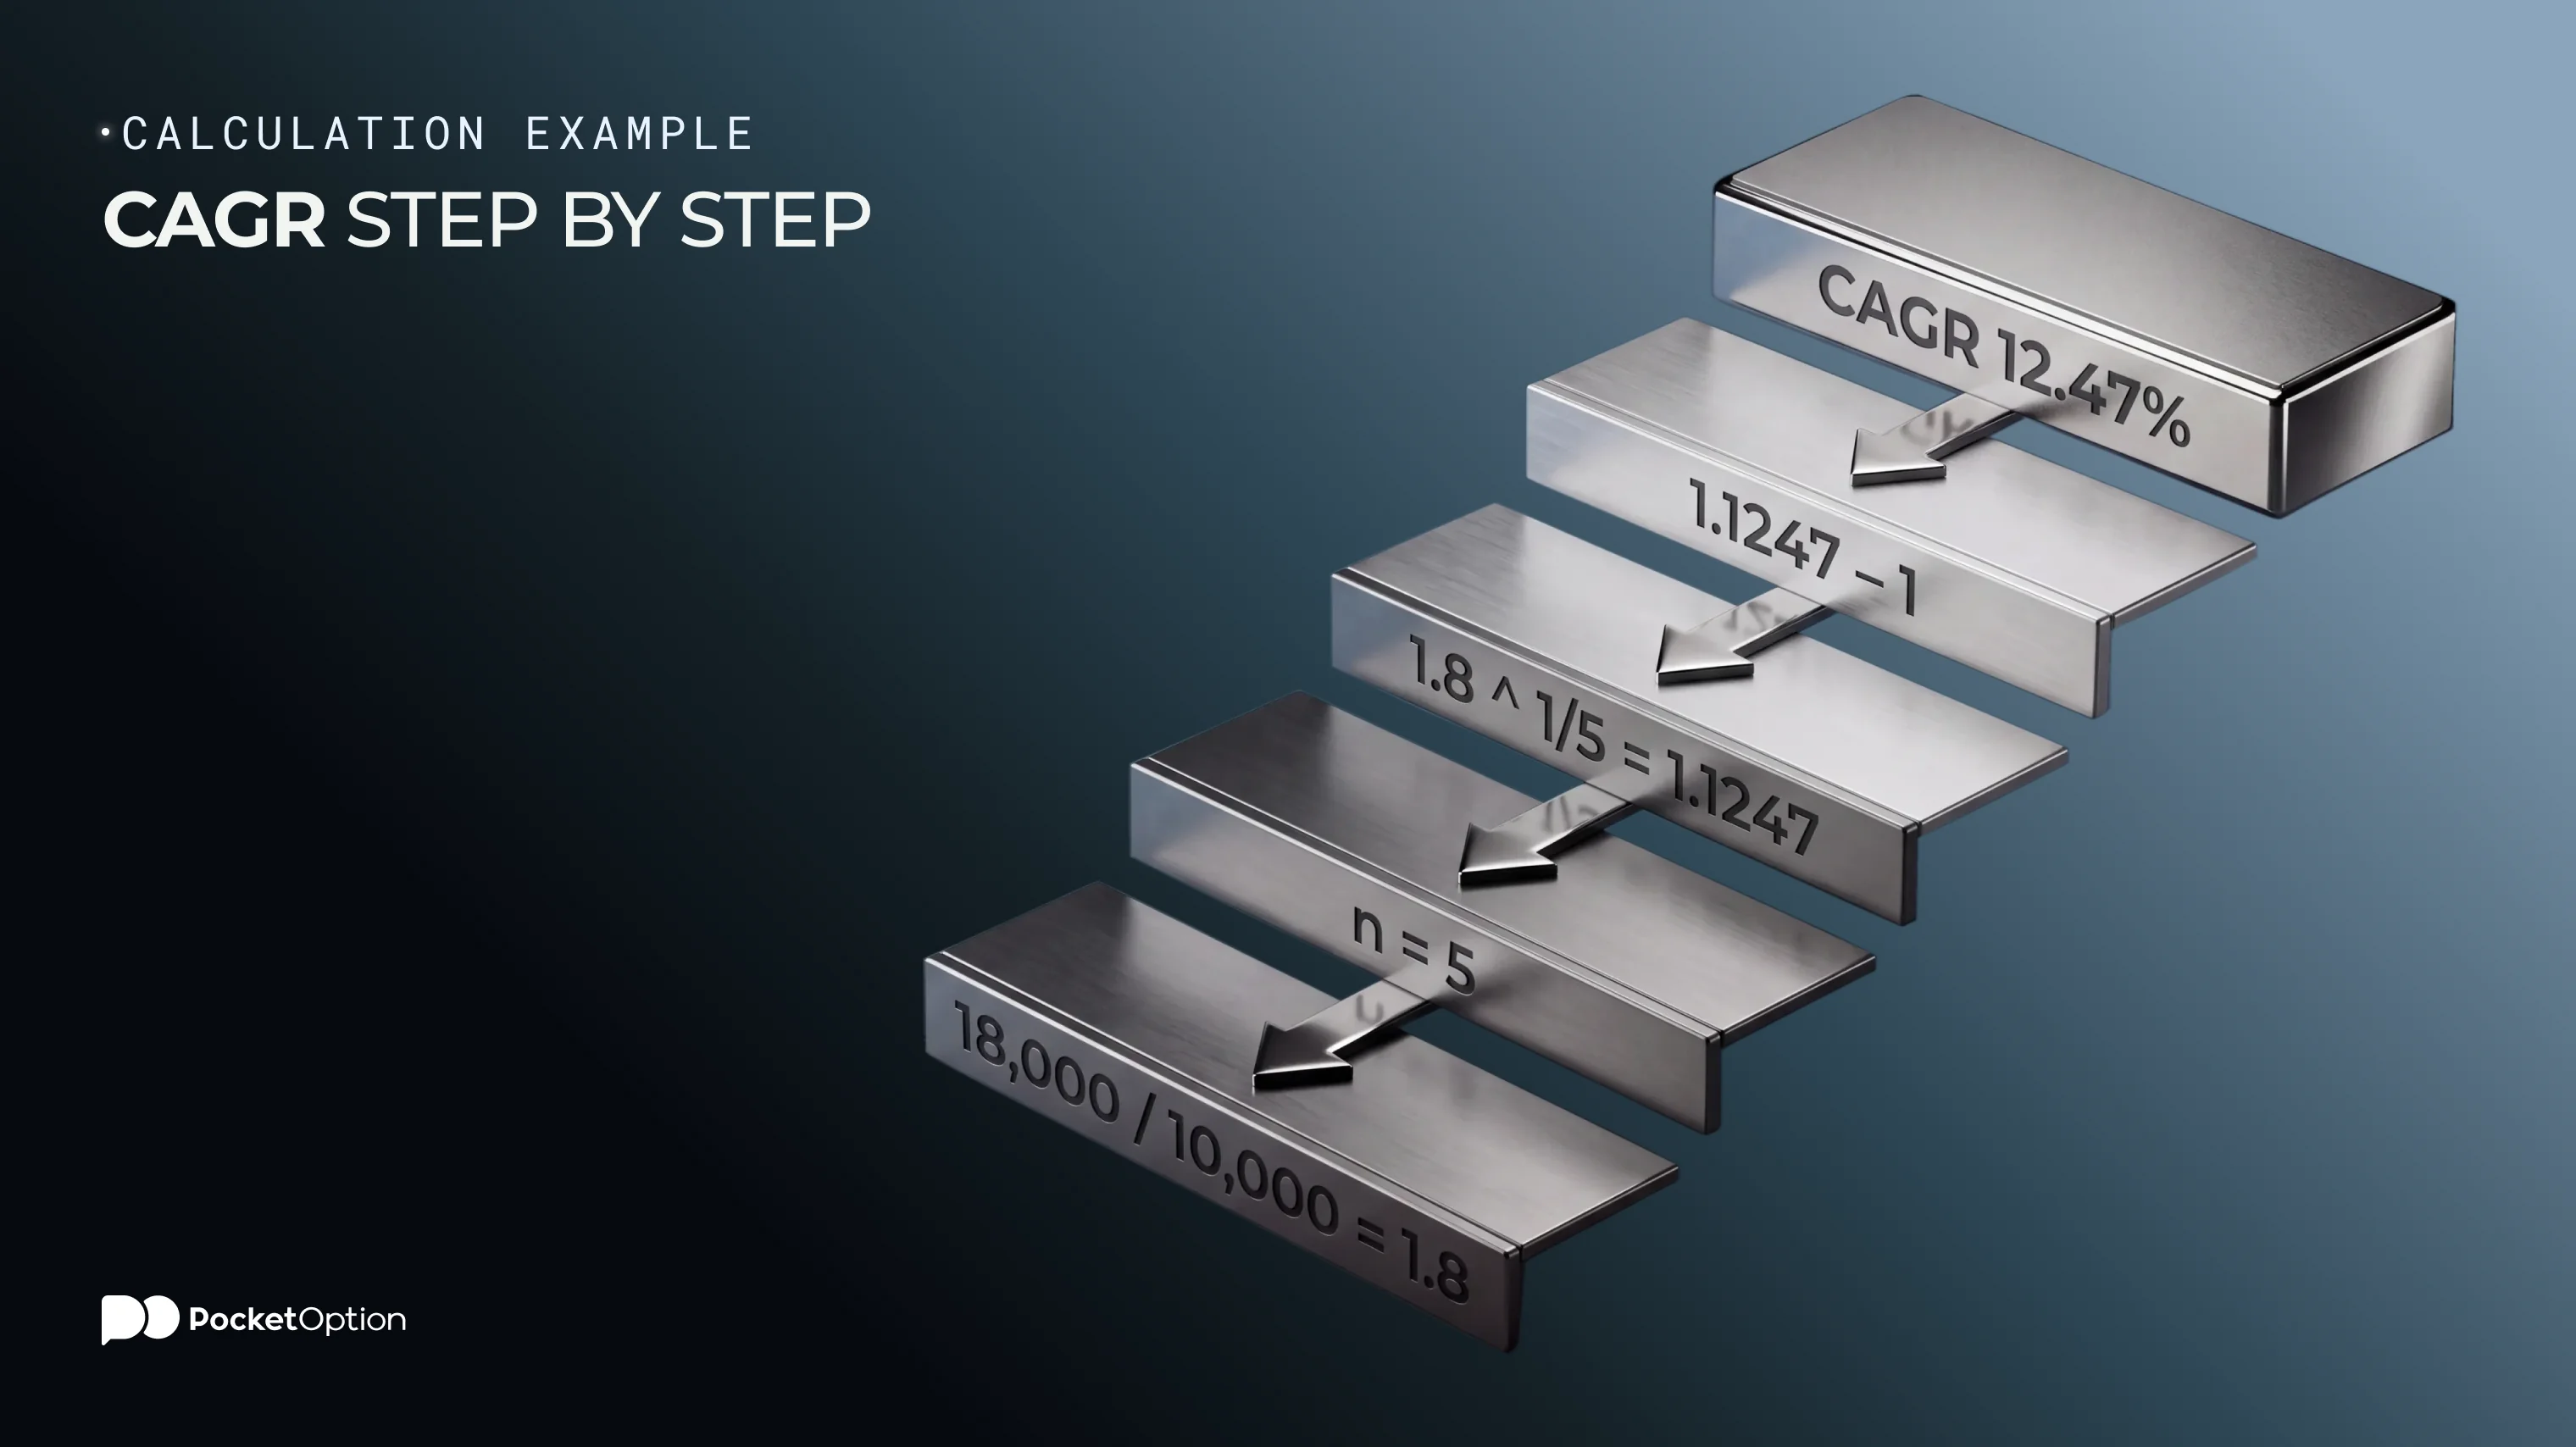
You've invested 10,000. Five years later your position is worth 18,000. Let's find out how to calculate CAGR in this case.
Dividing the ending value by the beginning value. 18,000 divided by 10,000 gives 1.8. This is the growth multiple, so your money is now 1.8 times what it was.
Determining n. The money is invested for five years, so n=5.
Raising the growth multiple to the power of 1/n. 1.8 to the power of 0.2 is 1.1247.
Subtracting 1. 1.1247-1 equals 0.1247.
Converting to percentages. The CAGR is 12.47%.
Checking the result. We multiply 10,000 by 1.1247 five times and we get 18,000. If this reconciliation fails, you either used the wrong n or forgot to subtract 1.
See what the result tells you and what it doesn't. It says that 12.47% per year of steady growth would yield the same result. It says nothing about how the third year went.
What CAGR Tells You About Investment Performance
The key value of the single smoothed rate is that it allows to compare unlike scenarios. A position that has been in place for 3 years and another for 11 cannot be compared by total return, because the second one tends to win by default. Turning both into annualized return brings equality.
It also neutralizes the effects of timing. Two people investing in the same fund, but entering it three years apart, can have different total returns, but their CAGRs are still comparable as long as they know what periods the numbers correspond to.
There is no universal answer to what is a CAGR worth aiming for. Everything depends on the asset class, the period and the alternatives that existed at the time. A 7% CAGR on a government bonds portfolio and a 7% CAGR on a small-cap growth fund are two absolutely different things, because achieving the latter involves much more risk.
This is the true limitation of the metric. CAGR is a measure of return, but the return figure alone tells only half of the story. The other half is the risk involved to get it, and that requires a completely different metric, such as the approach described in this guide to estimating potential portfolio loss with value at risk. Not considering risks and concentrating on returns is how many people get themselves into positions that are too uncomfortable to hold.
CAGR vs Average Annual Return: Key Difference
The arithmetic mean is the sum of all yearly returns divided by the number of years. CAGR is the geometric mean, the compounding of returns that produces the equivalent rate.
Except for the rare case where all the yearly returns are identical, the arithmetic mean is always going to be greater than CAGR. This isn't a property of some dataset in particular, but a mathematically established truth, and the gap grows with increased volatility.
The reason for that is the asymmetry between the percentage gains and losses. 50% loss must be compensated with 100%, not 50%, to bring your account back to the starting point. The arithmetic mean considers them equal, but your account doesn't.
The most vivid example uses two years, a 50% gain followed by a 50% loss. The arithmetic mean is 0, implying break-even. In fact, 10,000 goes to 15,000 on the first one and 7,500 on the second, a 25% loss overall. CAGR, on the other hand, is -13.4% per year. Same two numbers, but only one of them tells your actual balance.
Worked Comparison: Why the Two Numbers Differ
Year | Return | Balance at year end |
|---|---|---|
1 | +40% | 14,000 |
2 | -20% | 11,200 |
3 | +30% | 14,560 |
4 | -15% | 12,376 |
5 | +25% | 15,470 |
Let's take a look at a more realistic five-year example starting from 10,000.Adding up returns and dividing by five: (40 - 20 + 30 - 15 + 25) = 60, and 60 divided by 5 is a 12% average annual return.
And now CAGR. Ending value is 15,470, starting value is 10,000, so the growth multiple is 1.547. Raising to the power of 0.2 (that is, the reciprocal of five) gives approximately 1.0912 and subtracting 1 from it we obtain the CAGR of about 9.12%.
The difference is close to three percentage points and the practical effect of it is even bigger than it appears. If the money had been really growing at 12% for five years, the ending balance would be about 17,623. The actual balance is 15,470. Arithmetic mean can overestimate a 10,000 position by more than 2,100, yet it is absolutely correct as an average.
Moreover, the gap increases with volatility. The rough estimation rule is that geometric return lies below the arithmetic mean by half of the variance of returns. Here the standard deviation is about 24.6%, so half the variance is 3 percentage points. Subtracting 3 from 12% we land somewhere near 9.12%. It's not an identity, but an approximation that is consistent and explains the direction and size.
In practice, it means that whenever a return figure is presented as an average and the underlying returns were volatile, this figure is likely to exaggerate the investment performance. Ask for the compound rate, or calculate it manually from the starting and ending balances.
Growth rates and current prices side by side on the platform.
Get StartedLimitations of CAGR
Four limitations are important and each of them warns you to look elsewhere.
It disregards the volatility altogether. Two investments can have exactly the same CAGR and totally different trajectories, one climbing steadily, the other falling by half and recovering. The metric cannot differentiate between the two and the second one is much harder to withstand.
It ignores cash flows. CAGR assumes a single lump-sum initial investment and nothing until the end. Adding monthly deposits or withdrawals makes the figure meaningless, because the total amount involved changes. The money-weighted approaches, such as IRR or XIRR in a spreadsheet, are better for that case.
It is sensitive to the choice of starting and ending dates. Moving the period a little around a market bottom can lead to a very different CAGR. Any CAGR quoted without the exact period used is incomplete, and choosing the flattering period is the easiest way to polish up a poor record.
It is not predictive. CAGR describes what has already happened. A 12% historical CAGR is not a prediction of future performance of the investment and treating it as such is the most common misuse of the metric.
There is also one important scope limitation to keep in mind. CAGR describes the price growth, but in the case of individual stocks total return depends also on dividends, so the CAGR based on price alone underestimates the performance of the dividend-payer. If the distinction between price return and total return is a novelty for you, it's better to start from the basics of what a stock is.
Practical Uses of CAGR
Understood in its limitations, this metric deserves a place in several specific cases.
Comparing holdings of different duration. This is where it shines better than anything else and why it exists.
Assessing the performance of a fund versus its benchmark. Compare the CAGR of both over the same period, and the difference shows the value the manager added or destroyed.
Monitoring fundamentals of the business. Revenue CAGR, earnings CAGR, subscribers CAGR are common ways to quantify how fast a company is growing.
Managing expectations. Knowing the long-term compound rate of an asset class makes it easier to spot a nonsensical projection.
The same arithmetic answers how to calculate growth rate for anything that compounds, not just portfolios. Revenue, user base, rental income, population: if you have the starting value, ending value and the number of years, the formula works the same.
As for the company analysis, a revenue CAGR is especially valuable when seen in the context of other accounts, rather than isolated, because debt-financed rapid growth is a quite different story from operational growth. That check belongs to a comprehensive fundamental analysis of stocks, not to a single ratio.
Conclusion
Always ask which average you are given.
Two numbers in this article refer to the same five-year period and one of them is almost three percentage points higher than the other. Neither is a lie. Arithmetic mean tells how the typical year went; compound rate shows what you got in the end, and the latter one corresponds to your balance. Whenever the return is quoted without specification whether it is a compound or arithmetic average, assume it is the flattering one and calculate the other from the start and ending values, which can be done in a single cell of the spreadsheet in a few seconds. This habit alone won't make you a better investor, but it will prevent you from comparing a smoothed figure with a real one and mistaking it for insight.
Disclaimer: This article is provided for informational purposes only and does not constitute investment advice. Trading and investing involve a significant risk of capital loss, and historical growth rates are not a predictor of future returns.
Vedi di più:Knowledge baseTrading