Blog with Education
 Albert RobertsonBearish
How to Read Overbought and Oversold Signals With DeMarker Indicator
DeMarker compares price highs and lows to judge overbought and oversold conditions. A practical guide to the formula, the 0.3 and 0.7 levels, divergence and the cases where its signals need a second check.
 Albert RobertsonBearish
How to Read Momentum Acceleration With the AC Indicator
Accelerator Oscillator indicator explained: how AC is calculated, how to read its histogram and zero line, and why color changes are not trading signals.
 Albert RobertsonBearish
GTA 6 Stock Market: Will You Be Able to Trade Stocks?
Rockstar has not officially confirmed a stock market in GTA VI. A short guide to what is known, how LCN and BAWSAQ worked in GTA V and how game prices differ from real trading.
 Albert RobertsonBearish
Sortino Ratio: How It Differs from Sharpe and Why Downside Risk Matters
The Sortino ratio scores return against downside risk only. Here is the formula, a simple worked example, how downside deviation works, how the ratio differs from Sharpe, what a good reading might mean, and the limits to keep in mind.
 Albert RobertsonBearish
Debt Service Coverage Ratio (DSCR): Can a Company Actually Cover Its Debt Payments?
Even with profits a company can fail to make loan payments. A profit is an accounting result. A loan payment is a sum of money leaving the bank at a definite date. The debt service coverage ratio determines if one could cover the other. This article describes the calculation with the help of a hypothetical leveraged company example, shows the mistake that distorts the result most often, and explains what the ratio does not reveal.
 Albert RobertsonBearish
PMI and ISM: Why Survey-Based Indicators Often Lead Hard Economic Data
On 21 November 2025, S&P Global released its purchasing managers' survey covering November 2025. There were still nine days left until the end of that month. This is why people follow such surveys in advance. The official statistics for November became available in mid-December, while the GDP figure covering it was released in late January. This post will explain what the surveys cover, what the 50-level means (or does not), and how to interpret a survey release without taking it too seriously.
 Albert RobertsonBearish
Non-Deliverable Forwards: How Cash-Settled Contracts Work for Restricted Currencies
Some currencies can't just be easily bought, they are restricted. For those, the market often settles forwards in cash, through paying out only the gap between an agreed rate and an official fixing. Those are so-called ‘non-deliverable forwards’, and it can be important in forex to understand exactly how those operate.
 Albert RobertsonBearish
Accrual Accounting: What the Accrual Basis Is, How It Works and Why It Matters
A company can show positive results for a quarter despite negative cash flow. No fraud occurred, no one misreported and auditors will confirm that. That is how the system works. Understanding this difference is the most valuable insight when analyzing financial statements. The article explains the origins of this difference, follows a transaction through it, and presents a test of whether reported profit is supported by cash.
 Albert RobertsonBearish
Sortino Ratio: How It Differs from Sharpe and Why Downside Risk Matters
So, what is the Sortino ratio? It’s a useful metric in trading and investing that calculates your returns, per unit of downside deviation. This is a risk-adjusted return that’s meant to ‘penalize’ the bad periods, where returns didn’t quite hit the benchmark. Meanwhile, good periods (with only upside volatility) get through fine, which is the entire point.
 Albert RobertsonBearish
What Is the Phillips Curve? Inflation and Unemployment Explained
The Phillips curve links inflation and unemployment in a simple short-run trade-off. This guide explains how the curve works, how the short-run and long-run versions differ, why expectations and supply shocks move it, and where the model falls short.
 Albert RobertsonBearish
What Is Quantitative Tightening (QT) and How Does It Affect Financial Markets?
Quantitative tightening shrinks a central bank's balance sheet through runoff and, in some cases, active sales. This guide explains how QT works, how it differs from QE and rate hikes, how it can affect bonds, currencies and stocks, and why its market impact varies.
 Albert RobertsonBearish
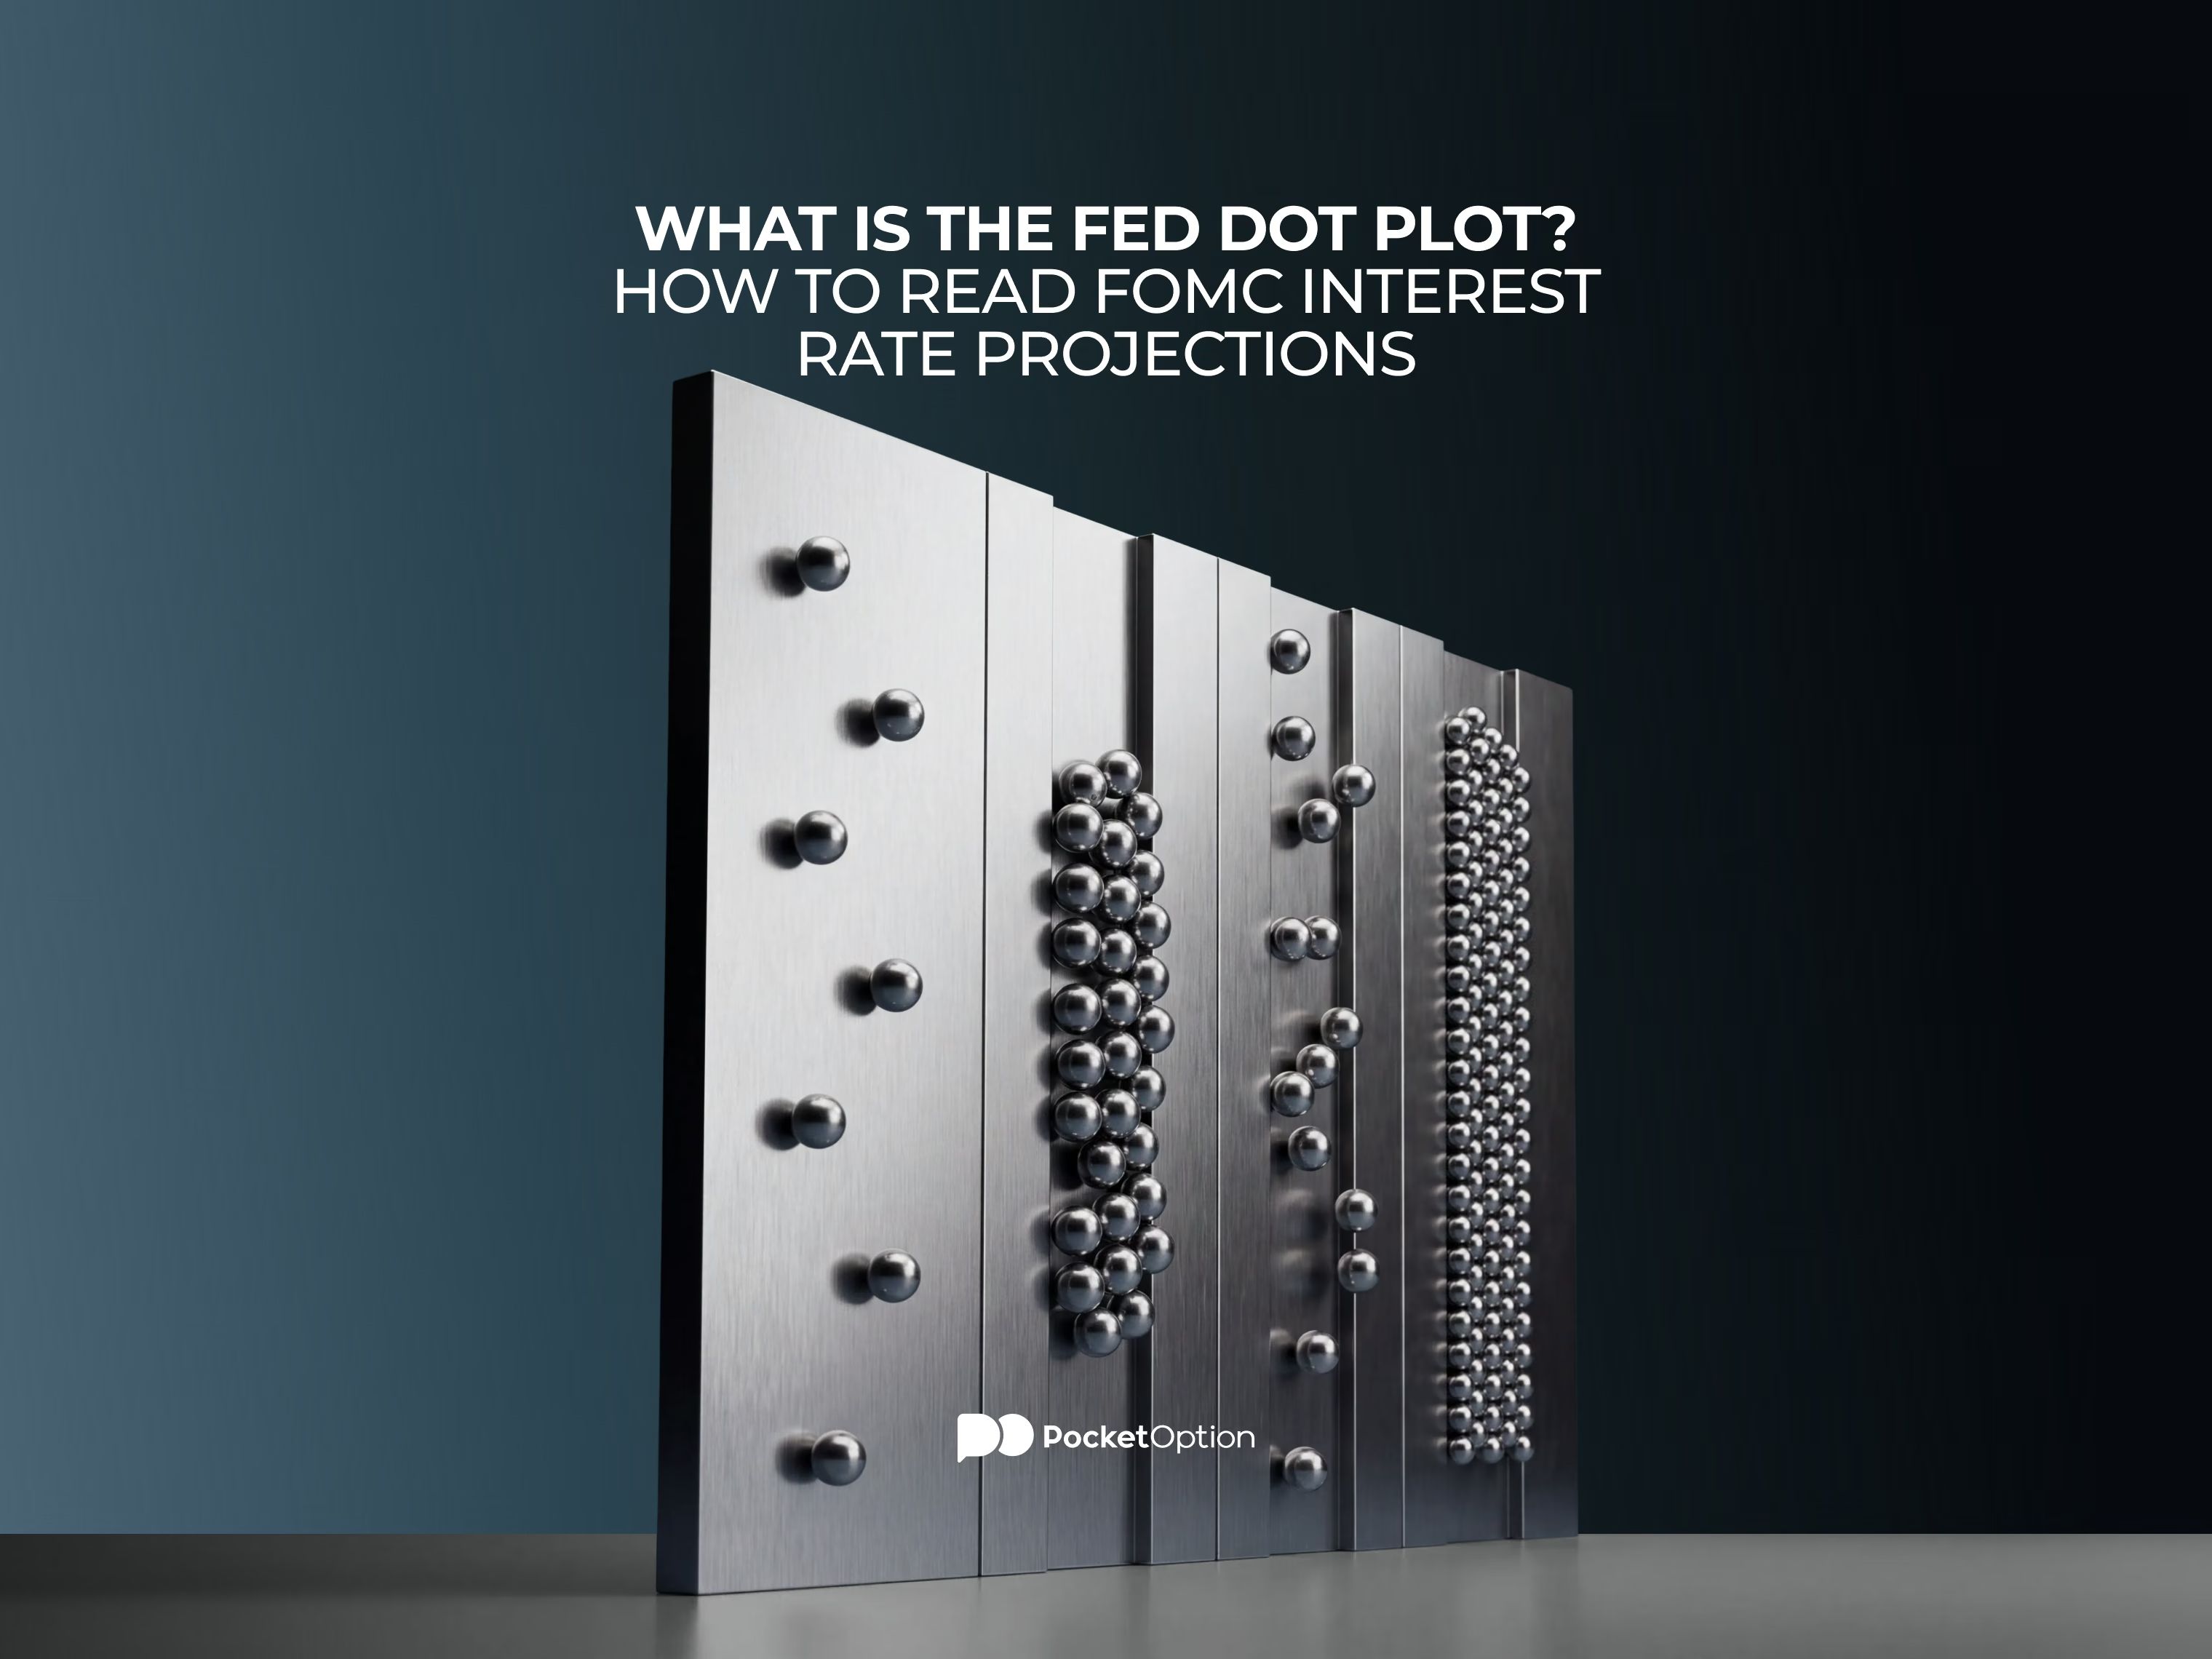
What Is the Fed Dot Plot? How to Read FOMC Interest Rate Projections
The Fed dot plot collects individual FOMC rate projections in one chart. This guide explains what each dot represents, how to read the years and the longer-run column, what the median and the spread suggest, and what to compare in each new release.
 Albert RobertsonBearish
What Is the Fisher Effect? Inflation and Interest Rates Explained
The Fisher Effect links nominal interest rates, real interest rates, and expected inflation. This guide explains the exact and simplified formulas, works through a plain numeric example, and covers why the observed relationship can diverge from the clean theory in practice.
 Albert RobertsonBearish
What Is the Taylor Rule? Formula and How It Guides Interest Rate Policy
The Taylor Rule is a formula that suggests a short-term interest rate based on inflation and economic activity. This guide explains the classic 1993 formula, what the inflation gap and output gap mean, why the neutral real rate matters, and how traders can interpret the rule as a reference point rather than a trading signal.
 Albert RobertsonBearish
Volatility Clustering in Financial Markets: What It Is and Why It Happens
Volatility clustering describes how periods of large price changes and calm periods with small changes each tend to group together over time. This guide explains why the pattern happens, how it differs from a single volatility spike, how ARCH and GARCH models capture it, and what it means for assessing risk.
 Albert RobertsonBearish
Leading Indicators in Trading: How They Differ From Lagging Indicators
Leading indicators try to flag a possible shift in momentum or direction before it fully shows up in price, while lagging indicators confirm a move after it's already underway. This guide covers how each type works, common examples like RSI and MACD, and why traders often combine both.
 Albert RobertsonBearish
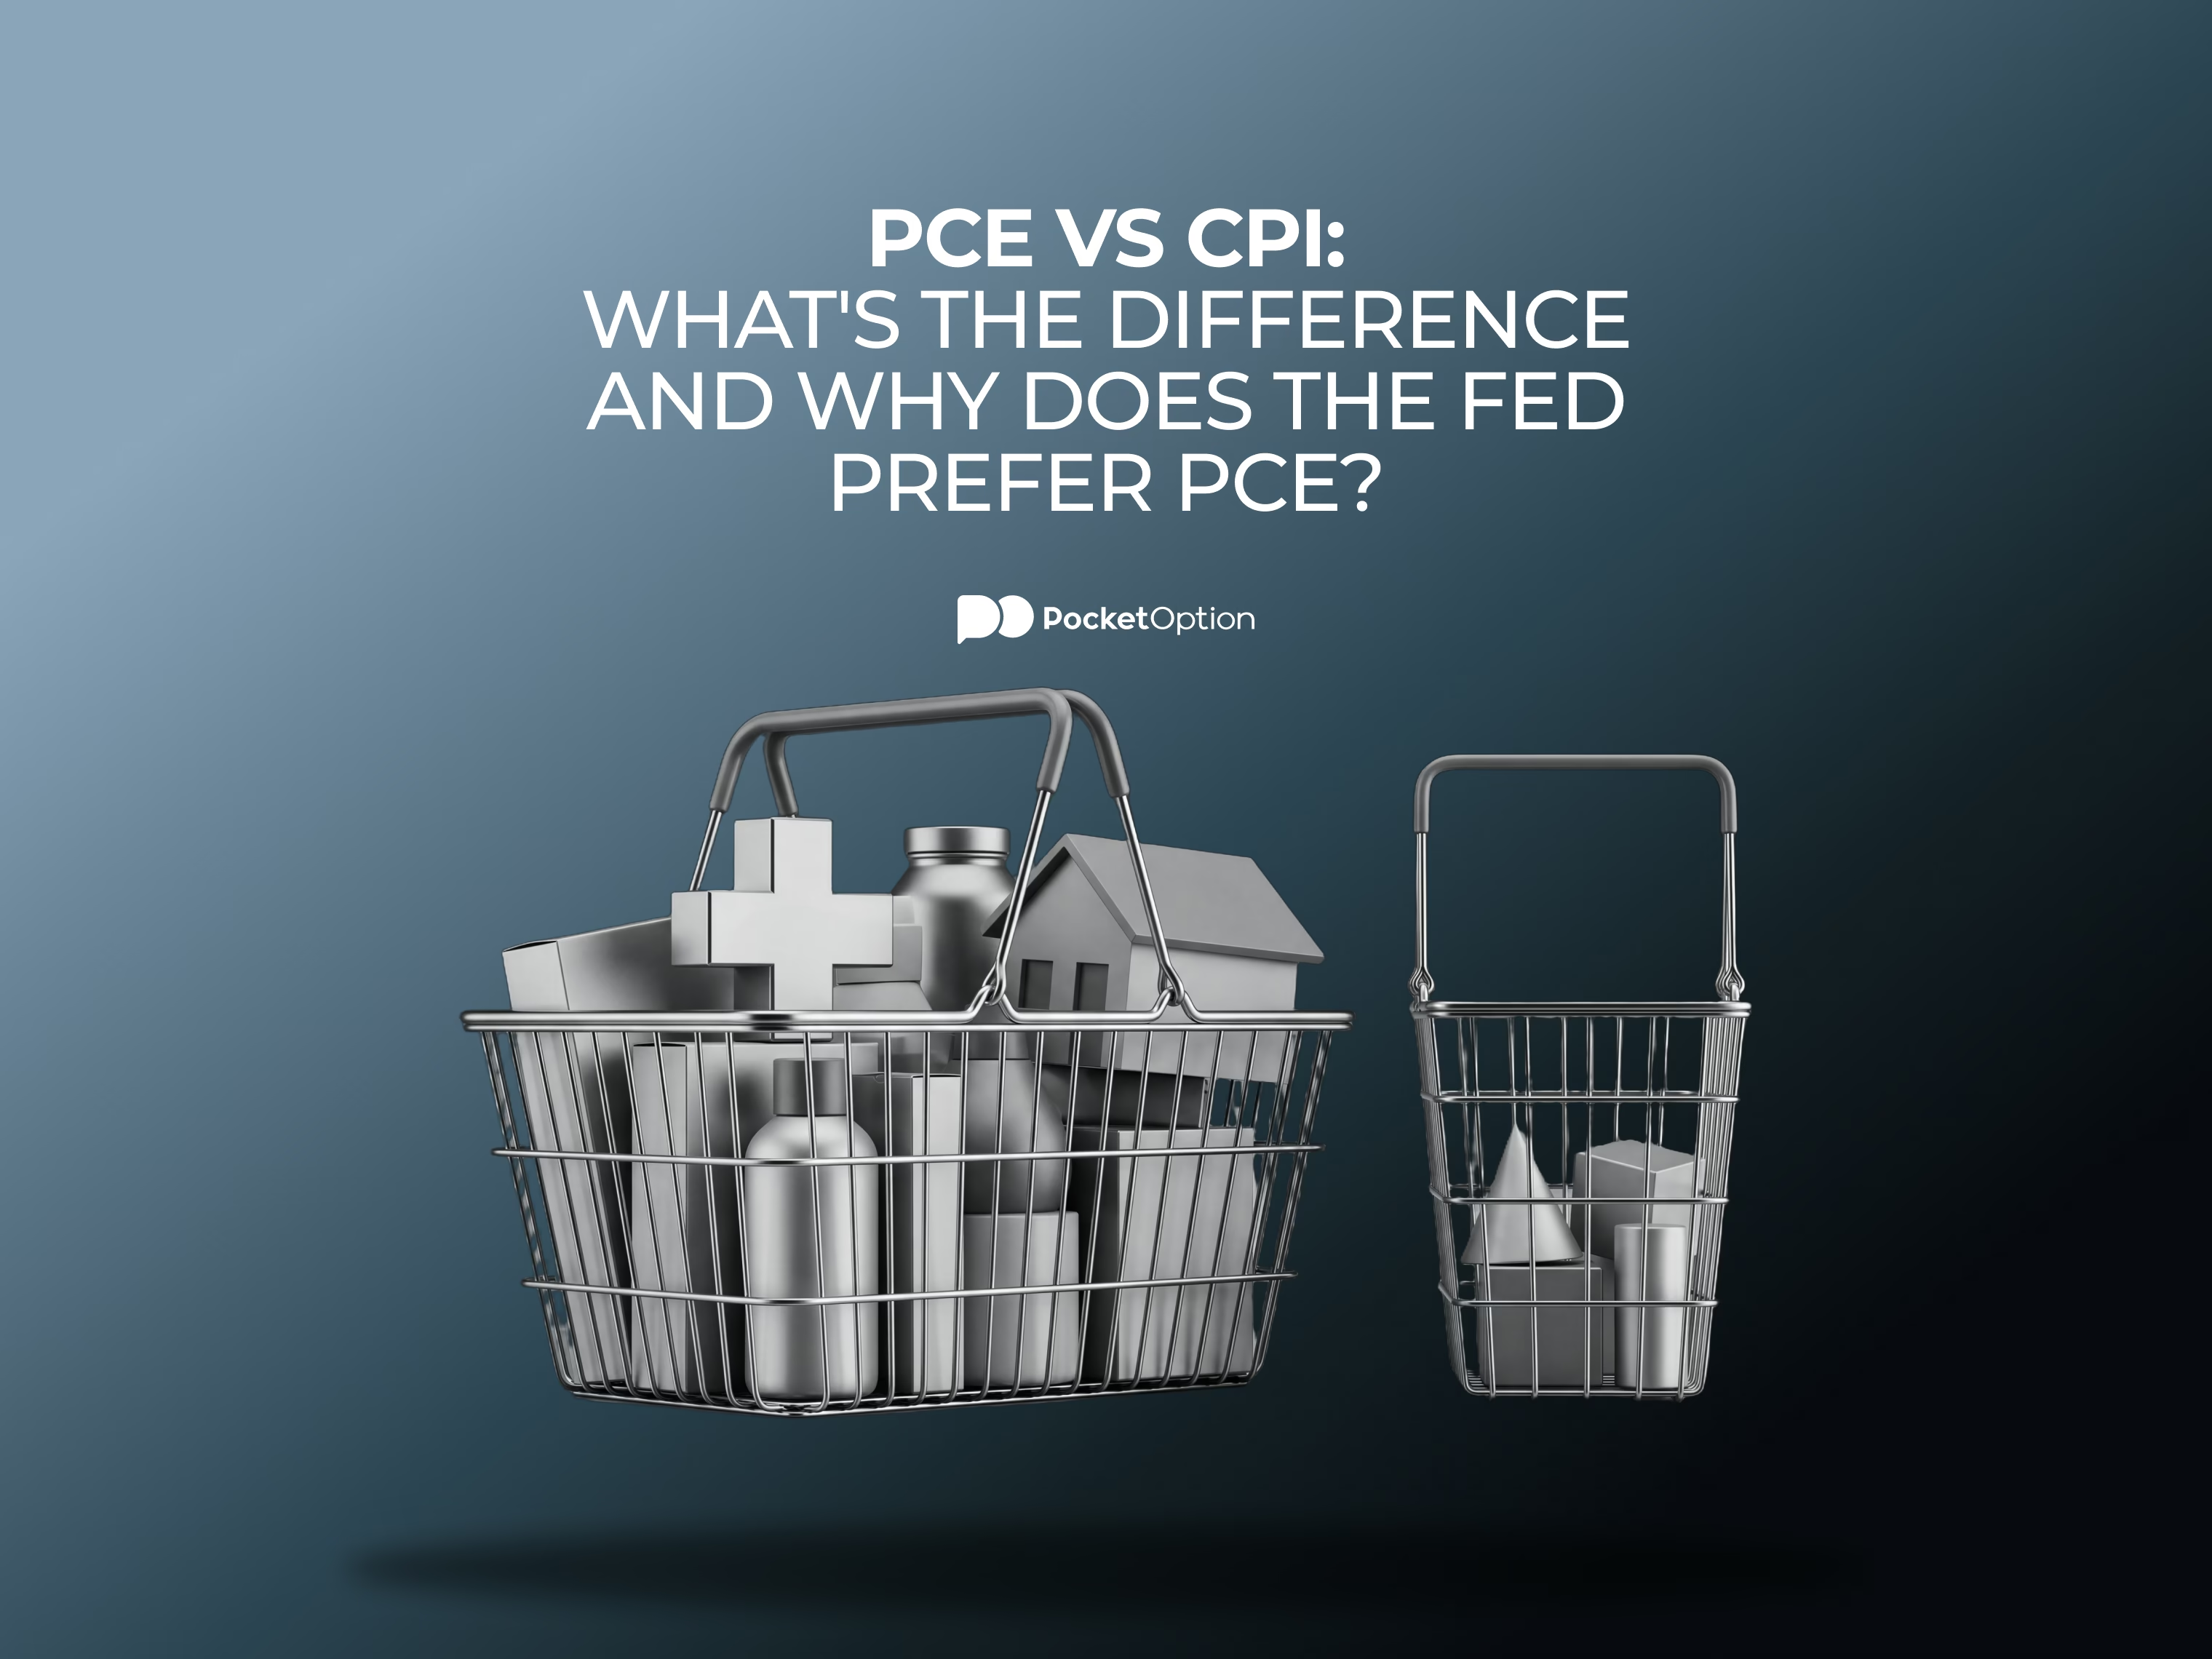
PCE vs CPI: What's the Difference and Why Does the Fed Prefer PCE?
PCE and CPI both track US consumer inflation, but differ in coverage, weighting, and data sources. This guide covers what each index measures, why their values can diverge, and why the Fed relies on PCE for its long-run inflation goal.
 Albert RobertsonBearish
Coefficient of Variation: Comparing Risk Across Assets of Different Scale
Two assets can look similarly risky on paper, but be nothing of the sort in reality. Standard deviation counts the wobble, but pays no mind to the size of the thing doing the ‘wobbling’. That’s where a coefficient of variation (CV) is useful. It puts the risk and reward in one fraction, and might help your trading or investing.
 Albert RobertsonBearish
What Is the Asset Turnover Ratio? Formula, Calculation and Interpretation
How much selling can a company get, out of the stuff that it owns? This is the question people ask when they determine the asset turnover ratio. On the surface, it’s a single line of arithmetic, but in reality, it can easily determine the direction of an investment or a trade.
 Albert RobertsonBearish
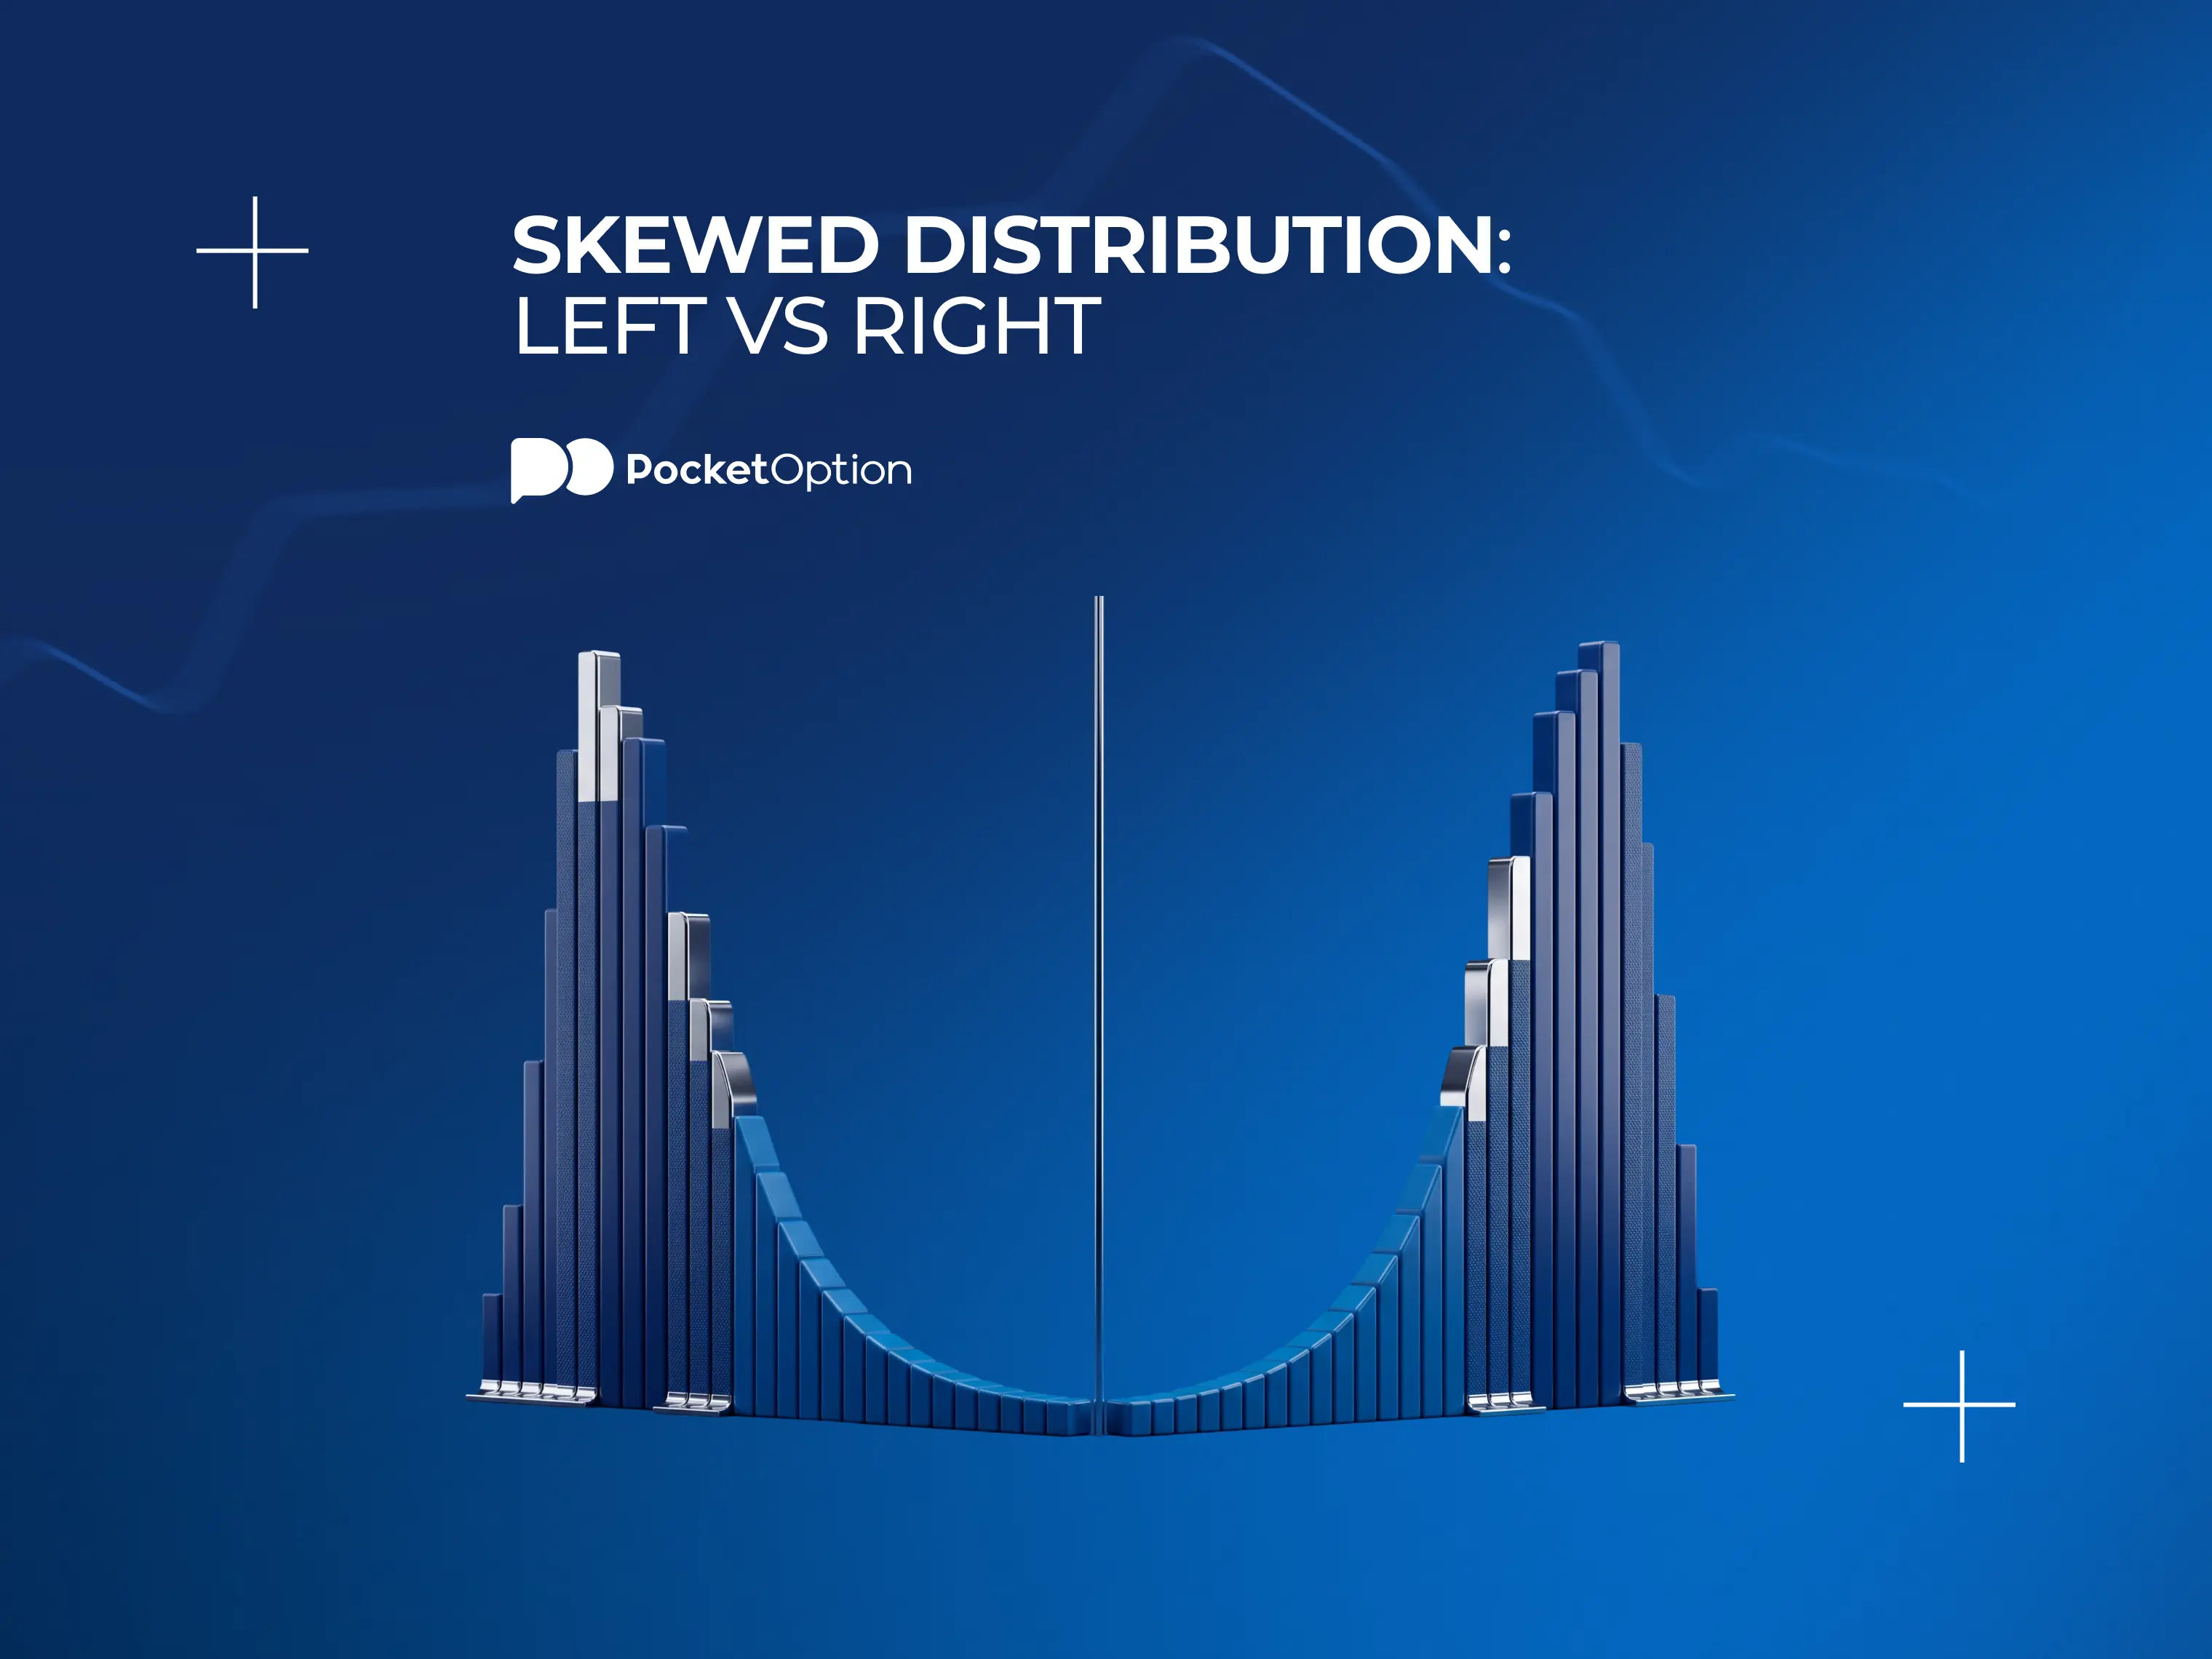
Skewed Distribution: Left-Skewed vs Right-Skewed Graphs
Where standard deviation shows how dispersed things are, skewness answers the question of where unexpected values originate, and this is generally the more relevant concern for anyone holding a position.
 Albert RobertsonBearish
How Does a Currency Strength Meter Compare Strong and Weak Currencies?
A currency strength meter compares the relative strength and weakness of several currencies at once, based on movement across the pairs connected to each one. This guide covers how it's calculated, how to read the results, and its limits.
 Albert RobertsonBearish
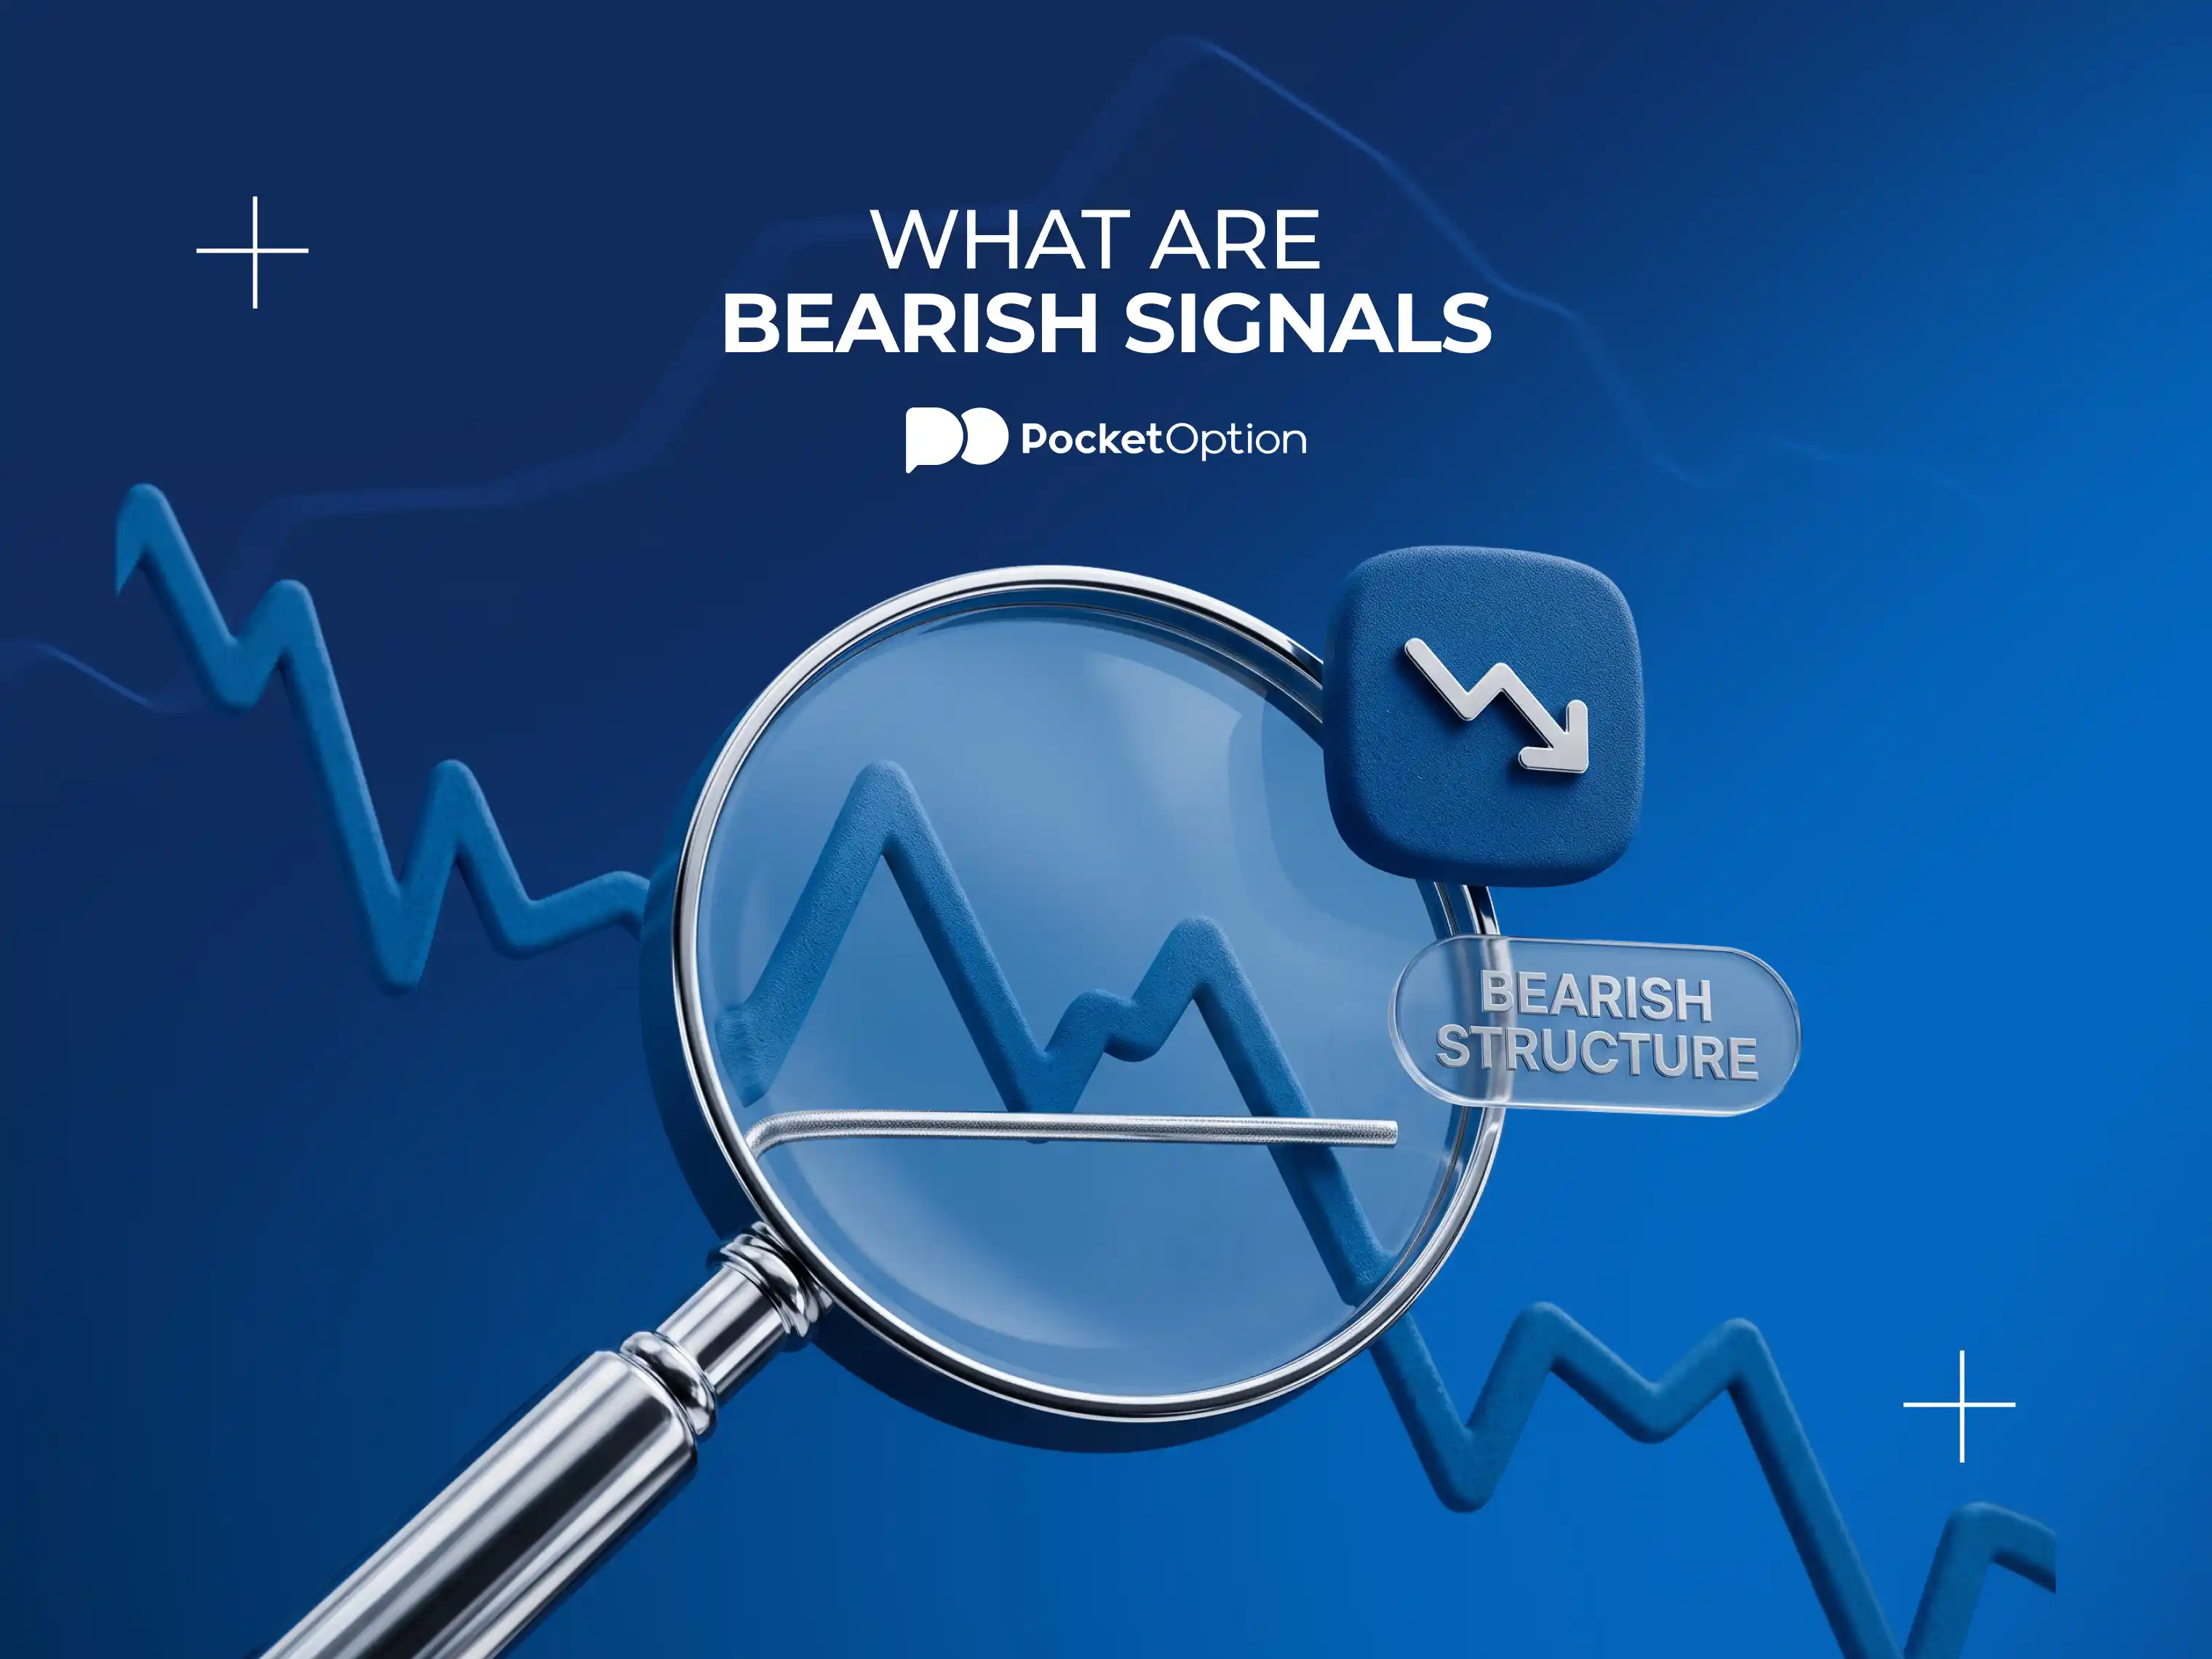
What Are Bearish Signals and How Can You Spot Them on a Chart?
Bearish signals are a collection of features, price structure, support breaks, momentum, and volume, that may point toward price weakness without guaranteeing it. This guide covers what to watch for, why one signal is usually not enough, and when these signals can mislead.
 Albert RobertsonBearish
Stakeholders Meaning. Who They Are in Business, Types and Real-World Examples
A company has meaning to more people than just the shareholders (the ones who actually own it). Some have signed a contract with it, some can shut it down completely, and some just allow it to function. All of them are called its stakeholders.
 Albert RobertsonBearish
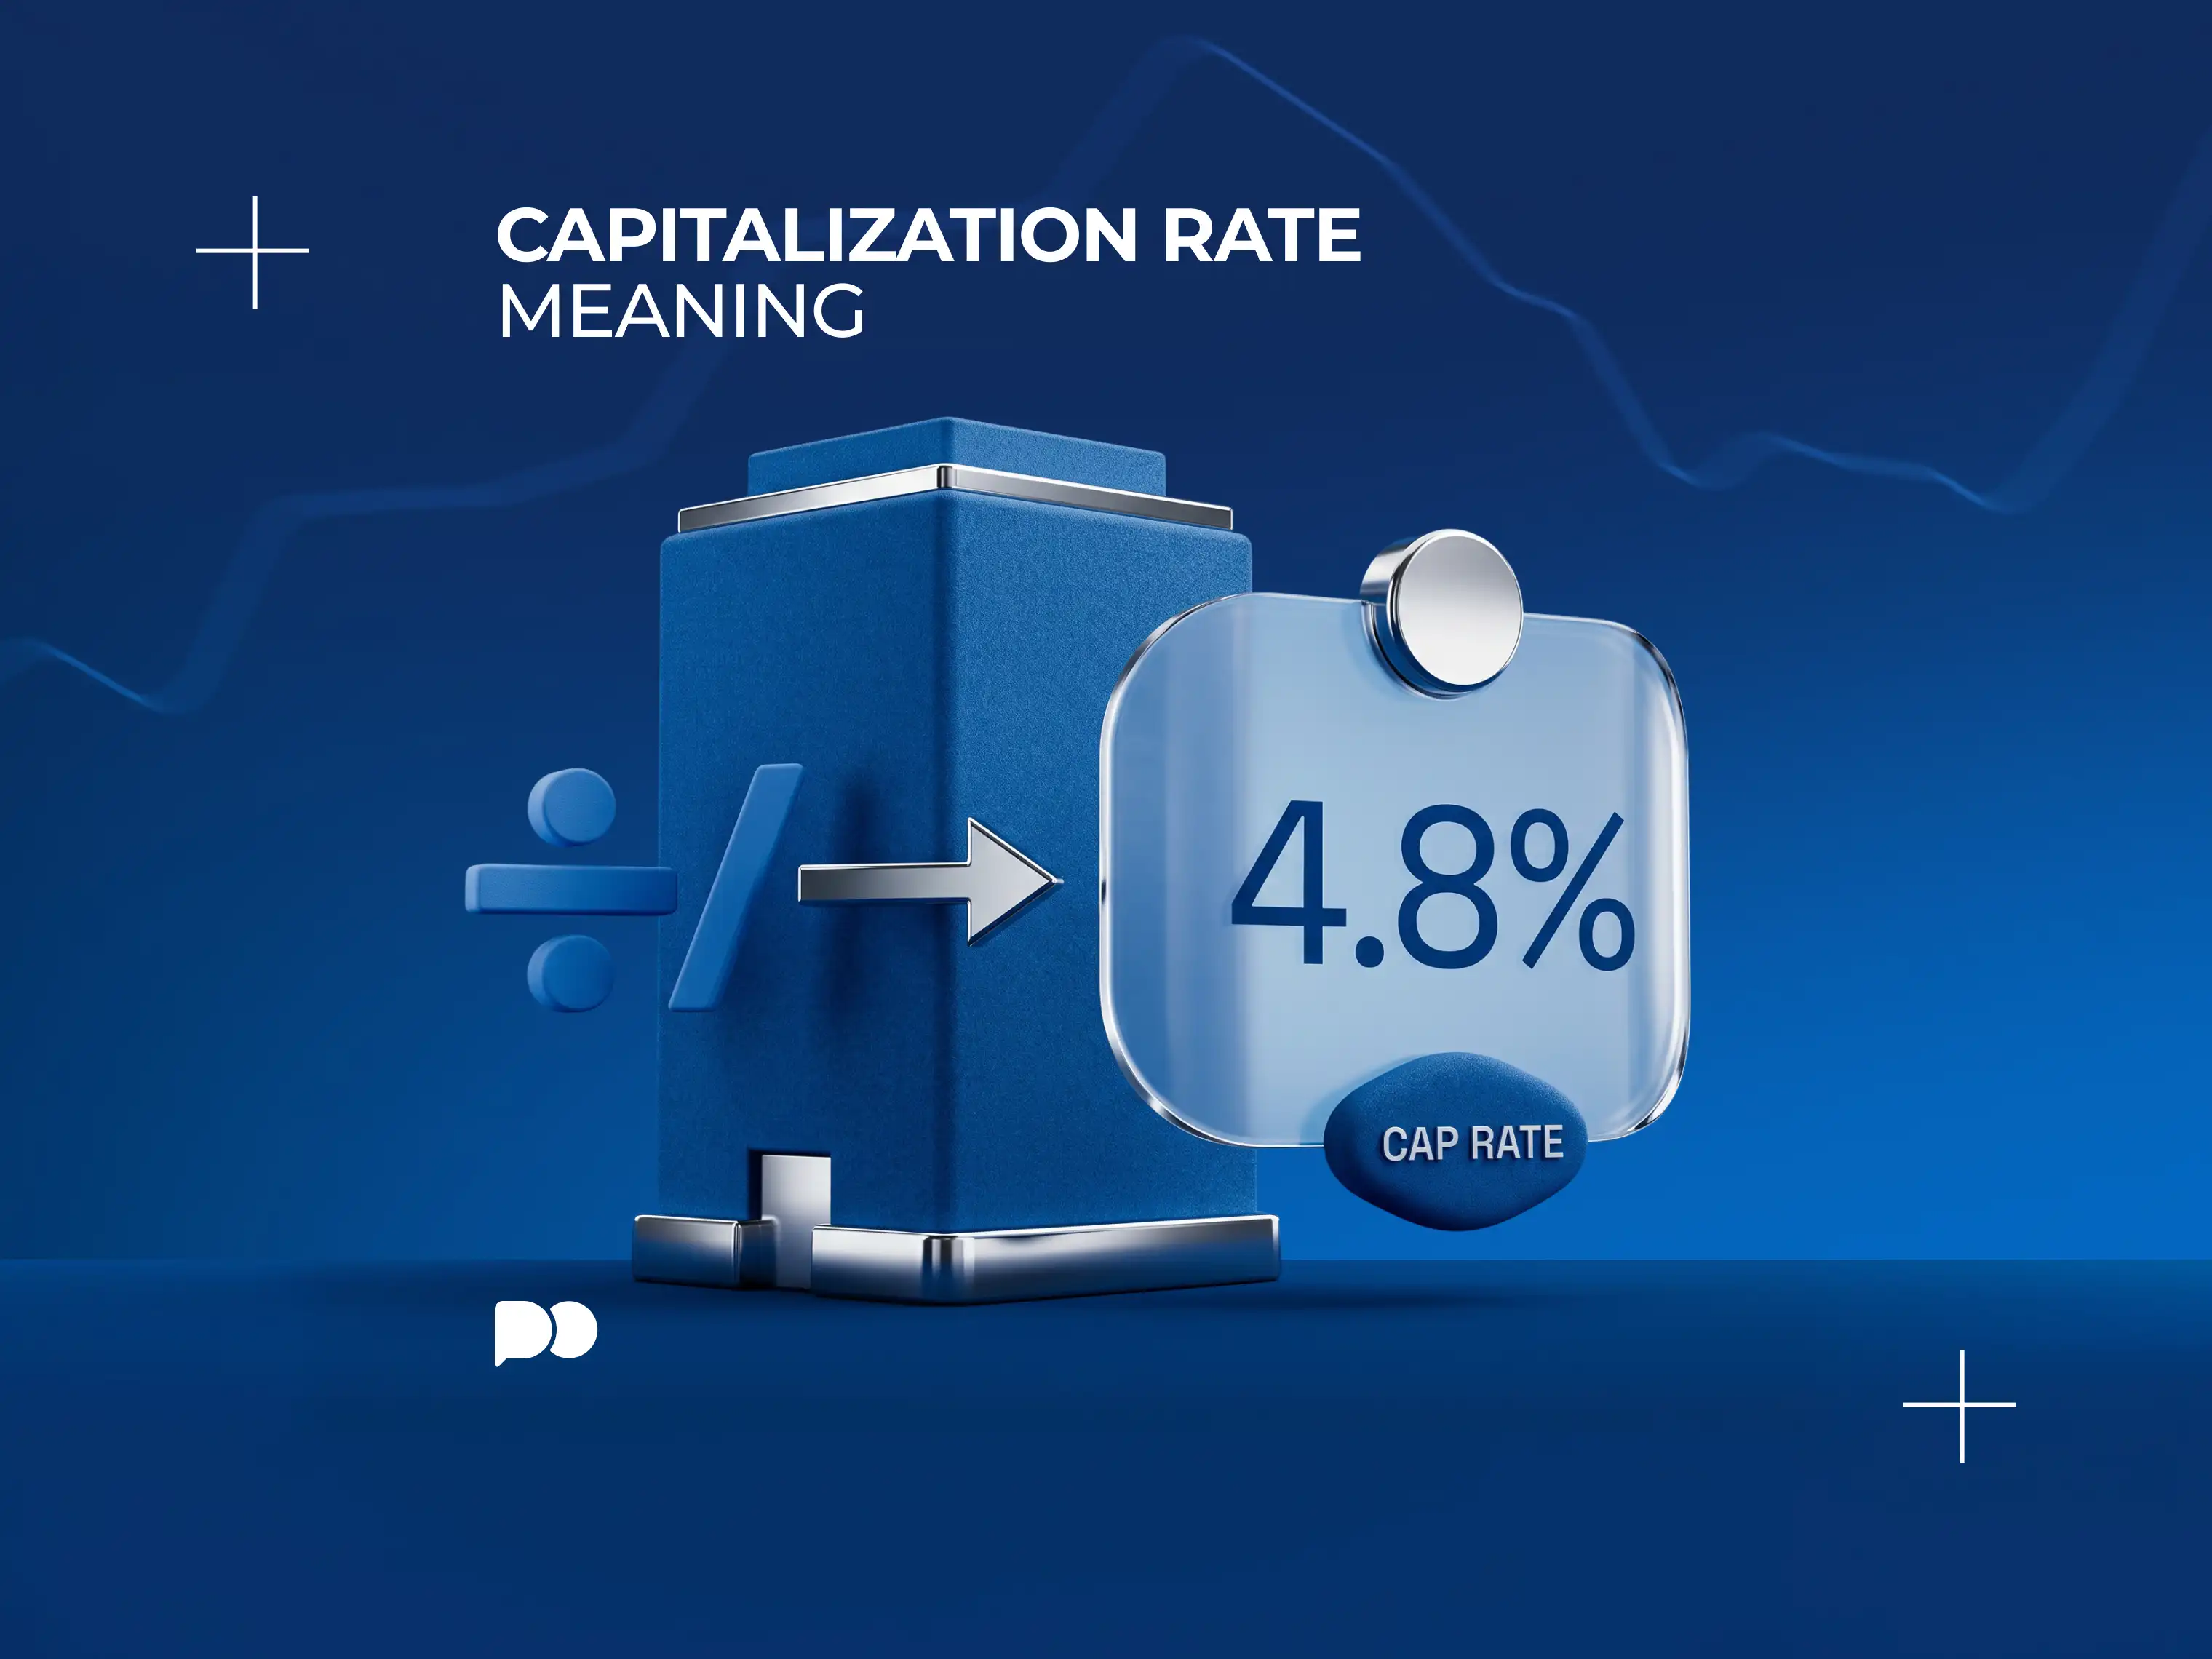
Capitalization Rate Meaning: How Cap Rate Works in Real Estate and What It Tells Investors
Two buildings can carry the same price tag, but still pay out very different amounts. Cap rate is the one number that shows that gap, before anything else gets looked at. This is an important metric to understand in real estate.