What Are Bearish Signals and How Can You Spot Them on a Chart?
Bearish signals are a collection of features, price structure, support breaks, momentum, and volume, that may point toward price weakness without guaranteeing it. This guide covers what to watch for, why one signal is usually not enough, and when these signals can mislead.

Bearish Signals: What Are You Actually Looking For?
A single symptom rarely tells a doctor much on its own. A slightly elevated temperature could mean almost anything, or nothing at all, a passing bug, stress, or just an off day. But that same temperature, alongside a cough, fatigue, and a sore throat showing up together, starts painting a clearer picture worth actually paying attention to. Reading a chart for signs of a bearish trend works on similar logic. No single feature confirms anything by itself. It's not one specific indicator or pattern, and it's not a single moment on the chart either. It's a collection of features that can point toward weakening buyers, growing seller pressure, or a developing bearish trend, and none of them, taken alone, guarantees where price actually goes next.
The features worth watching fall into a handful of groups: price structure, support levels, momentum, and volume. Each one gets its own section further down.
Category | What It Looks At | Example |
|---|---|---|
Price structure | Sequence of highs and lows | Lower highs and lower lows |
Support | Price relative to a previously held level | A break below support |
Momentum | Strength or weakening of the current move | A bearish crossover |
Volume | How much of the market is participating | Rising activity during a decline |
What matters up front is this: spotting one of these on its own doesn't confirm a bearish trend is actually underway. It's a piece of a larger picture, not the whole picture itself.
Open a free demo account and get a feel for real price action, using virtual funds.
Try Demo AccountReading about the concept only goes so far. Watching price structure, momentum, and volume actually move alongside each other shows the pattern faster than any description can.
Open a demo trading account and get a feel for how these features actually behave together, with virtual funds and nothing real on the line.
Bearish Trend: Start With the Price Structure
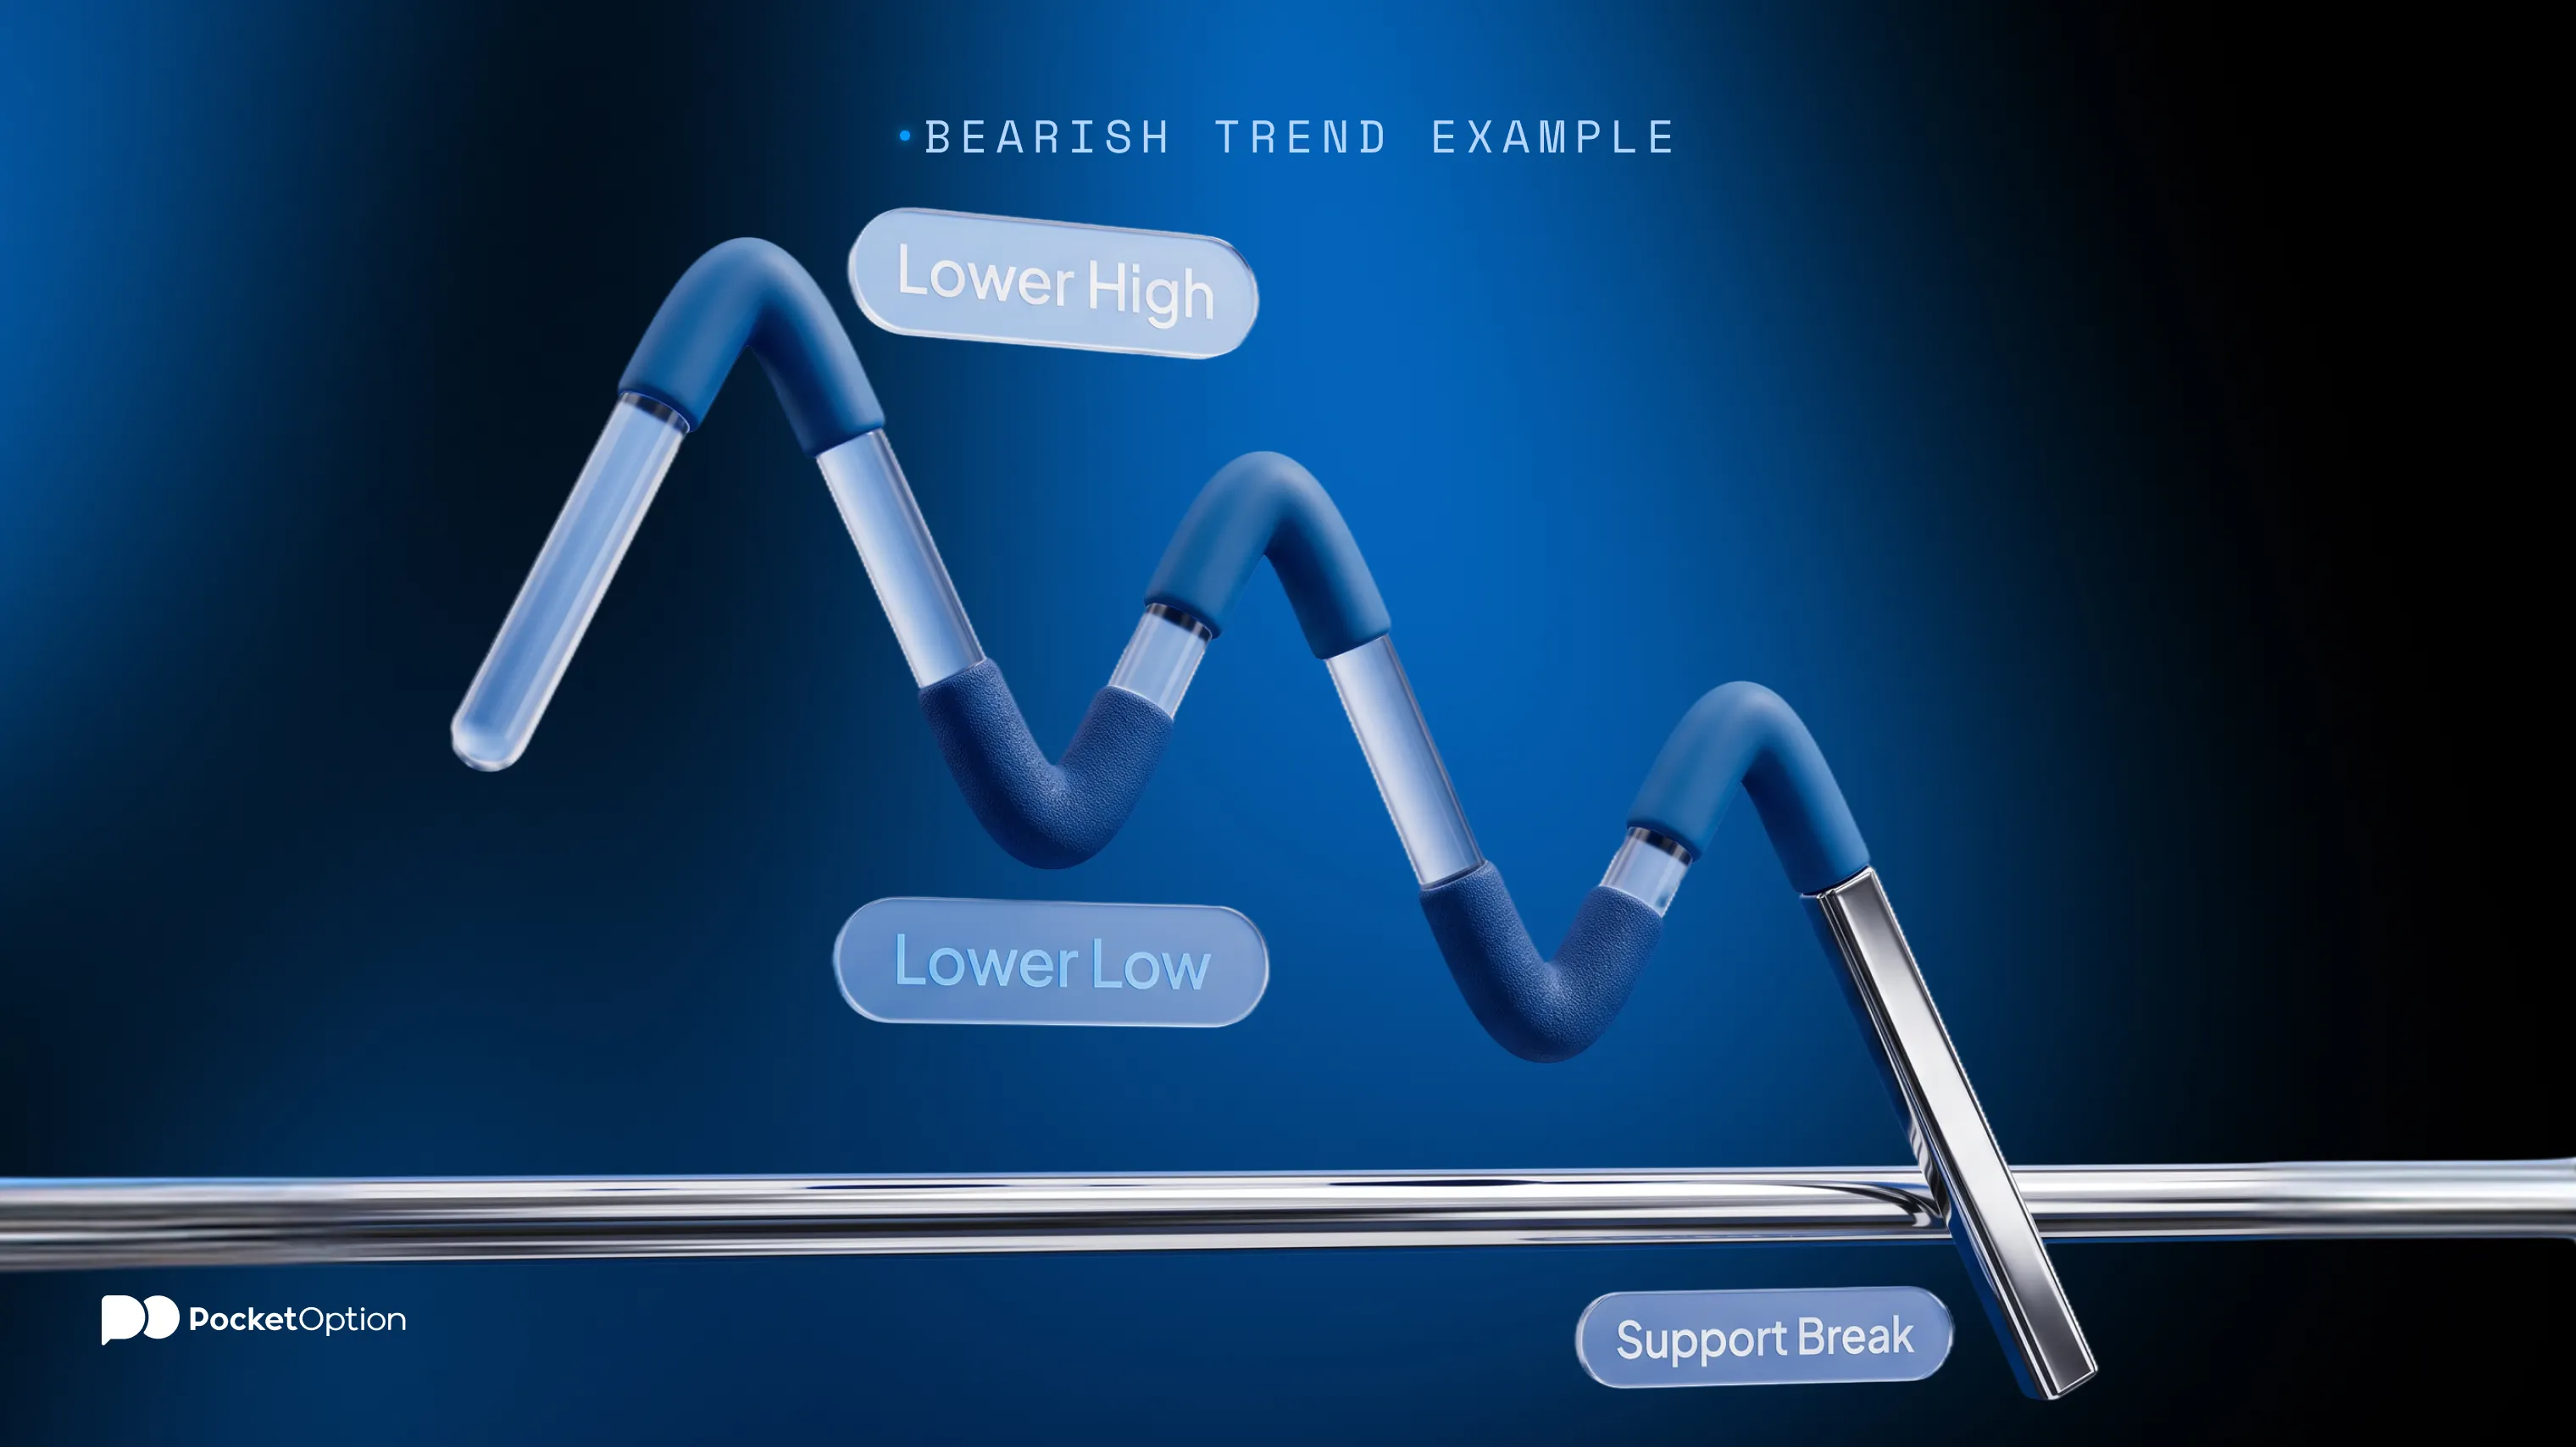
Among all the bearish signals worth learning to read, price structure usually comes first. A sequence of lower highs and lower lows, each swing failing to reach as far as the one before it on both the upside and the downside, is often where that structure shows up most clearly. That sequence gives more context than any single red candle or a brief pullback ever could.
How that structure actually reads depends heavily on the timeframe in view. A short-term dip can sit entirely inside a much larger uptrend, and reading bearish signals off the wrong timeframe is a common way to misread what's actually happening. There's no fixed number of lower highs or lower lows that automatically confirms a trend has flipped. Checking price structure directly through your Pocket Option login account, across a few different timeframes, tends to say more than any single chart snapshot, and it's one of the more reliable ways to separate real bearish signals from noise.
What a Break Below Support Can Tell You
Price moving below a support area that had previously held counts as another bearish signal worth noting. A brief poke below the level and a quick recovery reads differently than a more sustained move that actually holds below it. Follow-through matters here, and so does the broader market context surrounding that specific level. Treating every single dip below support as an automatic bearish signal confirming a new downtrend overstates what one break, on its own, actually shows.
Bearish Indicators: What Momentum Can Add
Bearish indicators add a layer of confirmation on top of price itself, rather than replacing that analysis entirely. Weakening momentum, a bearish crossover, or an indicator's position relative to its own reference level can all add texture to the picture that price structure alone doesn't fully capture. RSI, MACD, and moving averages come up often as examples here, though the specific settings and how to read them shift depending on the tool and the timeframe in use. None of these tools work identically across every instrument, and treating one setup as universally correct skips past that variation.
When Volume Adds Weight to a Bearish Move
Volume offers a way to gauge how much of the market is actually participating in a decline or a support break, rather than just watching price move on its own. Rising trading activity during a move adds context, though it doesn't make that decline guaranteed to continue, and thin volume behind a move can be worth noting too. What volume data is actually available, and in what form, depends on the specific market and data source in question. There's no fixed volume threshold that, once crossed, confirms a signal on its own.
Why One Bearish Signal Is Usually Not Enough
A simple, purely illustrative comparison makes the point. In one scenario, a single indicator shows weakening momentum while price structure itself hasn't actually changed yet, lower highs and lower lows simply aren't there. In another, lower highs, a support break, and weakening momentum all show up around the same time, independently of each other. The second scenario carries more weight, simply because more independent pieces are pointing the same direction at once, not because any one of them individually became more powerful. That's the idea behind confirmation. It's not a fixed checklist where completing every item guarantees a specific outcome, and treating it that way misses the actual point. Candlestick patterns can add another layer of context here too, without needing a detailed breakdown of any specific formation to make that point.
When Bearish Signals Can Be Misleading
A handful of situations can distort what these signals actually show:
False breakouts, where price briefly breaks a level only to reverse right back
Short-term volatility that fades quickly without leading anywhere
Different signals appearing on different timeframes for the exact same instrument, sometimes pointing in opposite directions
Indicators that lag behind price rather than leading it, confirming a move only after much of it has already happened
Moments where price and an indicator actually diverge from each other, each telling a different story
The same signal can carry a different weight depending on the broader trend and market context surrounding it. None of this adds up to a ready-made set of sell conditions or a fixed list of indicators that works the same way in every situation.
Risk Disclaimer: Trading involves significant risk of capital loss. This article is for educational purposes only and does not constitute financial advice. Always conduct independent research and consider your risk tolerance before making any trading decisions.
See more:Education