What Is the Phillips Curve? Inflation and Unemployment Explained
The Phillips curve links inflation and unemployment in a simple short-run trade-off. This guide explains how the curve works, how the short-run and long-run versions differ, why expectations and supply shocks move it, and where the model falls short.

Say you run a café. Two baristas quit in the same week. You can't hire at the old rate, so you offer a dollar more an hour. Fine. Payroll jumps. The flat white goes from $4.50 to $4.90, because someone has to pay for it. Now do that across a few million small businesses. You've just sketched the Phillips curve on a napkin. Tight job market? Pay and prices climb. Soft job market? They sag. That's the pitch. The catch comes later.
What Is the Phillips Curve?
Formally, the Phillips curve is a model. It links inflation to slack in the job market, with unemployment standing in for slack. The short-run logic is simple. Strong demand, so firms hire. Jobs get easier to find. Unemployment slips. Bosses pay more to keep people, and charge more to cover it. Weak demand? Everything runs the other way.
Here's the part you should hear early. It isn't a law of nature. Plenty of periods ignore it. Economists have argued about the Phillips curve for decades, partly because the link keeps drifting. Expectations and the long run come further down.
Open a demo account and watch how markets react to jobs and inflation releases.
Try Demo AccountTextbook lines are neat. Release days are loud.
Jobs numbers and inflation prints drop at fixed times. Prices can lurch within seconds. Sometimes they follow the textbook line, sometimes they don't, because traders react to the surprise, not the number itself. If you've never watched a release live, a demo account lets you try it with virtual funds. It's easier to learn the gap between theory and tape when nothing real is riding on it.
Run some demo trading around the next payrolls day and watch the tidy diagram fall apart.
How the Phillips Curve Works
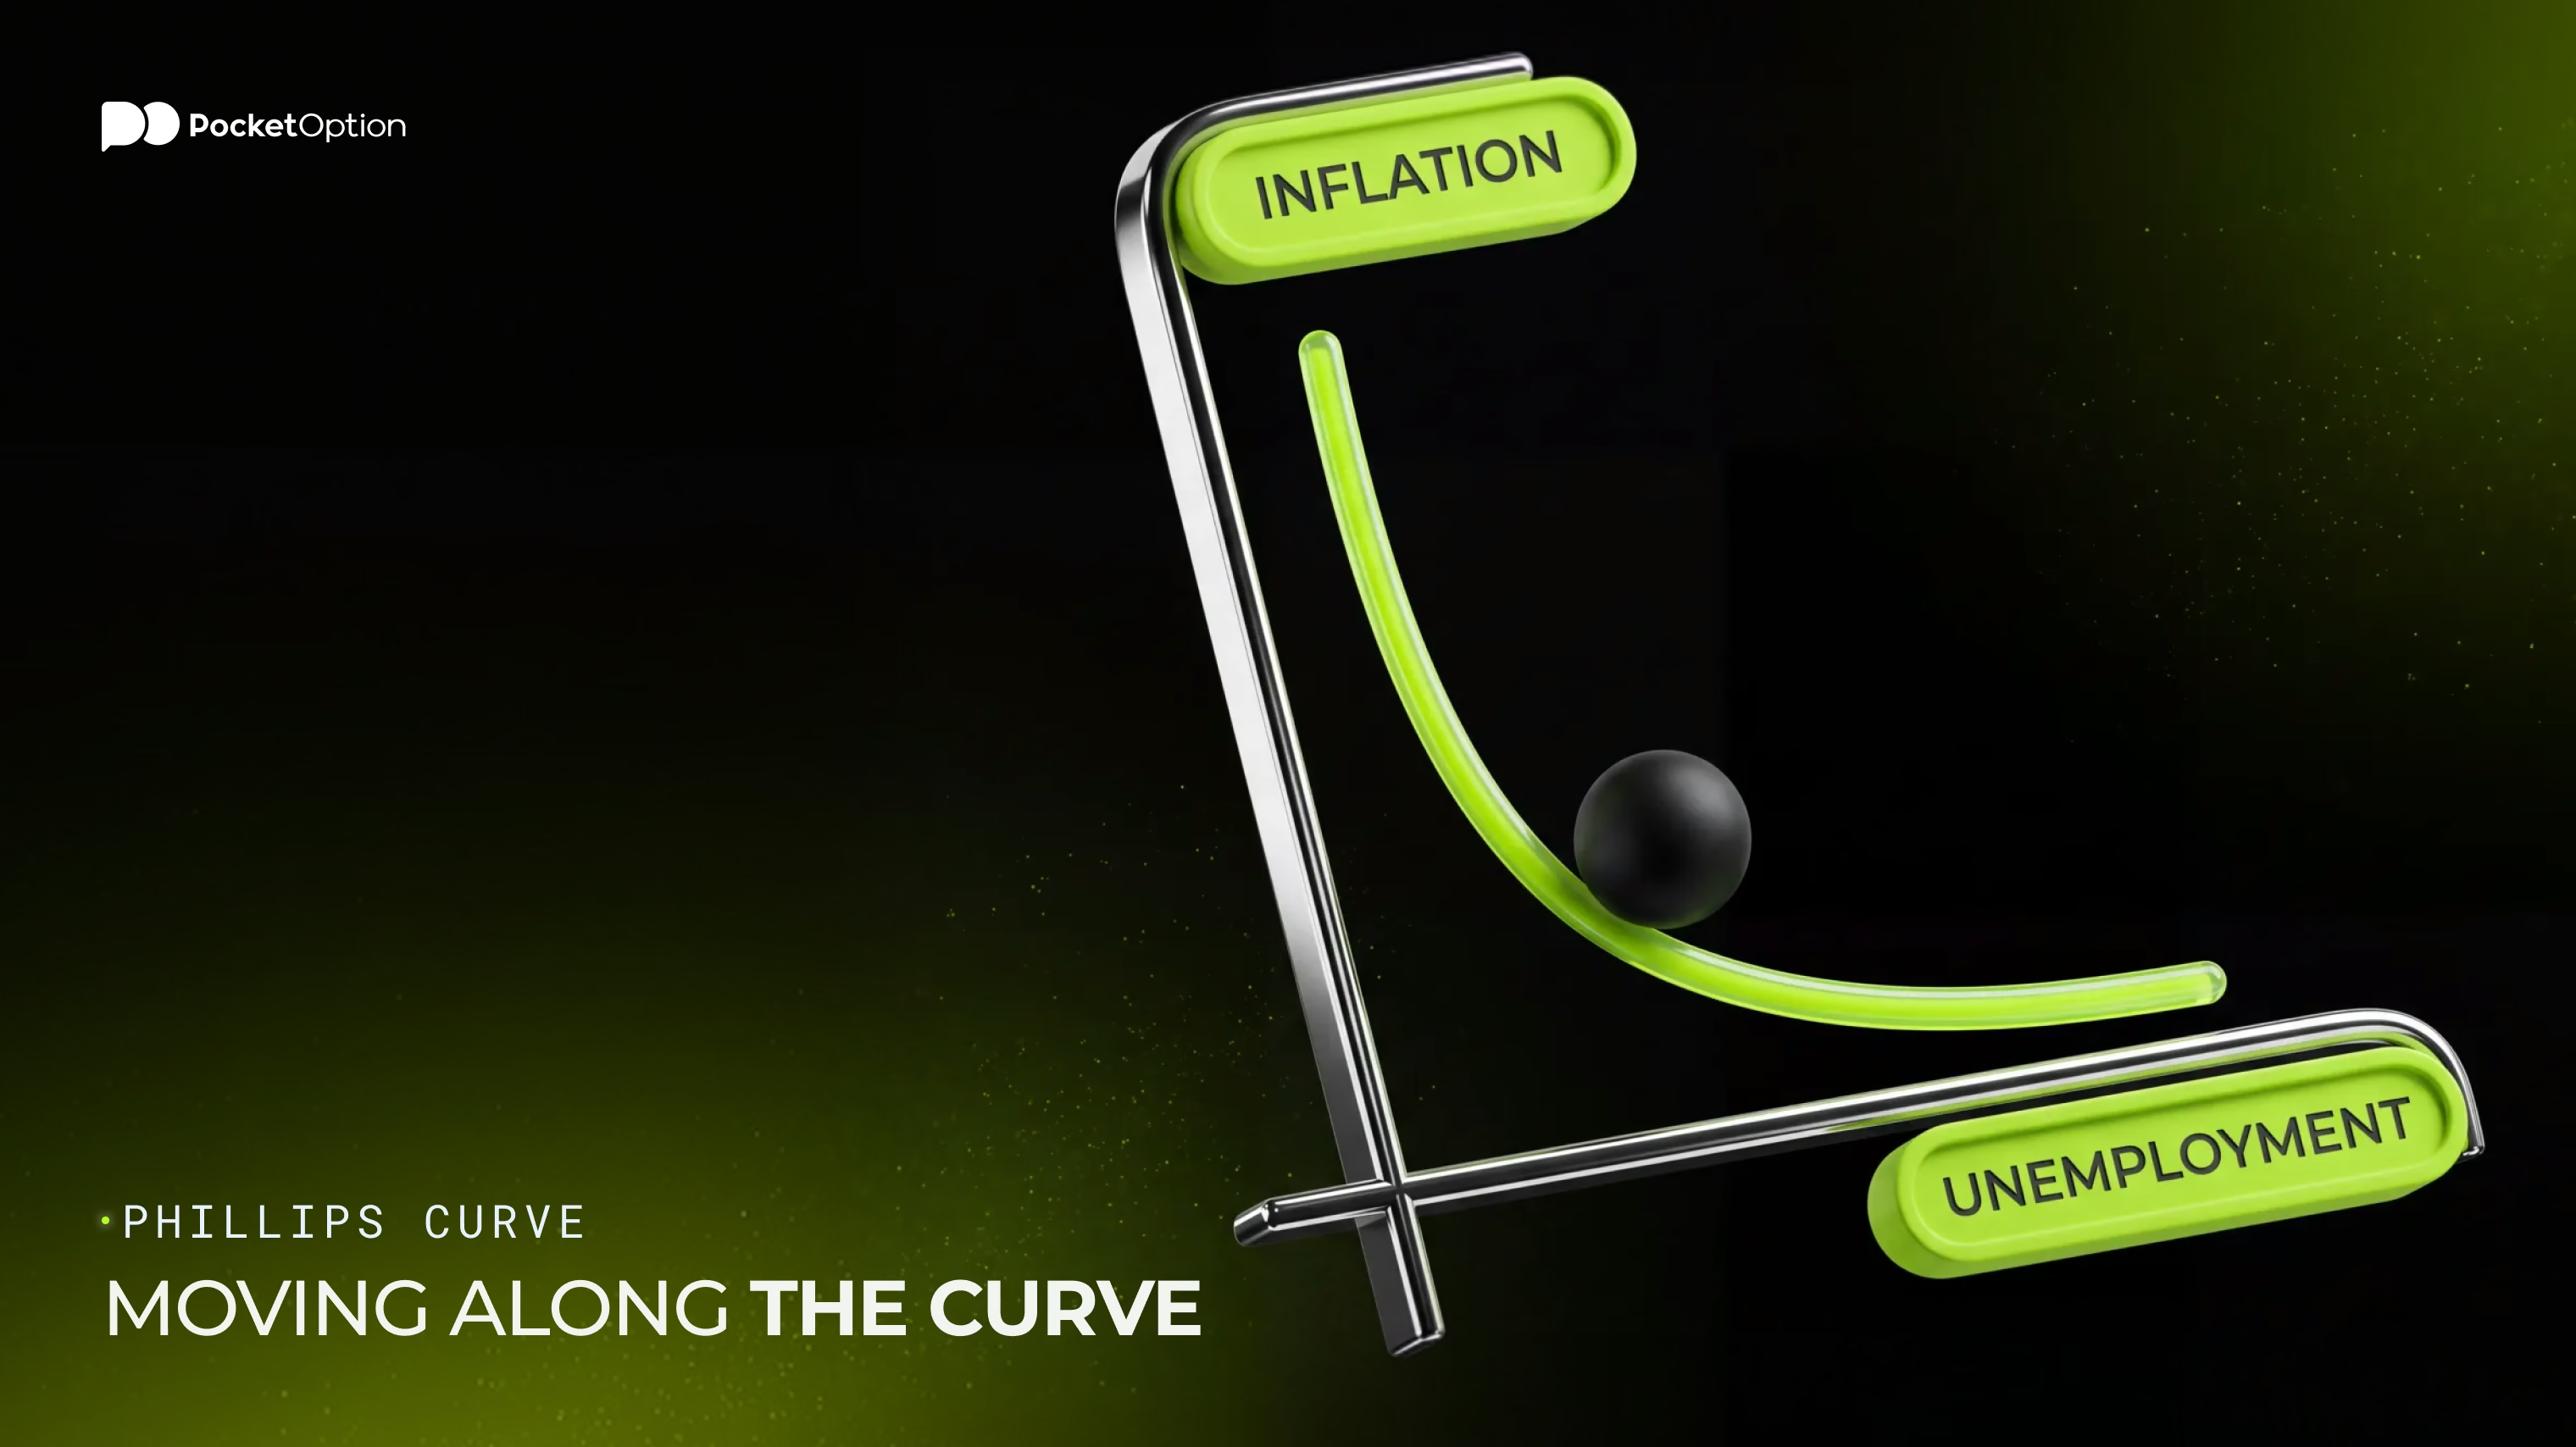
Ask any econ student what is the Phillips curve. You'll get the same sketch every time: a line sloping downward. Unemployment runs along the bottom. Inflation goes up the side. Slide left, and unemployment falls while inflation rises. Slide right, and the reverse happens. Everything else held constant (which, spoiler, it never is).
Want that chart on your own screen? The pocket option tutorial shows where the tools live and how to set them up.
Moving along the line is the easy part. Demand picks up. The economy slides up and to the left: fewer people unemployed, a bit more inflation. Demand cools, and it slides back. That only works if expectations and supply conditions sit still. So it's a rough map of one trade-off. It's not a formula for next quarter's CPI.
So what is the Phillips curve actually telling you? A direction. Not a number. Heat up demand and pressure builds somewhere between jobs and prices. How much, and how fast? The model can't promise that.
Inflation and Unemployment on the Curve
In Phillips curve economics, each dot on the chart is one period. A year, a quarter, even a month. Dots in the top left mean low unemployment and high inflation. Dots toward the bottom right mean the opposite. That's the textbook picture for the short run. Real data is rude about it. Plot a few decades of points and you won't get a tidy line. You'll get a cloud. Each dot had its own cause: a boom, an oil spike, a policy shift.
Short-Run vs Long-Run Phillips Curve
Time changes the answer. In the short run, the line slopes down. Policymakers can slide along it for a while. In the standard long-run view, with expectations built in, the line stands straight up. Why? Because people adjust. Once they do, there's no lasting trade-off. You can't buy permanently lower unemployment with permanently higher inflation. You just get the inflation. Unemployment drifts back to wherever the economy's structure puts it.
Feature | Short-Run | Long-Run |
|---|---|---|
Shape | Usually downward sloping | Vertical in the standard framework |
Role of inflation expectations | Held roughly fixed | Fully adjust |
Relationship between inflation and unemployment | Inverse trade-off | No lasting trade-off |
Adjustment over time | Moves along the line when demand changes | Line holds once expectations catch up |
Main interpretation | Demand shifts can swap one for the other for a while | Structure, not inflation, sets unemployment over time |
Treat the table as a map, not a rulebook. Economies don't wear labels. And long run means after expectations catch up, not next year.
Why Inflation Expectations Shift the Phillips Curve
Expectations are the hinge. Say workers start expecting 4% inflation instead of 2%. They ask for bigger raises to stay even. Firms see it coming and nudge prices up sooner. Same unemployment as last year. Hotter inflation. Nobody slid along the line there. The whole short-run line moved up.
The reverse works too. When people trust that prices will stay roughly steady, economists say expectations are anchored, and the relationship usually behaves better. Lose that trust and the line can jump. Milton Friedman and Edmund Phelps made this argument in the late 1960s. The 1970s put their idea through a brutal test.
How Supply Shocks Affect the Phillips Curve
Now throw in a shock from the supply side. Coffee beans double in price. Or energy costs spike, pick your poison. Prices rise even though demand is soft. Firms cut staff. Unemployment climbs, and inflation climbs too. Both numbers get worse at once. A downward-sloping line says that shouldn't happen. The 1970s oil shocks were the painful real-life version.
So a shock shifts the short-run line. It doesn't slide along it. That's why unemployment alone can't explain inflation.
Why the Phillips Curve Can Become Flatter
Flatter just means a weaker response. Slack changes. Inflation barely notices. Why? Economists have a few suspects and no verdict. Better-anchored expectations. Structural shifts in labor and product markets. Globalization. Changes in how firms set wages and prices. The slope isn't fixed, either. It can differ between eras and between countries.
The Federal Reserve has noted that over recent decades, inflation became less responsive to resource slack. In chart terms, the short-run line looked flatter. Looked. Measurement is hard, and the argument isn't over.
Limits of the Phillips Curve
A model this simple was always going to leak. Scatter inflation against unemployment over a long stretch and you rarely get one clean line. So here's why the model may not fit the data perfectly:
Changing inflation expectations
Supply shocks
Unstable estimates of labor-market slack and NAIRU
Structural changes
Different inflation measures
Changing slope over time
Lags between economic activity and inflation
Is the model broken, then? Not by itself. A relationship that weakens in some periods still says something about demand pressure. Just don't treat it like a law.
How Traders Can Interpret the Phillips Curve
Where does this leave you as a trader? With a way to organize your thinking. Not a signal. It helps you sort inflation pressure into labor slack, expectations and shocks. It won't hand you a forecast for inflation, policy rates, bond yields, currencies or stocks.
Reading a release? Put several pieces on the table together. Unemployment and other labor indicators. Wage growth. Inflation expectations. Supply shocks. The broader demand picture. Then ask what each one adds. A rule like low unemployment means buy the currency ignores nearly all of it.
Risk Disclaimer: Trading involves significant risk of capital loss. This article is for educational purposes only and does not constitute financial advice. Always conduct independent research and consider your risk tolerance before making any trading decisions.
FAQ
See more:Education