PMI and ISM: Why Survey-Based Indicators Often Lead Hard Economic Data
On 21 November 2025, S&P Global released its purchasing managers' survey covering November 2025. There were still nine days left until the end of that month. This is why people follow such surveys in advance. The official statistics for November became available in mid-December, while the GDP figure covering it was released in late January. This post will explain what the surveys cover, what the 50-level means (or does not), and how to interpret a survey release without taking it too seriously.

What Is the PMI Index?
So what is PMI index in simple terms? It is a monthly survey of purchasing managers at real firms, asking whether certain conditions have improved, worsened or remained unchanged compared with the previous month. These are reports about changes, not views or projections. Nobody asks what will happen next. Respondents report whether their own new orders, output, employment and supplier delivery times changed in the last month.
The PMI index meaning is derived from its arithmetic. It is a diffusion index and ISM spells it out: the percent of positive answers plus half of the no-change responses. The index thus tells us how widely a certain change was felt, but not how big it was.
ISM vs S&P Global PMI
Different Providers and Survey Panels
There are two organizations that publish these surveys for the United States. The Institute for Supply Management, usually called ISM, maintains the long-running US survey. S&P Global has its own panel and releases similar indices for dozens of countries. Different panels, different weighting and different survey questions may make two indicators point in opposite directions in one month. Neither of them is wrong in such cases.
Manufacturing, Services and Composite Readings
Both organizations provide the data for certain sectors and the sector makes a lot of difference.
Manufacturing. The longest-standing series and probably the most famous, though manufacturing contributes a relatively small share to the output in most developed economies.
Services PMI. The survey of the much bigger service sector, therefore it is more informative about the overall state of affairs despite attracting less attention.
Composite PMI. A weighted mix of the above two and meant to be a single best survey-based indicator of private-sector activity.
In case you choose only one, the composite is a better option.
Flash vs Final PMI
S&P Global releases the information twice per month. Flash pmi is published first, using about 80% to 90% of the eventual survey responses. The November 2025 flash index was based on about 85% of the total responses, collected during the 12th to 20th days of the month.
The final pmi is published in the beginning of the following month once the rest of responses come in. The two may differ, and this is typically a small difference, but the flash one, coming first, drives the markets.
Currency pairs and indices on one platform
Get StartedWhat Does the 50-Point Threshold Mean?
Expansion, Contraction and No Change
Fifty is the neutral line, and there is a good reason behind it. The arithmetic of the PMI is simple. If every firm said that everything remained unchanged, the result would be 50. Above 50 means that more firms reported improvements than deterioration, thus expansion in the surveyed sector. Below 50 is the opposite situation. Do remember the reference. It is the change since the previous month, not the absolute level of economic activity.
Index Levels vs Changes in Growth Momentum
The level of 52 does not mean 2% growth. The PMI is not a growth rate and carries no percentage meaning. It means that there were more firms reporting changes for the better than deteriorations, which could happen both in a good and poor month.
Often, the change is more important than the absolute value of the index. The drop from 56 to 52 still points at expansion, but expansion that is becoming less widespread, and it may be more important for the markets than a standalone 52 level above 50.
Why Sector Contraction Does Not Automatically Mean Recession
A manufacturing PMI reading of 47 means that the manufacturing sector is contracting. It does not mean recession in itself, and ISM explicitly states this in its releases. For the whole economy, the cutoff is not 50 but 42.3: a manufacturing PMI above 42.3%, sustained over a period of time, means that the overall economy or GDP is generally expanding, while below 42.3% points at a general decline.
Therefore, according to ISM, the levels between 42.3 and 50 mean contraction of the manufacturing sector within a growing economy as a whole. And this is why one sub-50 reading is not a recession signal.
Why PMI Often Arrives Before Hard Economic Data
Survey Collection and Publication Timing
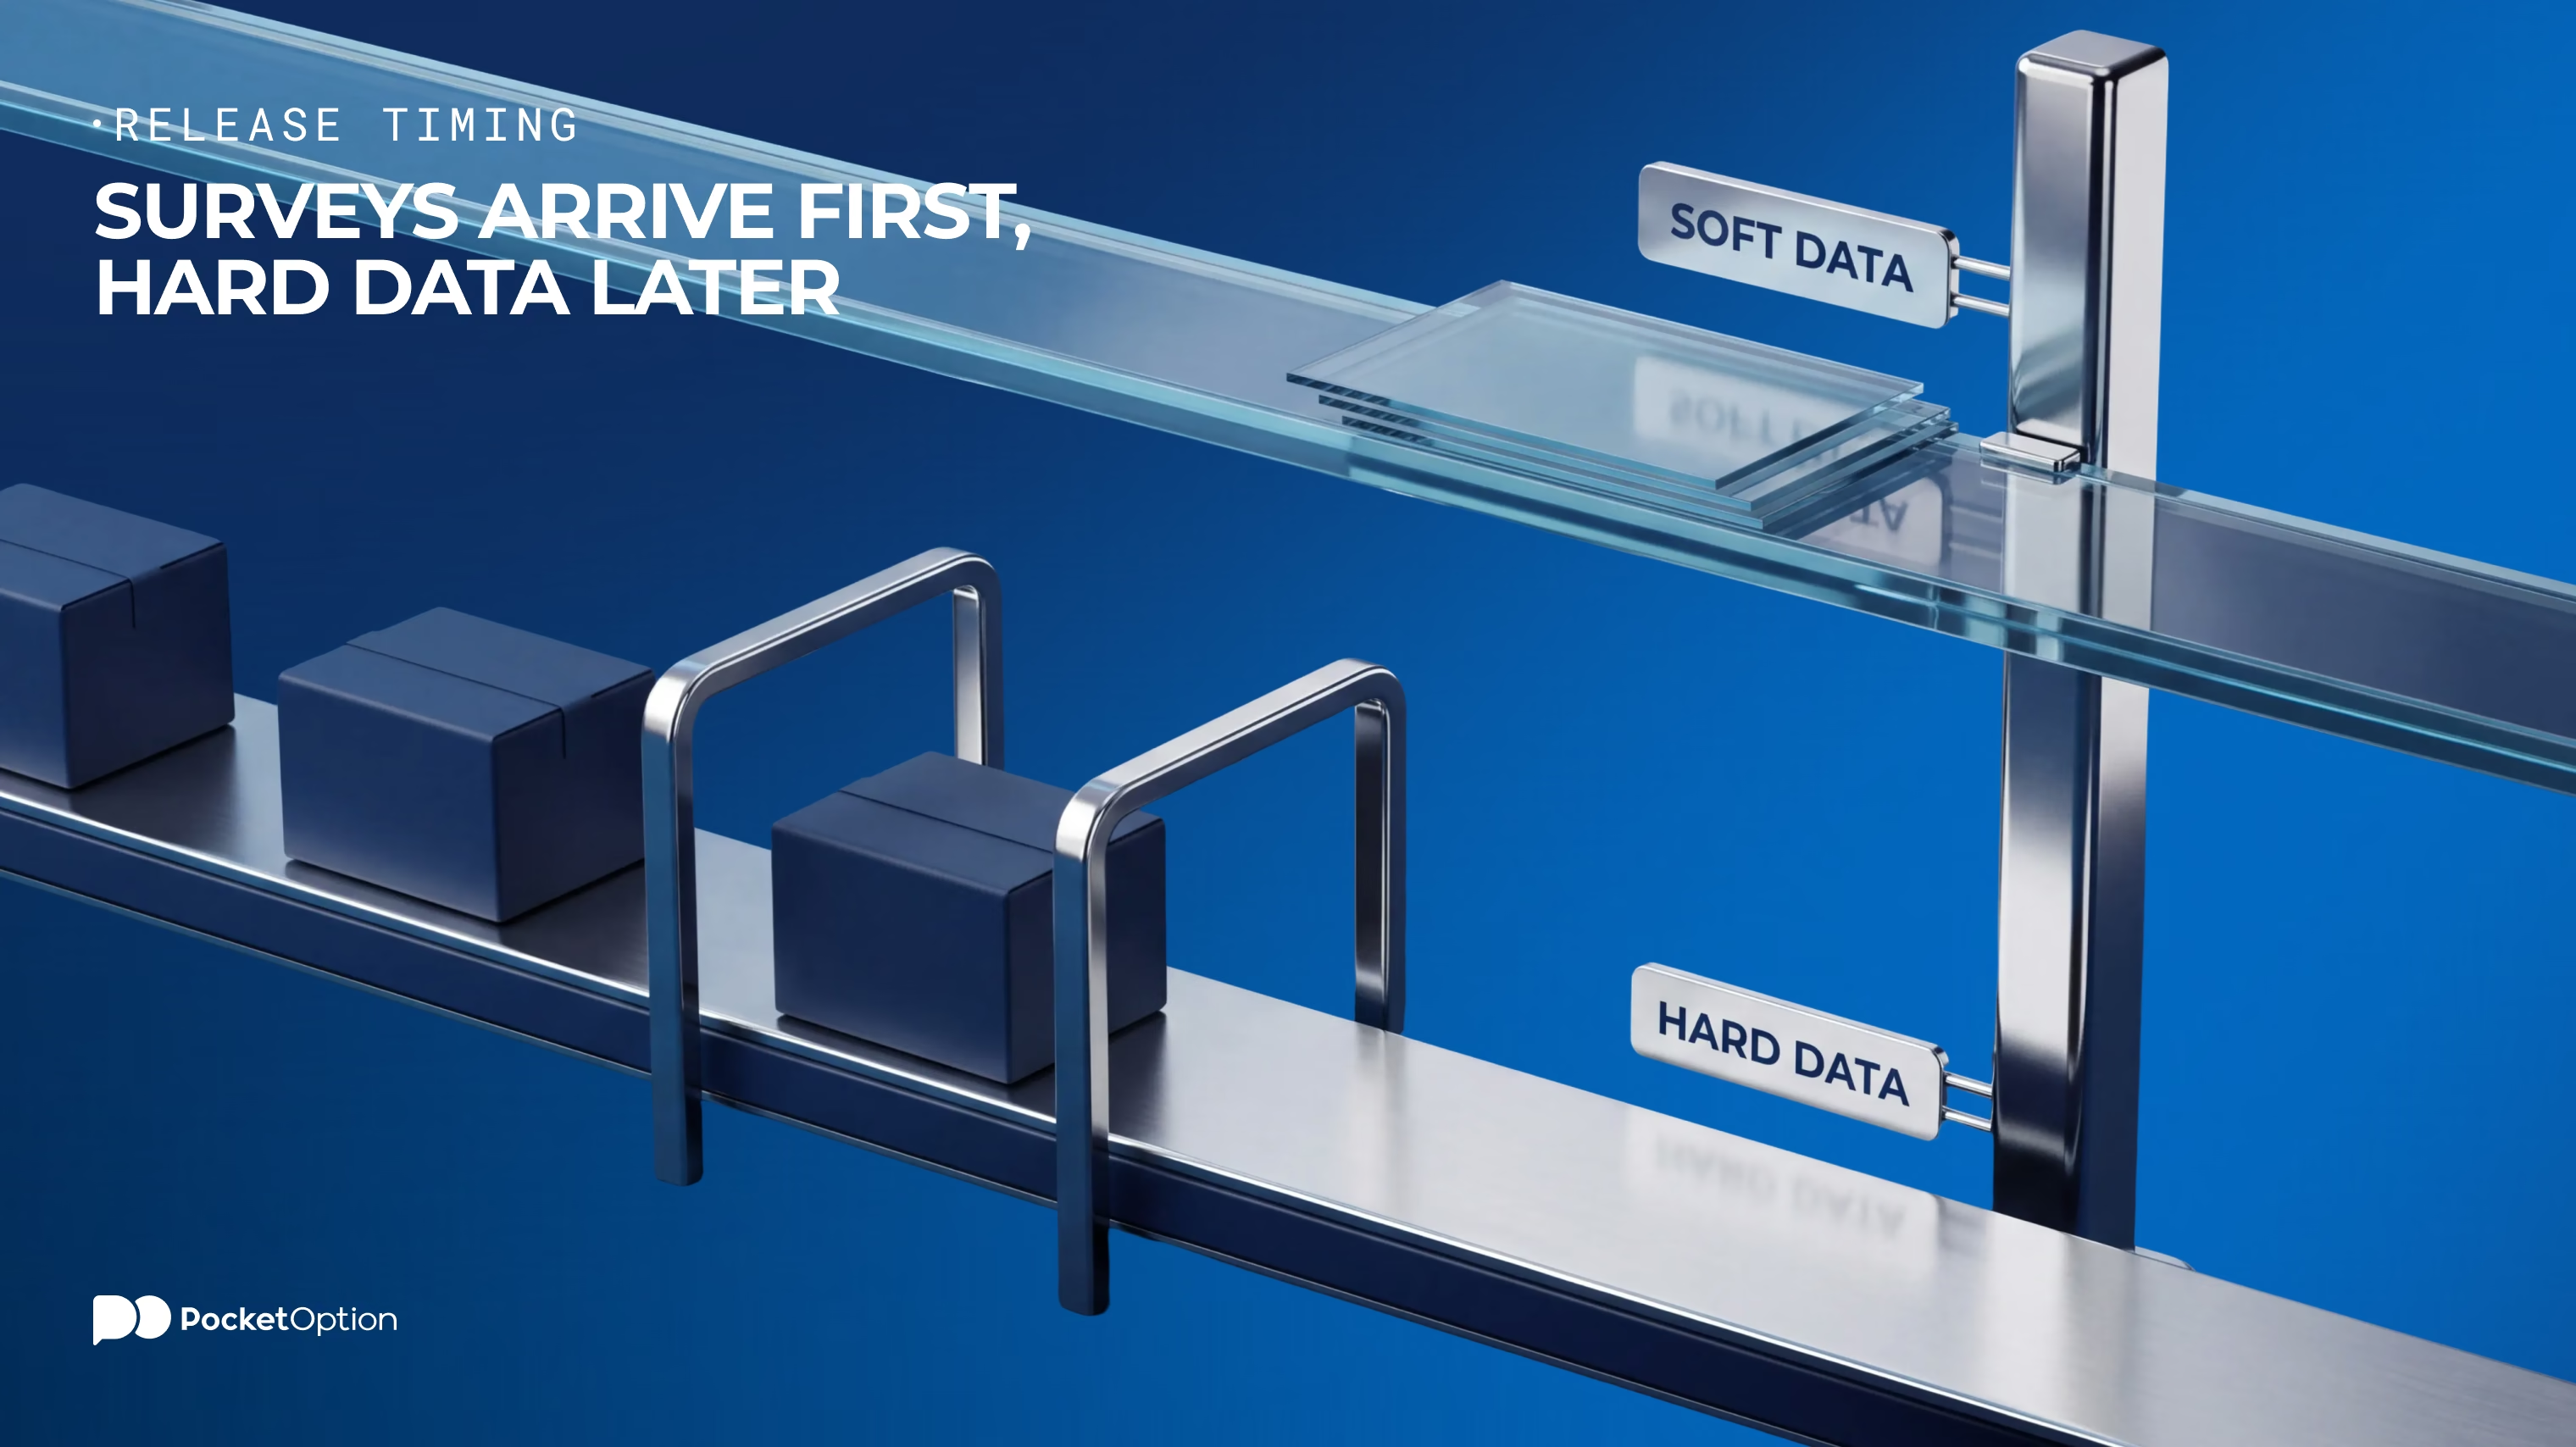
The time advantage is practical rather than a clever one. A survey asks a fixed panel a few questions and counts the answers, while hard data requires collection, validation and reconciliation of actual output data of a much broader pool of respondents. This is the practical distinction of soft data vs hard data. Soft data are reported and counted quickly, hard data measure what actually happened and take time to collect.
PMI vs Retail Sales, Industrial Production and GDP
Let us take November as the reference month and map it on the calendar. The flash version lands around 21 November. ISM releases the manufacturing PMI on the first working day of December, and the services index on the third. The hard data, retail sales and industrial production for November, arrive in mid-December. GDP data for the quarter with November are published in late January. So, roughly two months separate the first signal from the official output figure for the same period.
Release Timing Comparison Table
Release | Reference period | Released | Coverage |
|---|---|---|---|
S&P Global flash PMI | Current month | Around the 21st of the same month | Survey, about 85% of responses |
ISM Manufacturing PMI | Previous month | First business day of the next month | Survey, manufacturing panel |
S&P Global final PMI | Previous month | First business days of the next month | Survey, all responses |
ISM Services PMI | Previous month | Third business day of the next month | Survey, services panel |
Retail sales | Previous month | Around mid-month, next month | Hard data, retail receipts |
Industrial production | Previous month | Around mid-month, next month | Hard data, physical output |
GDP, advance estimate | Previous quarter | About a month after quarter end | Hard data, whole economy |
ISM released its September 2026 manufacturing index on October 1 and services on October 5, both at 10:00 am New York time. A cautionary note on the idea of leading, though. The fact that an indicator appears earlier does not mean that it forecasts anything. The surveys report about the month that is largely gone and are simply quicker in doing so, and no streak of positive surveys guarantees anything about future activity.
When PMI and Hard Data Tell Different Stories
And they do diverge regularly, and this is informative rather than a sign that something goes wrong. Surveys measure the number of respondents saying that something happened, while hard data count the volume, so even a few large players can cause an output change without changing the survey index. Sentiment also affects the way managers describe a close situation.
Take any disagreement as a question rather than as an answer. When surveys are weakening and output data are holding steady, waiting for the next month is the wisest thing to do. During turbulent times, movements into safe haven assets may tell more than either data series does.
How to Check the Current PMI Index
To find the current pmi index, look at the source instead of a summary.
ISM publishes its reports at ismworld.org, with a forward calendar of release dates listed there.
S&P Global publishes its national and flash PMIs at its PMI website, with methodology description added there.
Economic calendars list release times for various countries and the consensus estimates beside the previous value.
Remember to check two additional figures beside the headline. The previous reading gives you the trend direction, and the consensus forecast matters because the market reacts to the gap between forecast and actual release, not to the level.
Why Currencies and Indices React to PMI Releases
Markets price the expectations, so the release moves markets when it differs from the expectations. The typical chain runs through monetary policy. Survey data hinting at a slowdown shift the interest rate expectations, and this shifts currencies and equities. And this is how a factory survey may move a currency pair.
Do not try to transform this into a rule. There is no reliable rule that a high reading should boost a currency. The reaction depends on the current pricing and on traders' expectations of central bank actions, and the same readings may drive the currency pair up and down in different months. Using any indicator as an input rather than a command is the main idea of this article on trade signals and how to use them.
A Hypothetical PMI Release and Market Reaction
Here is a hypothetical example, just a plausible rather than an actual one. Let us say that the consensus expects an ISM Manufacturing PMI reading of 51.5 and it came at 48.9. The result missed the consensus expectations and crossed the expansion-contraction border.
A plausible scenario is a quick re-pricing in the first minutes, followed by a slower parsing of the sub-indexes. New orders and employment usually attract more attention than the headline because these numbers talk about the months ahead. If the new orders sub-index held up while the headline was falling, the initial move may reverse partly. But you will not be able to predict the direction from the number.
A demo balance up to $50,000
Try DemoObserving PMI and ISM Reactions on a Pocket Option Demo Account
The valuable part here is observing rather than predicting.
Choose one release and one instrument. An ISM date and one currency pair or index are enough.
Note the consensus and the previous reading in advance, and what you expect to happen.
Watch the first fifteen minutes without opening a trade. Note the initial move, any reversal and how wide the spread becomes.
Compare the results with your expectation, and repeat for several months before making any conclusions.
Remember what you learned from the process. It helps to get used to the way releases behave, which is useful. It does not prove the success of the strategy, and demo results are not evidence of future profitability, since nothing is at stake and demo execution is different from live. How to integrate this routine into a strategy is covered in the guide to building a realistic trading plan.
Conclusion
Read the surveys as early news about a month that is gone, not the forecast of the coming one.
This perspective organizes the rest. The flash estimate comes before the end of the reference month, which is the time advantage over waiting until mid-December for retail sales. The 50-line number means no change from the previous month and nothing more, which is why the ISM's economy-wide threshold stands at 42.3. The releases move markets through the gap between expectations and the actual values, and this is why no rigid rule about strong readings lifting the currency pair survives in reality.
Disclaimer: This article is provided for informational and educational purposes only and does not constitute investment advice. Economic indicators describe the past periods and do not forecast future activity or price movements, and release times and methods may change. Trading involves a significant risk of capital loss and may not be suitable for every investor. Also, results from a demo account do not indicate future results in live trading.
See more:Education