Sortino Ratio: How It Differs from Sharpe and Why Downside Risk Matters
So, what is the Sortino ratio? It’s a useful metric in trading and investing that calculates your returns, per unit of downside deviation. This is a risk-adjusted return that’s meant to ‘penalize’ the bad periods, where returns didn’t quite hit the benchmark. Meanwhile, good periods (with only upside volatility) get through fine, which is the entire point.

What Is the Sortino Ratio: Definition
The Sortino ratio definition is that it’s the return of a portfolio or a strategy above some target, split by the downside deviation that it had to sit through (to get there). Ratio is named after Frank A. Sortino, a famous finance researcher. At bottom it's a tweak to an older idea rather than a brand new one, but it works quite well regardless.
That older idea was the ‘Sharpe ratio’, which does the same division but puts total volatility underneath, so that every swing up and every swing down are counted the same way. We have a longer walk-through of how the Sharpe ratio works on our blog for anyone wanting to delve deeper into that.
What is a Sortino ratio actually telling us, then? About how much return came in, for each unit of the harmful sort of volatility (the one that can drag an account below where it was wanting to end up). In Sortino, a reading of 2 means that there were two units of excess return per unit of downside wobble, and a reading of 0.5 means half a unit.
Anybody searching what is Sortino ratio is usually after the one-line answer, but the Sortino ratio meaning does not squeeze into one line. It’s a return figure that is complex, and aimed at not punishing a good strategy for going up too fast. Losses get counted, but gains, however big, are not included as the volatility factor.
The Sortino Ratio Formula
Formula itself is rather short, and it fits in this one line:
Sortino ratio = (Rp - T) / DD
Rp here is the average return over whatever stretch is being checked (usually monthly or daily).
T, the target. Sometimes called the minimum acceptable return (MAR). The one we were aiming for. Therefore, Rp - T equates to excess returns you got, over a specific period.
DD stands for downside deviation, and only the returns that fell short of T ever make it into that one.
Top half of the fraction is the same excess return that Sharpe uses whenever T gets set to the risk-free rate. Bottom half is where the whole trick is at: only downside deviation is analyzed here.
How Downside Deviation Is Calculated
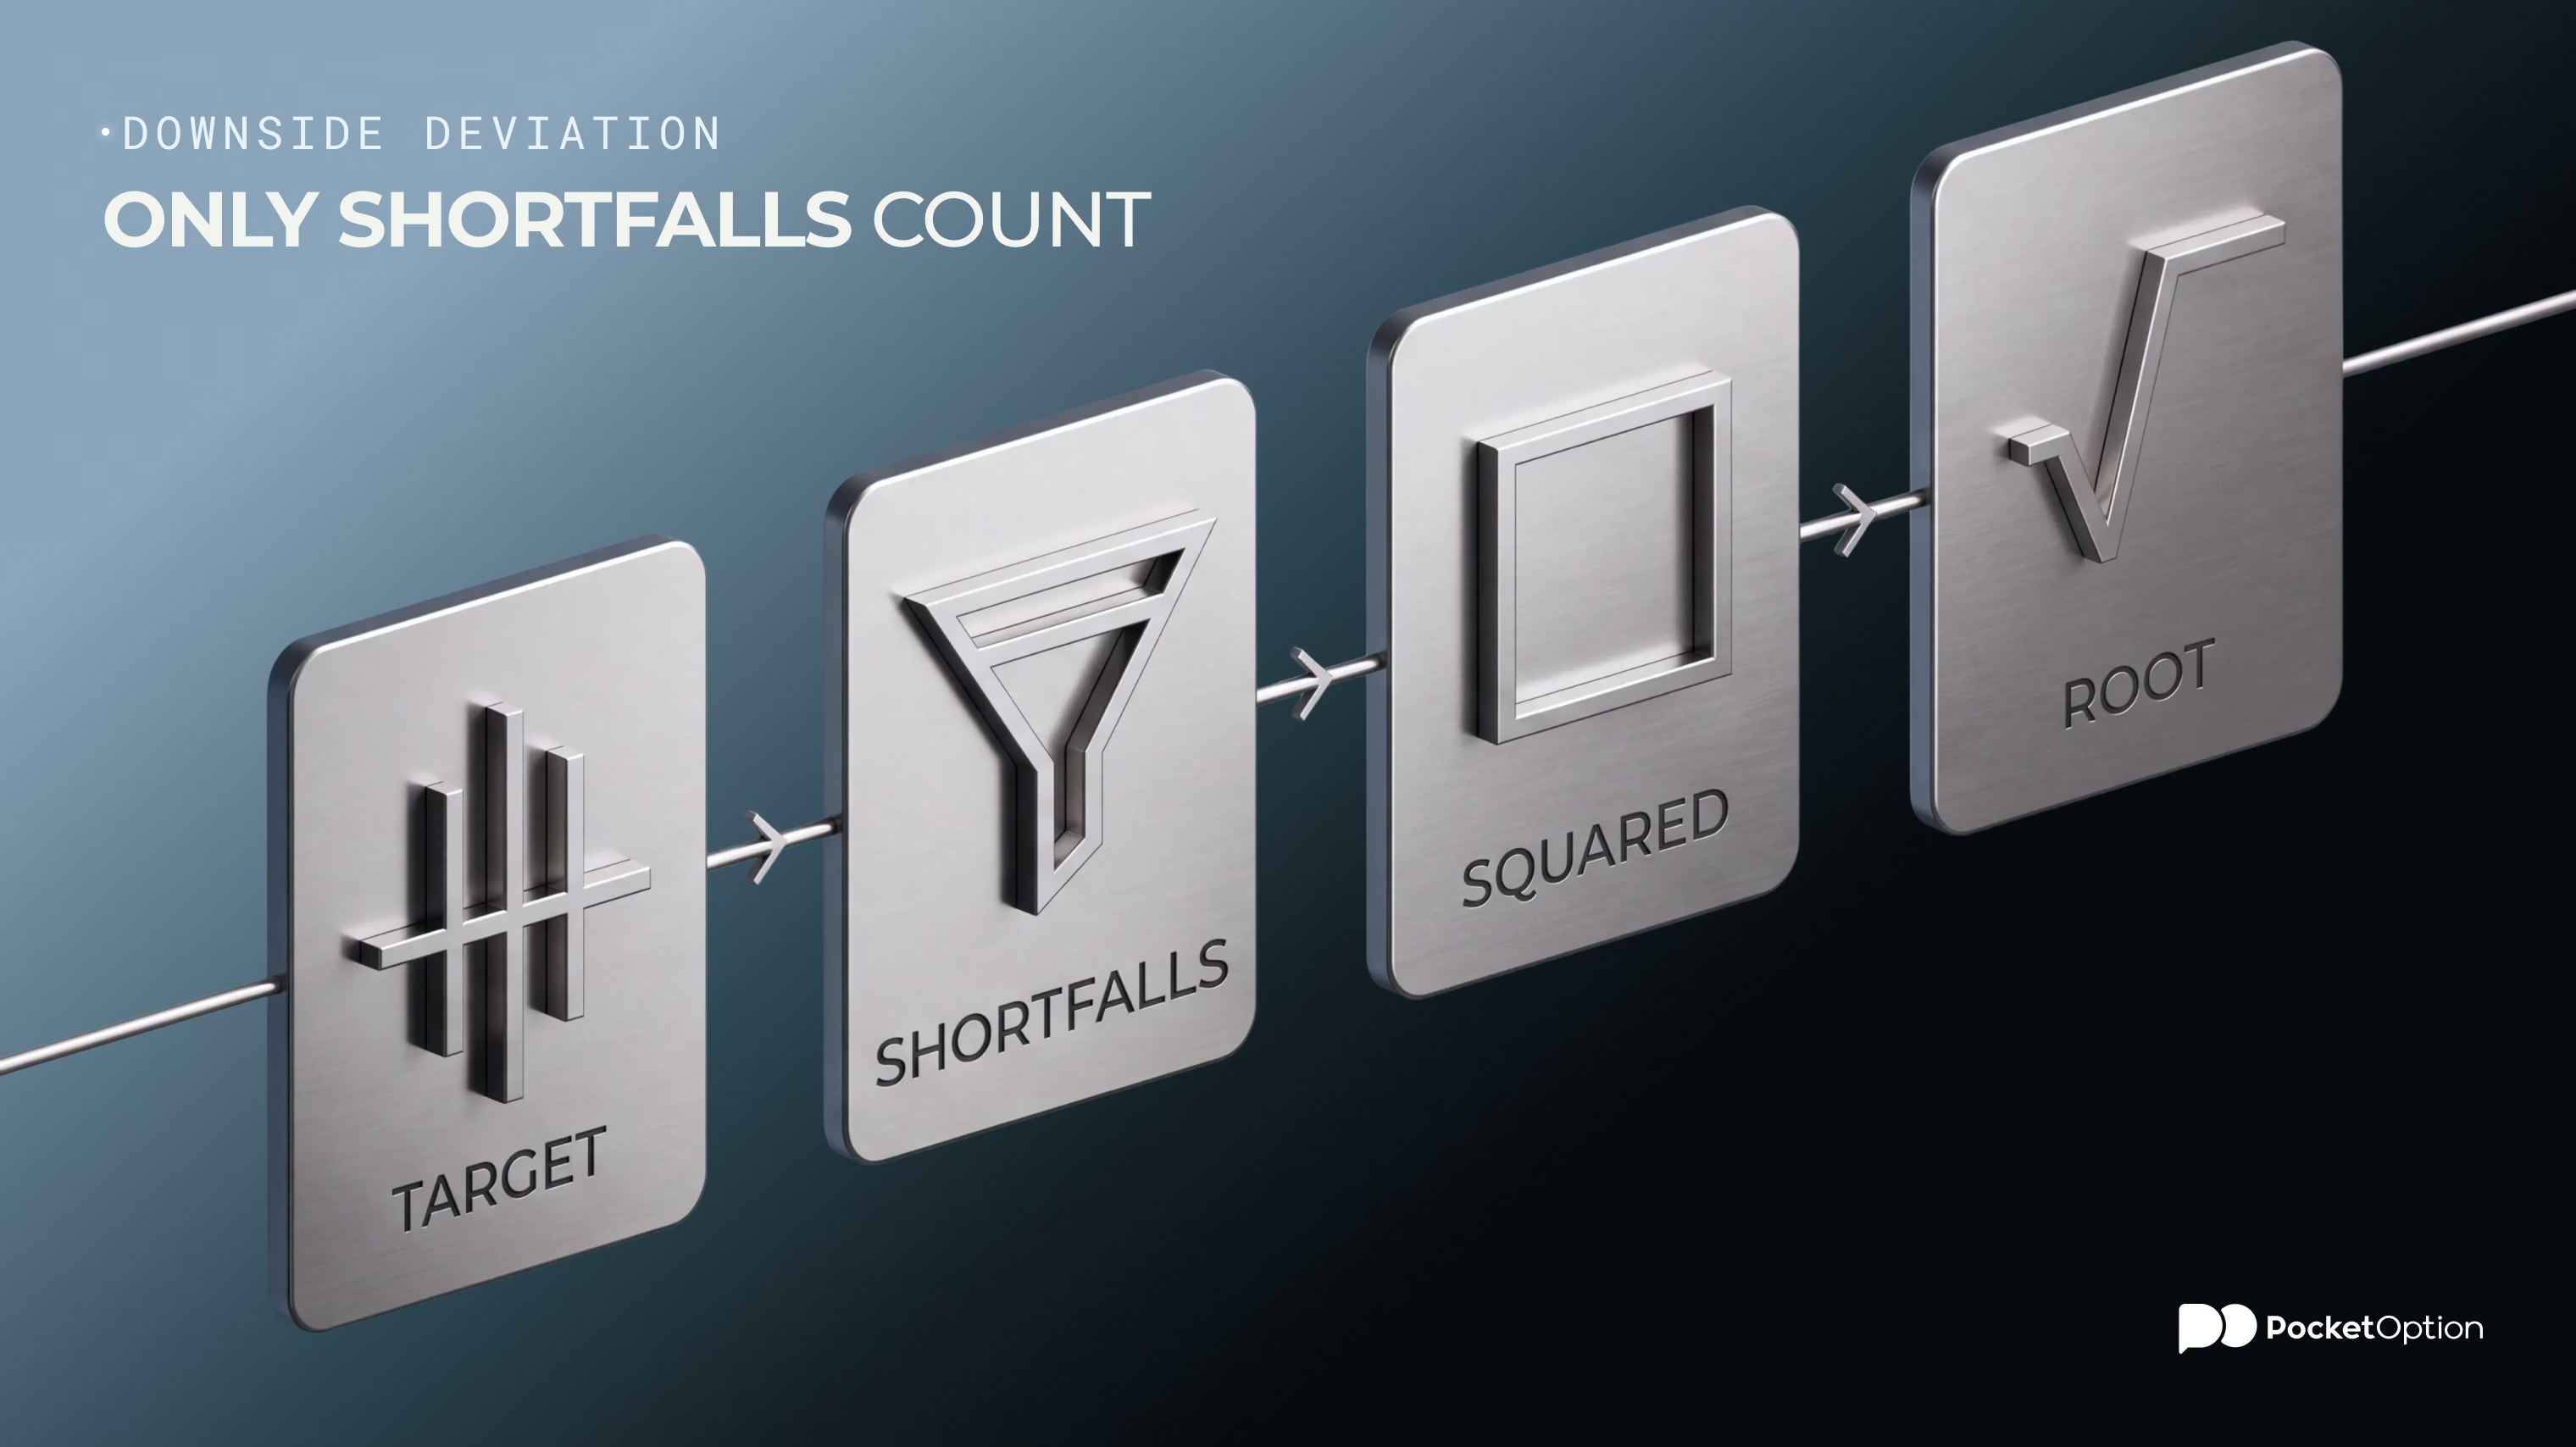
Downside deviation is where the difference is. If standard deviation just takes every return, and sees how far they are from the average (and squares the lot), then downside deviation (DD) shows only the downside portion of it. If there was an upside, it is simply not taken into account. Returns that beat T are set to zero. Therefore:
DD = √( Σ min(0, Ri - T)² / N )
Every period of the return (Ri) has T taken off it. If what's left is positive it becomes zero, and is not taken into account. If it's negative, it stays. Those leftover shortfalls get squared, summed up, split by N, and then square-rooted. This ends up being the downside deviation, and its the magic of what is the Sortino ratio.
Step-by-Step Calculation Example
Easiest way to see how to calculate Sortino ratio is on a small, made-up sample. We have the twelve monthly returns below, a target T of +0.3% a month (roughly +3.6% across a year). From this, even a phone calculator is enough to check the end ratio.
Month | Monthly return | Shortfall BELOW 0.3% target | Shortfall, squared |
|---|---|---|---|
January | 2.9% | 0.0 | 0.00 |
February | -1.3% | -1.6 | 2.56 |
March | 0.1% | -0.2 | 0.04 |
April | 4.5% | 0.0 | 0.00 |
May | -3.0% | -3.3 | 10.89 |
June | 1.6% | 0.0 | 0.00 |
July | 1.0% | 0.0 | 0.00 |
August | -0.7% | -1.0 | 1.00 |
September | 3.2% | 0.0 | 0.00 |
October | 2.1% | 0.0 | 0.00 |
November | -0.9% | -1.2 | 1.44 |
December | 2.5% | 0.0 | 0.00 |
Total: | 12.0% | 5 months were short | 15.93 |
We work out average returns first. The twelve months add up to 12.0%, so Rp in this case ends up being 1.0% a month.
Excess return: 1.0% less the 0.3% target leaves 0.7% of excess.
Shortfalls are seen after that. 5 months finished below 0.3%. Including March, by the way, even though it was up (just not up enough compared to our target).
Those five shortfalls get squared, and then added together, 2.56 + 0.04 + 10.89 + 1.00 + 1.44, which makes 15.93 figure at the end of the table.
If we split 15.93 by 12 months, it comes out as 1.3275. Square root of that is about 1.15%, and that's the downside deviation in our case. That is how much the downside was expected to be, in our period.
Monthly Sortino ratio, then, is 0.7 split by 1.15, so around 0.61.
For a yearly figure, this gets multiplied by the square root of 12 (~3.46), and so is around 2.1, a very different looking number from the monthly one.
If we split the sum by five rather than twelve (counting just the ‘bad’ months), the downside deviation would have come out near 1.78% and the yearly ratio close to 1.36, instead of 2.1. This is how the Sortino ratio is calculated sometimes, as well.
What Is a Good Sortino Ratio
What is a good Sortino ratio, then? Is our 2.1 target, which we reached in the previous section, good enough?
Well, no official scale exists. But the rough estimate is that:
Below 0: returns didn't even clear the target, so there's not much to rank really. Not great.
0 to 1, weak returns. There’s some excess in there, but it's smaller than the downside deviation that came along with it, so you, essentially, took more risk than it was worth, in all likelihood.
1 to 2 is average-to-decent. Many sound strategies end up in this band of Sortino ratio, for years.
2 to 3, good to very good. This was our returns in the previous example, and in this case there’s not much to complain about, really.
Above 3? Excellent on paper, but might need a double-check, especially over a short sample.
So what is considered a good Sortino ratio, then? Anything from about 2 upward can be considered one. And 1 to 2 are usually quite acceptable. People typing whats a good Sortino ratio into a search bar tend to expect one number back, but the bands move around, and deviate quite a bit. Also understand that a good Sortino ratio needs enough losing periods to be relevant. Our example, with five down months out of twelve, is already rather thin. Less periods would make it even thinner, and less reliable long-term.
Sortino vs Sharpe: Why Only Downside Risk Matters Here
If you try to run the same twelve months through Sharpe ratio, and see the yearly results, it would be 1.1 instead of 2.1 for Sortino. The change is that Sharpe's denominator takes in April's +4.5% and September's +3.2%, which were outsized returns, and instead treated them as risk, same as May’s -3.0%. Which might not necessarily have been the case. That's pretty much the answer to what is a Sortino ratio for: if you (or, more precisely, your strategy) think that outsized returns should not be counted as part of the risk.
By the way, value at risk (VaR) comes at similar worries, but from another perspective. It estimates how much a portfolio could lose over a given period. Sortino grades losses that have already occurred. Two are often employed side by side.
When the Sortino Ratio Is More Useful Than the Sharpe Ratio
Both ratios, of course, have their place. If, say, a strategy loses small and often, but sometimes catches a huge move upward, Sharpe will show it as a terrible choice. It will look worse than it (maybe) deserves. Rare big swings up will still count negatively. Meanwhile, steadily positive strategy, earning meager returns, will look rather good.
Sortino rates them slightly differently, and then the strategies are judged by their losses. If they were small all along, outsized returns look more favourably. This is a setting where a good Sortino ratio may outpace Sharpe’s metric, in showing accurate qualities of a strategy. But, obviously, enough months of returns should be measured, and quite precisely, for this. For example, trade history on Pocket Option can serve as the raw data, taken month by month and kept thereafter. This is why Pocket Option logs your results, good or bad. So you could properly analyze them later on.
Every trade becomes a data point.
Get StartedLimitations of the Sortino Ratio
The biggest is that this ratio is only as good as its count of bad periods. If there’s not enough bad periods on the record, it’s not quite as accurate or decisive. If you have just 1-2 bad periods, employing Sortino ratio might not be the wisest choice. If there were no negative returns on the record, ratio outright goes to infinity, and becomes rather useless.
Half of answering what is the Sortino ratio is knowing these edge cases, where it stops being useful. Also understand that it doesn’t count drawdown depth, the thing a real person actually feels. If there were four negative months in a row, even if all the rest were quite positive, the trader or investor might feel like the strategy is terrible, as they have to sit through large negative stretches. But to Sortino, this doesn’t matter at all, how the ‘winning’ and ‘losing’ periods were spread.
Scale is another sort of blind spot. Ratio doesn’t show how big swings are compared to what was traded. If the assets are of a very different sizes and prices, often coefficient of variation can do the comparison job better than Sortino. It achieves that by splitting standard deviation by the mean.
Conclusion
Here’s the Sortino ratio meaning squeezed into one sentence: it’s risk-adjusted returns, counted only through negative volatility (downside risk). If used correctly, it can be a fair way of grading how well returns actually paid for their losses. But picked loosely, without enough data to support it, this ratio can just show a flattering sum, without much meaning behind it.
Practice first, with virtual funds.
Try DemoDisclaimer: Trading involves risks of capital losses and may not be suitable for all investors. Past performances do not guarantee future results.
See more:Education