How to Read Overbought and Oversold Signals With DeMarker Indicator
DeMarker compares price highs and lows to judge overbought and oversold conditions. A practical guide to the formula, the 0.3 and 0.7 levels, divergence and the cases where its signals need a second check.

Price tags a fresh high, you glance at the oscillator, and it reads 0.82. Overbought? Maybe. Or maybe the trend is only getting started. That tension is what DeMarker is about, and reading it well is mostly a matter of context. Below: how DeM is built, what 0.3 and 0.7 really mean, how divergence works and where the signals fail.
What Makes the DeMarker Indicator Different?
The DeMarker indicator, or DeM, is an oscillator created by Thomas DeMark to judge changes in price extremes. It asks a narrow question: did the market push to a new high or a new low compared with the previous period, and how hard? The output sits between 0 and 1, and that range is where the overbought and oversold readings come from.
Here is the difference that matters. Many oscillators lean mostly on closing prices. DeM works from highs and lows instead, comparing the current period with the previous one. A bar can close flat and still push the high up. DeM notices that. A closing-price oscillator may not.
I do not read DeM as a signal machine. I read it as a gauge of how one-sided recent extremes have been.
A gauge is easier to read once you have watched it move. Before trusting any demarker indicator reading, a few sessions on a live chart with virtual funds help.
Open a free demo account and study how real price highs and lows develop, using virtual funds.
Try Demo AccountOpen a chart, pick one instrument and mark every new high and low for twenty minutes. Count how often price pushes past the previous extreme and how often the push fails. That count is the raw material the demarker indicator turns into a single number. A demo account runs on virtual funds, so the exercise costs nothing and no capital is at risk.
Quickest start: demo trading. Virtual funds, no deposit needed.
How DeMarker Turns Price Highs and Lows Into a Reading
Charts live inside your account, so start from the Pocket Option login page if you want to follow along. The demarker indicator formula itself is short: DeM = SMA(DeMax, N) / (SMA(DeMax, N) + SMA(DeMin, N)).
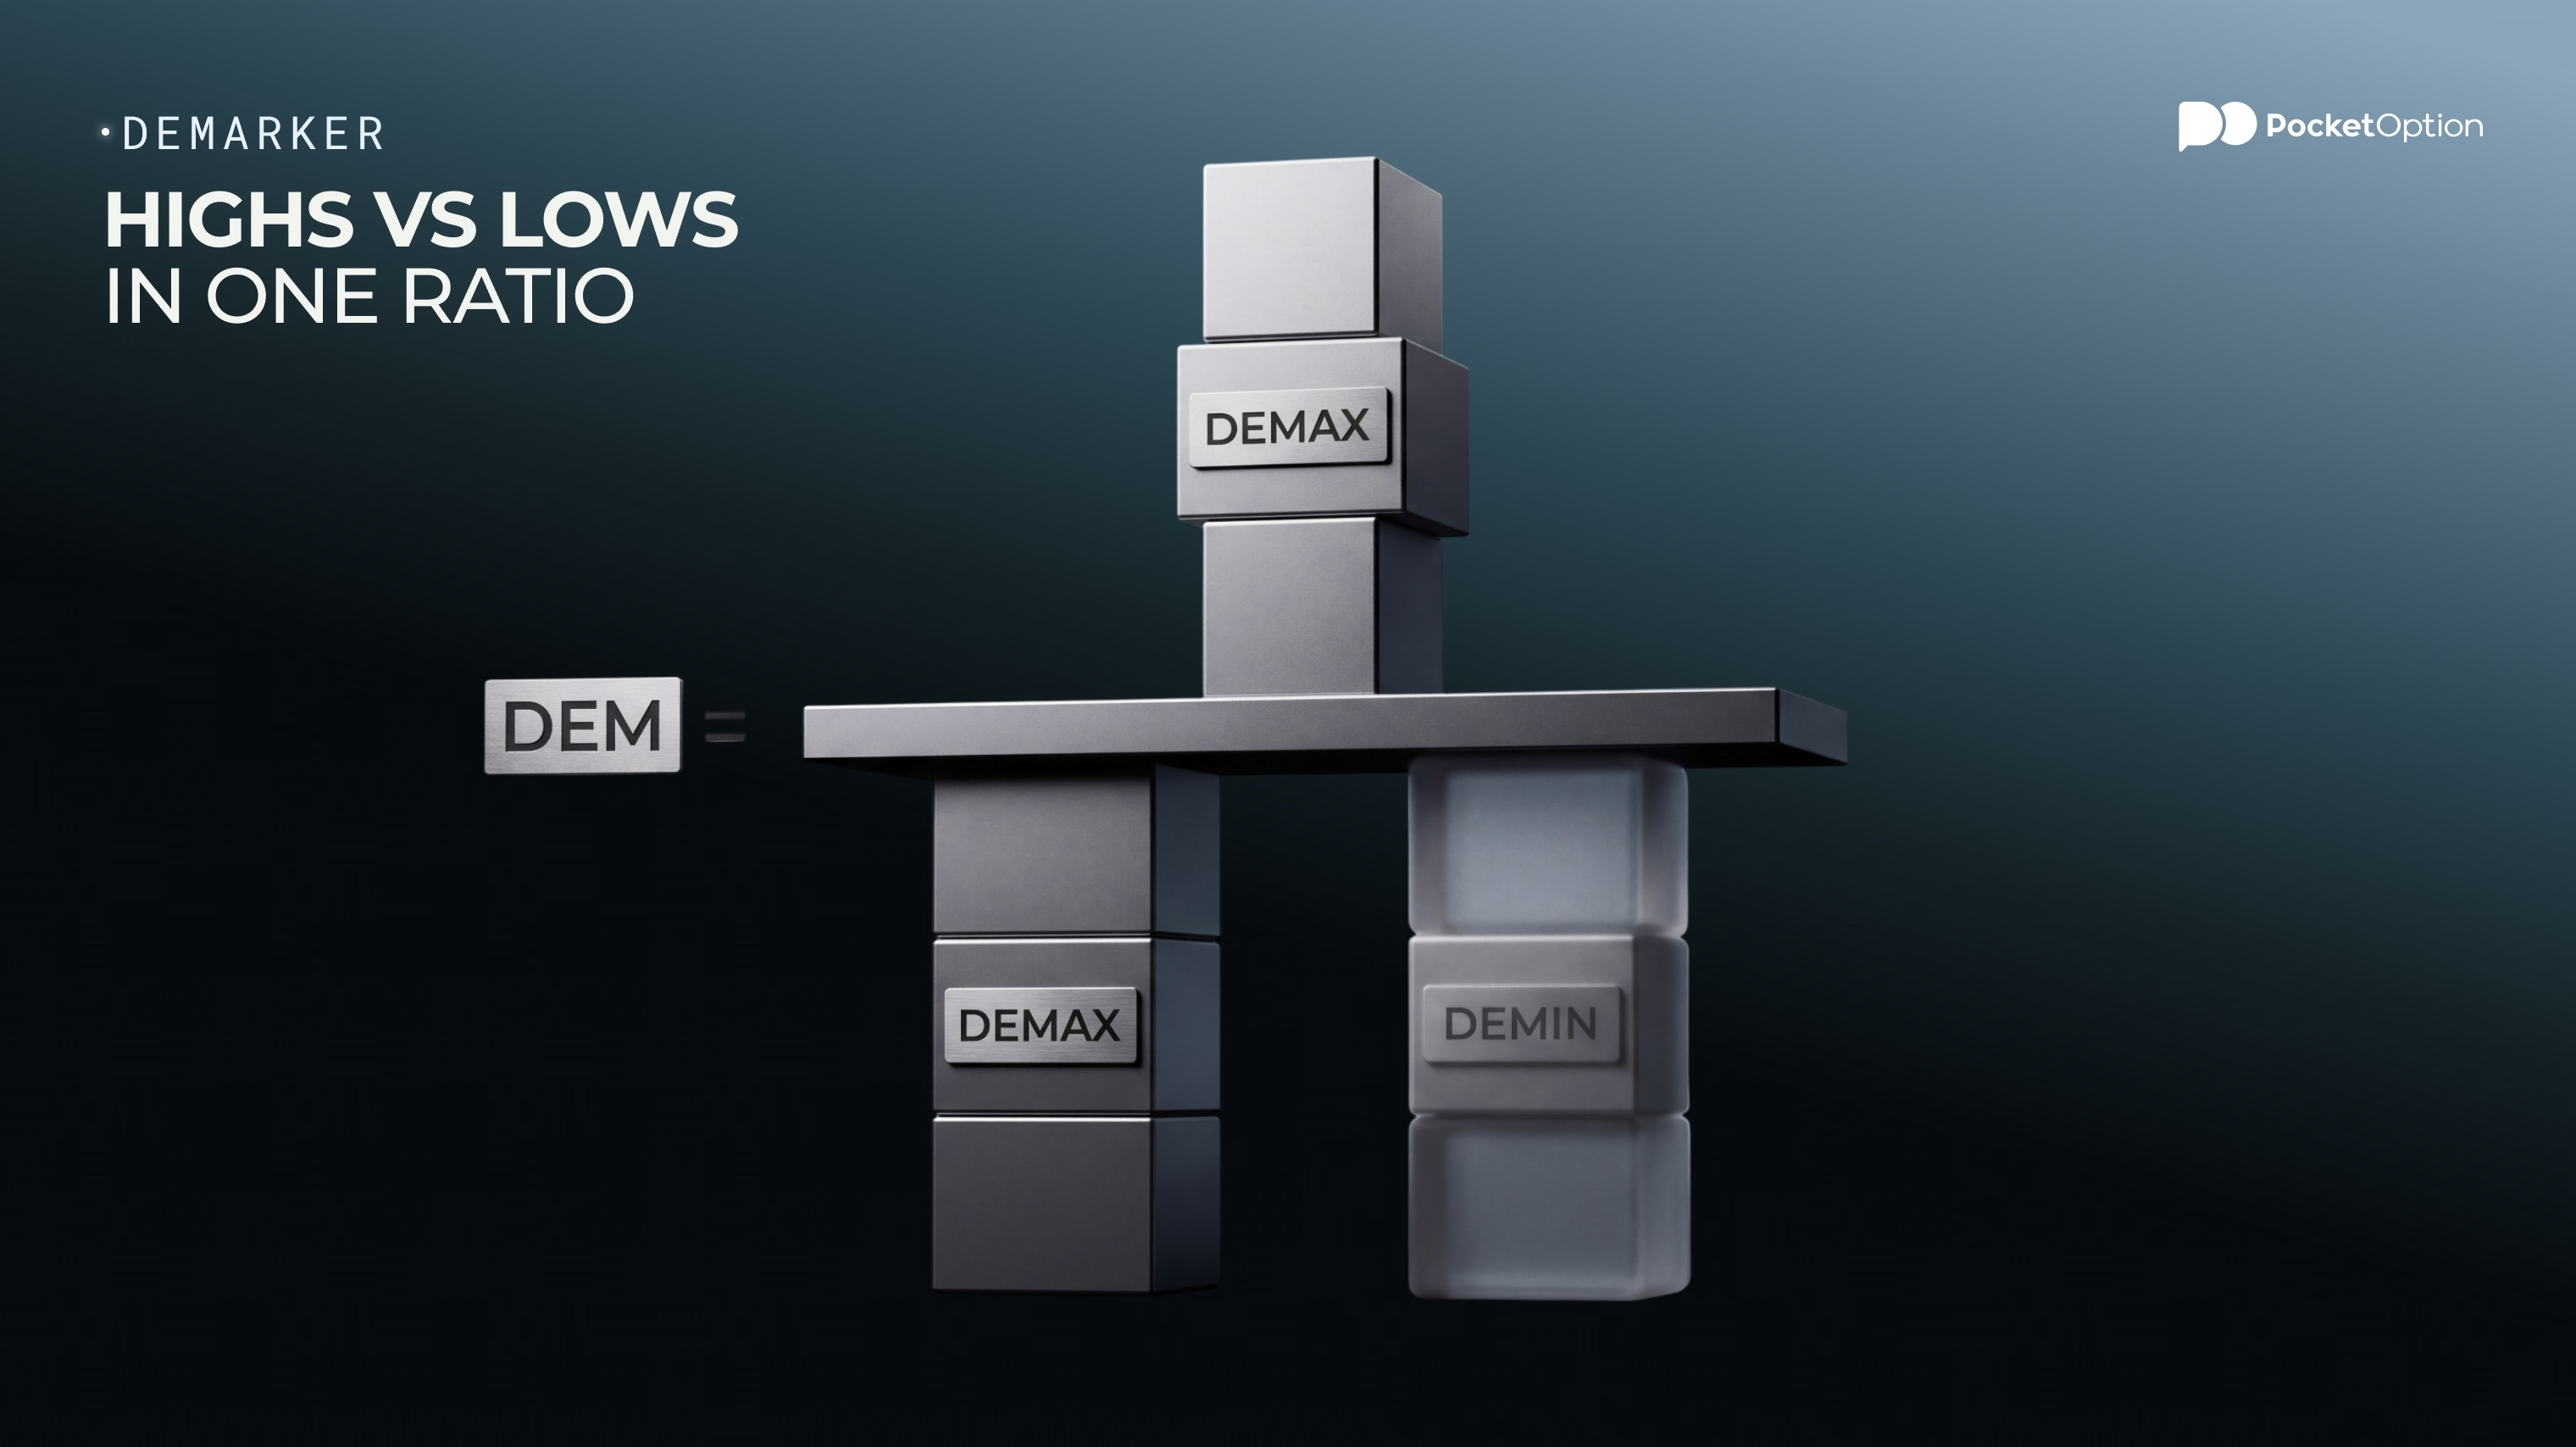
Two building blocks. DeMax: if the current high is above the previous high, DeMax is the size of that rise. Otherwise it is 0. DeMin: if the current low is below the previous low, DeMin is the size of that drop. Otherwise 0. Average each over N periods with a simple moving average (SMA), then divide the DeMax average by the sum of both averages.
N sets the memory. A short N reacts fast and flips often. A long N is calmer but slower. 14 is a commonly used default, not a law.
A conditional example. Say the average DeMax is 4 and the average DeMin is 6, in price units. DeM = 4 / (4 + 6) = 0.4. Now rising highs lift the average DeMax to 8 while DeMin stays at 6. DeM becomes 8 / 14, about 0.57. Same chart, different balance, different reading. Push the DeMax average to 9 against a DeMin average of 1 and DeM reaches 0.9. The table lays out the pieces.
Component | Calculation | What It Represents |
|---|---|---|
DeMax | Current high minus previous high if positive, otherwise 0 | Upward extension of the highs |
DeMin | Previous low minus current low if positive, otherwise 0 | Downward extension of the lows |
DeMarker (DeM) | SMA(DeMax, N) / (SMA(DeMax, N) + SMA(DeMin, N)) | Share of upward extensions in all extensions, from 0 to 1 |
So DeM is a ratio. An even split gives 0.5. Only upward extensions and no downward ones give 1. The reverse gives 0.
What DeMarker Readings Above 0.7 and Below 0.3 Mean
Here is how to use demarker indicator levels without turning them into automatic signals: treat each level as a description of recent behavior, not an order. Above 0.7 is usually called overbought. Below 0.3, oversold. Around 0.5, a balance between rising highs and falling lows.
Like any group of technical indicators, DeM describes what has already happened. Overbought does not mean price must fall. In a strong uptrend DeM can sit above 0.7 for a long stretch, and anyone who sold the first touch would have been run over. Same logic below 0.3 in a downtrend.
The exit from a zone tells more than the entry. A reading that climbs above 0.7 and then drops back below it says upward extensions are fading. That is information. It is not a confirmed reversal.
The 0.5 line deserves a mention. Hovering near it means neither side dominates and no zone is being tested. I read that as nothing to see yet, not as a hold or exit instruction.
Do the levels work equally on every asset and timeframe? No reason to think so. 0.3 and 0.7 are common conventions. Some traders shift them after testing on their own market. That is their call, and no setting is universal.
Finding Potential Reversals Through DeMarker Divergence
Divergence is where DeM gets attention. Price and the oscillator disagree, and that disagreement can be an early hint of fading momentum. The concept has its own guide on divergence trading. Any demarker indicator strategy built on divergence alone, though, ignores half the picture.
Bearish divergence: price prints a new high, DeM prints a lower high. Say price pushes to a fresh high while DeM peaks at 0.82 after reaching 0.91 earlier. Highs are still rising, but the push behind them is thinner.
Bullish divergence: price makes a lower low, DeM makes a higher low. Price slips under its previous bottom, yet DeM bottoms at 0.18 after 0.07 earlier. Selling pushes are losing force.
Both are hints. Price can keep going while divergence stacks up for weeks. So I run a short check:
Define the current trend
Compare price extremes with DeM extremes
Check where DeM sits relative to 0.3, 0.5 and 0.7
Look for price confirmation: a failed push, a break of a nearby low or high
Decide what would prove the idea wrong
The last step matters most. A divergence idea without a point where it fails is just a feeling.
When DeMarker Signals Need a Second Check
People like to frame the choice as demarker indicator vs rsi. I would rather ask a different question: what else is confirming this reading? Neither oscillator replaces the chart.
Limits first. In a strong trend DeM can hug an extreme for a long time. False reversals happen: the line leaves 0.7, price shrugs and keeps climbing. The period N changes the character of the signal, and on short timeframes noise makes DeM jittery.
A quick picture of a false turn. DeM climbs to 0.85, slips to 0.65, price barely pauses and prints another high, and DeM returns to 0.8. Treat that first dip as a reversal and you leave early, then watch the move continue.
So add a filter. A moving average gives trend direction. Support and resistance give location. DeM then answers a narrower question: how stretched is the move right now? One oscillator signal is not enough for a decision, and I will not hand you a fixed entry or exit rule here. That would be a strategy of its own.
Several tools agreeing gives context, not certainty. Indicators can agree and still be wrong.
Risk Disclaimer: Trading involves significant risk of capital loss. This article is for educational purposes only and does not constitute financial advice. Always conduct independent research and consider your risk tolerance before making any trading decisions.
See more:Education