Debt Service Coverage Ratio (DSCR): Can a Company Actually Cover Its Debt Payments?
Even with profits a company can fail to make loan payments. A profit is an accounting result. A loan payment is a sum of money leaving the bank at a definite date. The debt service coverage ratio determines if one could cover the other. This article describes the calculation with the help of a hypothetical leveraged company example, shows the mistake that distorts the result most often, and explains what the ratio does not reveal.

What Is the Debt Service Coverage Ratio?
Thus, what is the debt service coverage ratio? It compares the cash flow of a business to its debt payments during the same period of time.
DSCR = earnings or cash flow measure / total debt service
A DSCR equal to 1.00x means that the measure fully covers the debt payments with no extra funds. If it exceeds 1.00x there is some margin; if it falls below, the measure is not enough and should be compensated somehow. Thus, what is debt service coverage ratio really showing is debt repayment capacity during a particular period, and not the overall business health.
How to Calculate Debt Service Coverage Ratio
The formula is easy, but most of the difficulty is in the selection of the two inputs. That is why two analysts might give two different results for the same company, but both would be reasonable.
Defining the Earnings or Cash Flow Measure
There are three possible measures, and they cannot be used interchangeably:
EBITDA. Earnings before interest, taxes, depreciation, and amortization. Convenient to get from the income statement, but doesn't take into account taxes and working capital requirements.
Operating cash flow. Actual cash and actual tax from the cash flow statement. Needs an adjustment first (see below).
Cash available for debt service, or CFADS. Calculated for this purpose: operating cash flow minus all non-debt items that lenders cannot touch, like maintenance capital expenditure.
The EBITDA is usually preferred for company-to-company comparisons because anybody can calculate it. The CFADS is more strict and is common for project lending. No matter which measure is used, define it clearly, because the ratio makes sense only when the measure is defined.
Calculating Interest and Scheduled Principal Payments
The denominator is total debt service: the interest payments and scheduled principal repayments during the period. Principal is the item people tend to forget. The interest coverage ratios deal only with the interest, but a loan repayment is a cash obligation just the same, and in case of an amortizing loan the principal amount is usually higher.
And now the mistake that distorts the DSCR calculation more than anything else: do not double-count the interest. According to US accounting rules, the interest paid is already deducted in the operating cash flow, so dividing that figure by interest plus principal counts interest in both the numerator and the denominator, and the ratio turns out too low. Add the interest back before dividing, or divide by principal alone. The EBITDA was never adjusted by the interest, so it stays unaffected.
Matching the Measurement Period
Both numerator and denominator need to cover the same period of time, normally twelve months. Using a full year of cash flow and dividing it by a quarterly payment would lead to a DSCR result about four times too flattering. Trailing twelve months are needed for a company that is already operating, while lenders evaluating a new facility usually use forecasted cash flow for the following year.
Finding the Inputs in Company Disclosures
Every input is publicly disclosed, though not necessarily in one document.
Income statement: Operating profit plus depreciation and amortization gives EBITDA. The interest expense appears here too.
Cash flow statement: Operating cash flow, interest payments actually made, and repayments of borrowings from financing section.
Debt maturity schedule: Principal payments of next year, according to contract terms, before their due dates. Current portion of long-term debt from the balance sheet approximates them.
Loan documentation: The credit agreement provides the definition of the covenant-based ratio.
This last input is much more important than it seems. The credit agreements often apply adjusted earnings, with specific add-backs agreed between the parties, so a company can pass its covenant and still look stretched on the reported figures.
Shares, indices and currency pairs on one platform
Get StartedDSCR Calculation for a Leveraged Company
Let us consider a hypothetical manufacturing company with high debt. EBITDA is $72 million. The company is obligated to pay $26 million of interest over the next twelve months and to repay $22 million of scheduled principal, thus total debt service is $48 million.
Thus, how is debt service coverage ratio calculated in this case? Dividing $72 million by $48 million gives 1.50x coverage. Each dollar of the debt service is covered one and a half times.
Let's consider the same company in the same year, but with double-counting. Operating cash flow is $38 million, defined as EBITDA minus $26 million of interest and $8 million of tax payments. Dividing $38 million by $48 million gives 0.79x coverage, which suggests that the company cannot afford its debts. Adding back the interest payments we receive $64 million over $48 million, or 1.33x coverage. This is the same company in the same year, and the only difference is whether interest was counted twice.
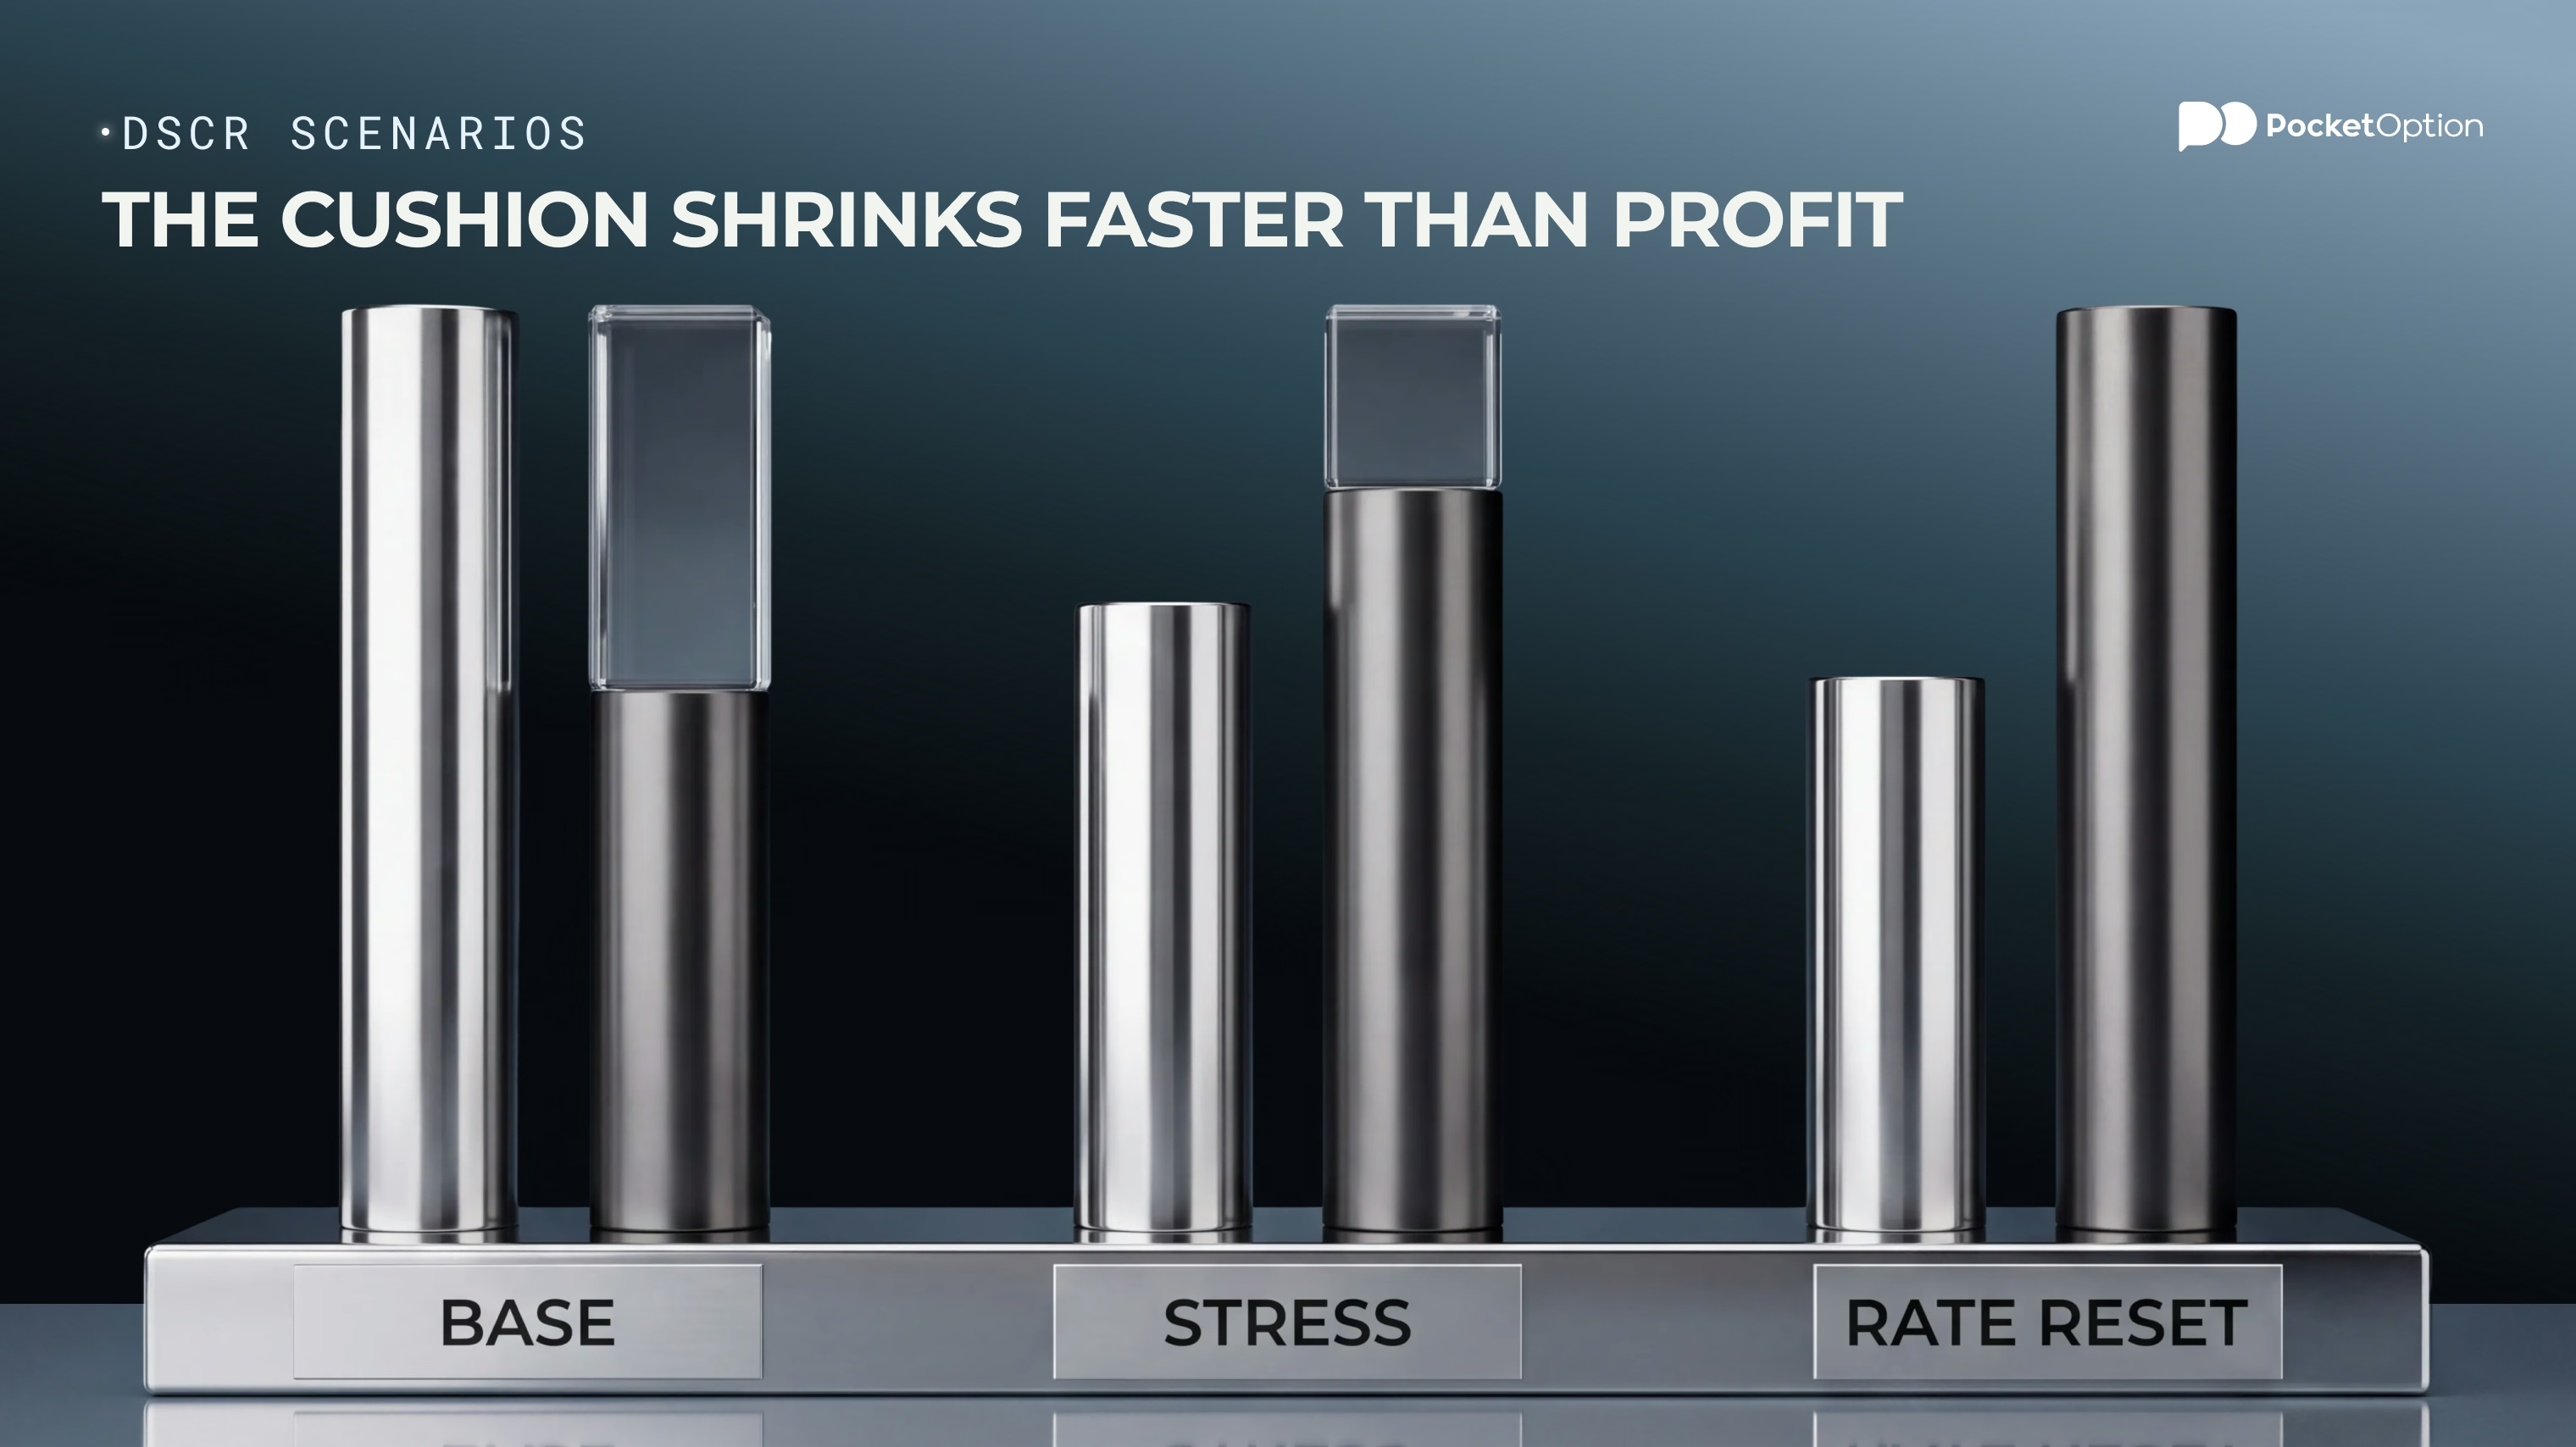
The remaining gap between 1.50x and 1.33x is the taxes, ignored by the EBITDA and accounted for in the cash flow. Both views are right, but they answer different questions. Leverage shows its nature in a stress situation, so the table below holds the principal constant and moves the variable parts.
Twelve-month figures | Base case | Stress: EBITDA down 25% | Stress plus rate reset |
|---|---|---|---|
EBITDA | $72m | $54m | $54m |
Interest payments | $26m | $26m | $31m |
Scheduled principal repayments | $22m | $22m | $22m |
Total debt service | $48m | $48m | $53m |
DSCR | 1.50x | 1.13x | 1.02x |
A reduction of the earnings by a quarter reduces 1.50x coverage to 1.13x. And if there is also a rate reset of the floating-rate loans, it reduces the ratio to 1.02x, so that the debt service is still covered, but the margin almost disappears. It is the leverage at work: the margin vanishes faster than the earnings.
What Is a Good Debt Service Coverage Ratio?
It depends on the industry and the loan terms, but two anchors can be used. 1.00x is the breakeven point for the chosen calculation, with no coverage cushion at all. 1.25x is the minimum level commonly cited by the lenders, implying that the cash flow is a quarter above the debt payments. Turned around, the same cushion means the earnings could be reduced by one-fifth before coverage drops to 1.00x.
Use 1.25x as a common benchmark, but do not think of it as a rule. What makes a good debt service coverage ratio depends on:
Cash flow stability. A regulated utility with contracted revenues can carry thinner coverage than a cyclical manufacturer.
Loan terms and covenant definitions. Floating interest rates and short terms argue for a larger coverage cushion, and adjusted earnings figures are not comparable to the reported ones.
The chosen measure. 1.3x on CFADS beats 1.3x on EBITDA, because CFADS takes into account tax payments and maintenance expenses.
One number doesn't prove anything on its own. 1.1x with contracted revenues may well be healthy, while 1.4x on volatile earnings during a downturn may not be.
DSCR in Loan Agreements and Credit Assessment
In a loan agreement, the ratio is not only an analytical tool, but a covenant with a defined minimum value, calculation, and test date, usually quarterly. Three concepts then get blurred into one, and the distinction between them is very useful.
Weak coverage. The ratio is low, but nothing happened contractually and all payments were made.
Covenant breach. The ratio fell below the required level according to the credit agreement, and gives the lender specific rights. In practice, it leads to a waiver, penalty, tougher terms or a cure period rather than immediate repayment of the loan.
Payment default. The company didn't make interest or principal payments on time.
These events don't occur in a row. A company could breach the covenant without missing any payments, and a company without a covenant at this level could run a low coverage for many years without breaching it. Interpreting a low DSCR as a default on the horizon ignores these intermediate states.
One related concept is worth distinguishing. What is a debt service coverage ratio loan? It is a property lending product, mostly American, where the lender evaluates the borrower based on the rental income of the building rather than personal income. The same arithmetic works, but it concerns one asset, not the corporate measure considered above. For the ways lenders and rating agencies evaluate the corporate borrowers, this article about corporate bonds and how corporate debt is rated provides a broader perspective.
DSCR vs Interest Coverage and Leverage Ratios
These three ratios revolve around one question and answer different aspects of it.
Interest coverage ratio. EBIT or EBITDA over interest expense. It asks if the company could service its debt cost, ignoring repayment of the debt itself.
DSCR. It adds scheduled principal and asks if everything to be paid during this year can be paid.
Net debt to EBITDA. It measures the debt size, not its payment terms.
The combinations are where the information is. Healthy interest coverage together with a DSCR close to 1.00x implies a repayment wall rather than an earnings problem, which is a refinancing question. None of them decides anything on its own, the same principle applicable to every input, discussed in this article about trade signals and how to use them.
What DSCR Can Miss
The ratio takes into account only one period and only one pair of values, so a lot can stay outside its scope.
Cash balances. Large reserves easily cover a shortfall, but the ratio can't reveal the overall balance.
Refinancing opportunity: most of the corporate debt is refinanced and not repaid, so the access to it matters more than this year's ratio.
Maturity schedule: 1.4x coverage looks comfortable until the debt note shows that most of the principal has to be repaid next year.
Seasonality, undrawn facilities, asset sales: a twelve-month figure hides months of tightness, and the latter two are the liquidity not covered by the DSCR calculation at all.
Check the maturity schedule and the cash balance before making any conclusions. They usually point in the other direction.
Analyze company figures
Try DemoUsing DSCR as an Additional Risk Filter on Pocket Option
The use of this ratio in trading is limited. It is not a timing tool and doesn't tell anything about direction. It identifies the companies with balance sheet risks, so positions in them are sized accordingly.
Calculate the ratio before you analyze the chart, and keep the same measure across the companies.
Check the debt maturity schedule for principal repayment concentration in the next two years.
Use the thin coverage as a reason to size smaller, not as a reason to expect falling stock prices.
Ignoring this last point is what will cost you money. The thin coverage is widely known and already priced, so it is not the basis for a trade. The use of it is in the sizing, and in identifying which companies react sharply to the rates change, because a leveraged borrower is more sensitive to the rate change than a debt-free one. Building this logic into a trading process is described in this guide on building a realistic trading plan.
Conclusion
The ratio provides one narrow answer well: can the cash flow produced by the business cover its debt payments in this year?
Just get the inputs right, and the rest will follow. Specify which measure was used, include the principal and not interest only, match the periods, and never deduct interest in both halves of the ratio. Read 1.00x as the coverage with no margin and 1.25x as the common lenders' benchmark rather than a threshold of safety. Most importantly, distinguish weak coverage, covenant breach, and payment default. A company can sit in the first one for many years without ever reaching the third.
Disclaimer: This article is for informational and educational purposes only and doesn't constitute investment, financial, or lending advice. The company figures are hypothetical and chosen to illustrate the calculation, not extracted from any real business. Financial ratios are descriptions of past reported periods, and don't predict the future performance, credit events, or stock price movement. The covenant definition varies from individual loan agreement to loan agreement. Trading involves a significant risk of capital loss and might not be suitable for all investors. Demo results do not indicate future results in live trading.
See more:Education