Sortino Ratio: How It Differs from Sharpe and Why Downside Risk Matters
The Sortino ratio scores return against downside risk only. Here is the formula, a simple worked example, how downside deviation works, how the ratio differs from Sharpe, what a good reading might mean, and the limits to keep in mind.

Two funds. Both made 10% last year. Fund A climbed like a staircase. Fund B shot up 30%, fell 15%, then limped back. Which one is riskier? Plain volatility says B. The Sortino ratio says: wait. Risky how?
What Is the Sortino Ratio?
The Sortino ratio scores return per unit of pain. Not total wobble. Pain. It takes your return above a target. Then it divides by downside deviation, a measure of how far results fall below that target, and how often. Big upswings? Ignored. Only the stumbles count. Frank Sortino argued this in the 1980s and 1990s. Risk, he said, is missing your goal. Not bouncing around it.
Monthly returns: +8, +1, -3, +7, -5. Target: zero. Only the -3 and the -5 enter the downside figure. The two big gains never touch the denominator.
Neat idea. Dangerous idea too. People ask "what is a good Sortino ratio" as if one number settles it. It doesn't. The figure shifts with the target, the period, the data. A high reading proves little. And it promises nothing about next year. So what is a good Sortino ratio? One that wins a fair fight. Same target. Same period. Same method.
Open a demo account and track your results with virtual funds.
Try Demo AccountA ratio on a page proves little. Your own data proves more.
Run a month on a demo account with virtual funds. Log each day's result. Pick a target, say zero. Then circle only the red days. Notice how three ugly days can dominate the downside figure. That's the lesson. It's also why what is a good Sortino ratio depends so heavily on where your data came from.
Log a month of demo trading in a sheet. Then compute both ratios yourself.
Sortino Ratio Formula Explained
The formula is short:
Sortino = (R - T) / DD
Three letters. R is the return you earned over the period. T is the target, the minimum you'd accept. DD is downside deviation: only the shortfalls under that bar.
Need your own numbers? The pocket option tutorial shows where your trade history lives.
Careful with sources. Some swap the target for a risk-free rate. Others use a benchmark. Two published figures only compare if they share a method. Check first. People love asking what is a good Sortino ratio for a portfolio. The honest reply is another question. Which target? Which period?
What Is Downside Deviation?
Picture ten monthly returns. Underline every month that missed your target. Everything else counts as zero. Now measure the damage. That's downside deviation. Standard deviation does the opposite: it treats a big gain and a big loss alike. Downside deviation shrugs at the gain. A strategy that rockets upward pays no penalty for it. Before settling on what is considered a good Sortino ratio, remember this. A handful of bad months in a small sample can swing the denominator hard.
How to Calculate the Sortino Ratio: Simple Example
Made-up numbers. Rounded. The point is the mechanics. Five steps:
Return: 12% for the year
Target: 4%
Excess return: 12% - 4% = 8%
Downside deviation: 5% (a spreadsheet gave us that)
Sortino ratio: 8 / 5 = 1.6
The heavy lifting is downside deviation from a full return series. Any spreadsheet does it. You just need the shape: reward above the bar, divided by pain below it.
Now raise the target to 6%. Same year. Smaller excess return. Usually a bigger downside deviation. Lower ratio. Same performance, different number. That's why a Sortino figure without its target is nearly meaningless.
What Is a Good Sortino Ratio?
Higher positive means more excess return per unit of downside risk. A negative figure means the year fell short of the bar. Not a crash alarm. Just a miss. You'll see 1, 2 and 3 quoted. Acceptable, good, excellent. Rough conventions. Not law.
Compare like with like. Same period. Same target. Same method. A 2.0 from one calm year is not a 2.0 from a rough decade. And a 1.4 beats a 0.9 only inside the same category and window. Two traders both show 1.5. One climbed steadily. The other survived one brutal month. Same score. Different story.
Sortino Ratio vs Sharpe Ratio
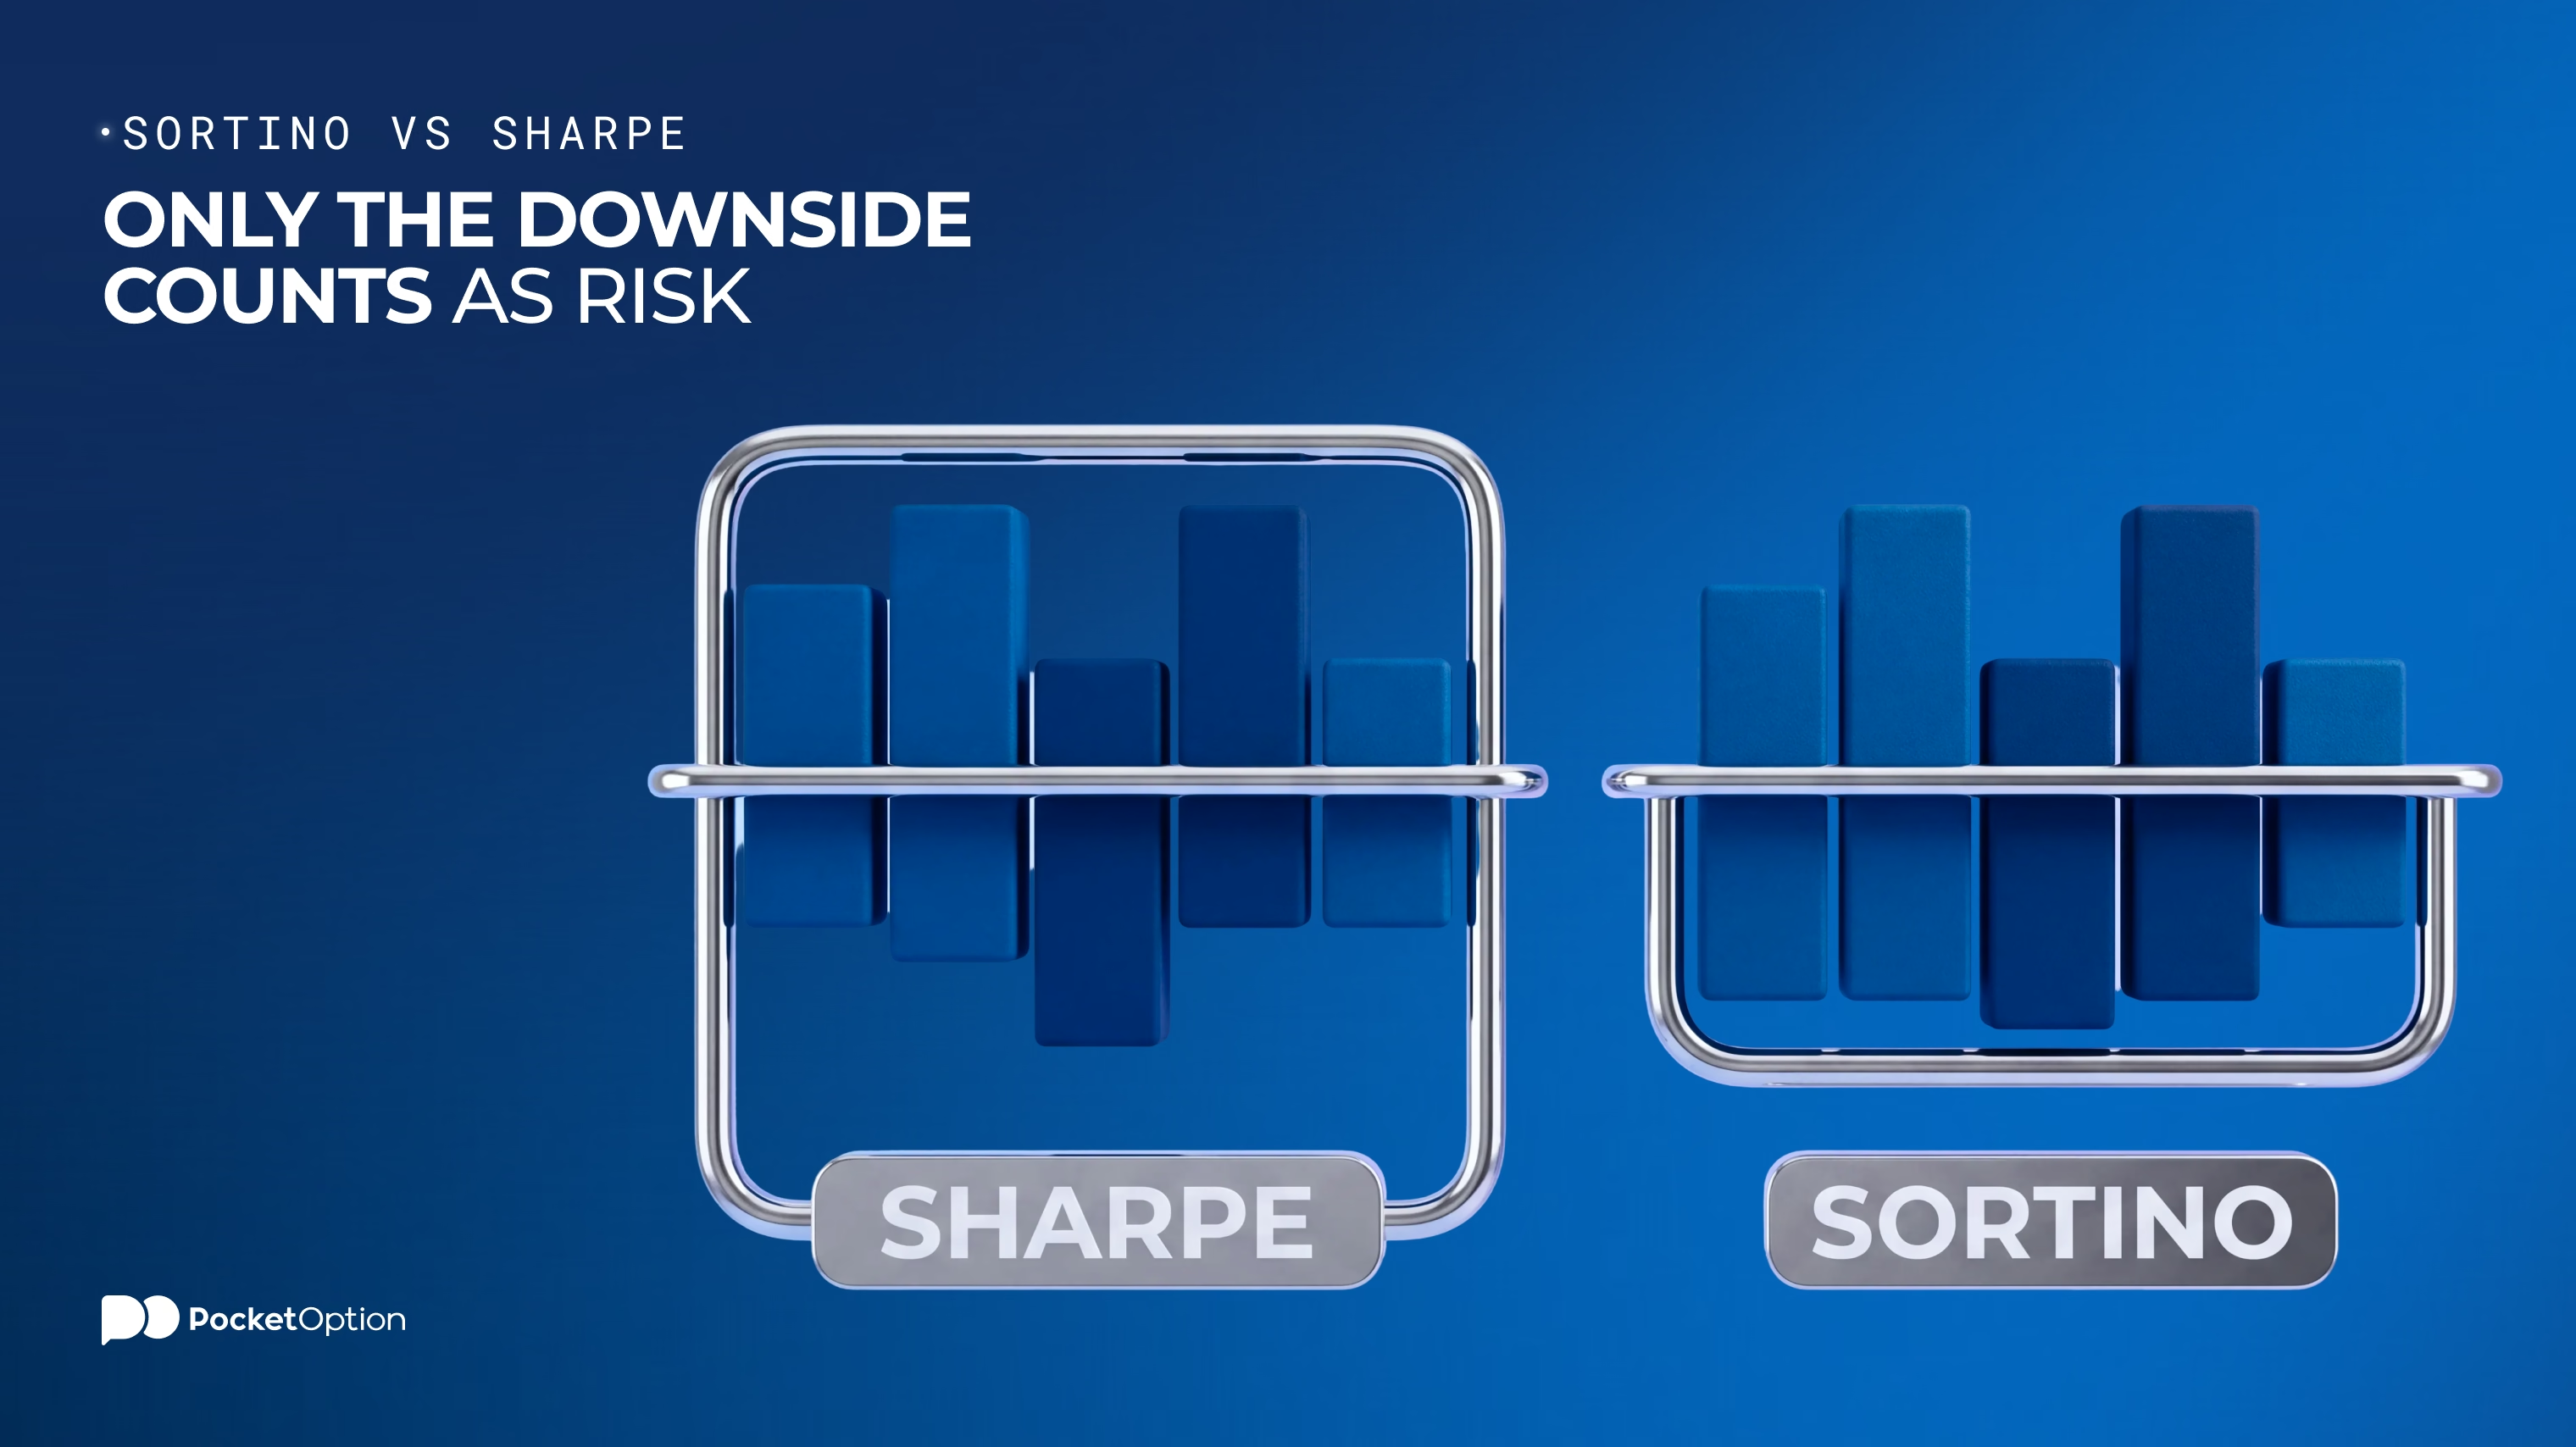
One difference does the work. Sortino divides by downside deviation. Sharpe's denominator is the standard deviation of every return, good and bad. Sharpe subtracts a risk-free rate. Sortino subtracts your target. Big gains, rare losses? Sharpe shrugs. Sortino applauds. Take Fund B from the intro. It could post a modest Sharpe and a far better Sortino, because most of its wobble was the upward kind.
Aspect | Sortino Ratio | Sharpe Ratio |
|---|---|---|
Risk measure | Downside deviation | Standard deviation of all returns |
Upward swings | Left out of the risk figure | Included in the risk figure |
Denominator | Shortfalls below the target | Total variability around the average |
Main use | Return per unit of harmful volatility | Return per unit of total volatility |
Key limitation | Depends on the target and on few bad periods | Treats big gains like big losses |
That's the whole comparison. Neither ratio gets the last word.
Limitations of the Sortino Ratio
Keep these in mind:
The target you pick can change the result
A different calculation period gives a different number
Small samples contain few downside observations
Switching from daily to monthly data changes the answer
Past downside doesn't promise future downside
Ratios built with different methods aren't directly comparable
Sortino fixes one complaint about volatility metrics. Not all of them.
How Traders Can Interpret the Sortino Ratio
Use it to compare strategies when harmful swings matter more than total volatility. Read it beside absolute return, drawdowns and the sample period. Higher isn't automatically better. Two strategies can share a Sortino and still have very different drawdowns. One ratio squeezes a whole return path into a single number. Look at the path too. Ask three questions. What target? What period? What data? And no ratio ever hands you a buy or sell call.
Risk Disclaimer: Trading involves significant risk of capital loss. This article is for educational purposes only and does not constitute financial advice. Always conduct independent research and consider your risk tolerance before making any trading decisions.
See more:Education