What Is the Fed Dot Plot? How to Read FOMC Interest Rate Projections
The Fed dot plot collects individual FOMC rate projections in one chart. This guide explains what each dot represents, how to read the years and the longer-run column, what the median and the spread suggest, and what to compare in each new release.

Nineteen people, one room, a pile of sticky notes. Everyone writes a single number. No names. Notes go on the wall by year, high numbers up top. Step back. You can see where the room leans, and where people clearly don't agree. That wall is, roughly, the Fed dot plot. Most readers skim it for one number and walk away. The wall says more than that.
What Is the Fed Dot Plot?
Open the Summary of Economic Projections, the SEP, and the Fed dot plot is one chart in it. Each dot is one FOMC participant's call on where the federal funds rate should be when a given year ends. One extra column covers the longer run. One participant. One dot. No name attached.
Two points matter right away. A dot isn't a Committee decision, and it isn't a promise about the next rate move. It's one person's view, built on that person's own read of the economy. Timing matters too. The Fed dot plot comes out with the SEP, not after every FOMC meeting. Median and spread get their own sections below.
Open a demo account and follow how markets react to rate projections, with virtual funds.
Try Demo AccountNumbers on a page and numbers moving in real time feel different.
Release days move fast. Statement, projections, press conference. All inside one afternoon. Prices answer to the whole bundle, not to a single dot. Seeing that happen on a live chart, with no real money at risk, teaches the gap between what was expected and what actually arrives better than any diagram ever will.
A demo trading account lets you watch a pair react around the next rate release, using virtual funds.
How to Read the FOMC Dot Plot
Start with the axes. Across the bottom of the FOMC dot plot you get calendar years, then a Longer Run column at the end. Up the side runs the federal funds rate. Dots stack at different levels inside each column. That's the whole layout.
Each dot answers one question. Where does this participant expect the rate to stand at the end of that year? End of the year. Not the average rate across the year. A dot in the current year's column describes a year-end snapshot, whatever happens in between.
Names aren't printed. Nobody can tell which official placed which dot, and guessing gets you nowhere. Two dots at the same level could come from very different reasoning. Think of the FOMC dot plot as a survey, not a timetable.
Charts make more sense with a live market beside them. Getting a workspace ready takes minutes, and the pocket option tutorial walks through each step.
What Each Dot Represents
On the Federal Reserve dot plot, a dot marks one participant's judgment of the appropriate midpoint of the target range for the federal funds rate, or the appropriate target level, at the end of the stated year or over the longer run. Strip the jargon and it says: here's where I think policy ought to be by then. Not the rate the Fed will set. Not a vote either. Every projection rests on that participant's own assumptions about the economy and about appropriate monetary policy. Change the assumptions and the dot moves.
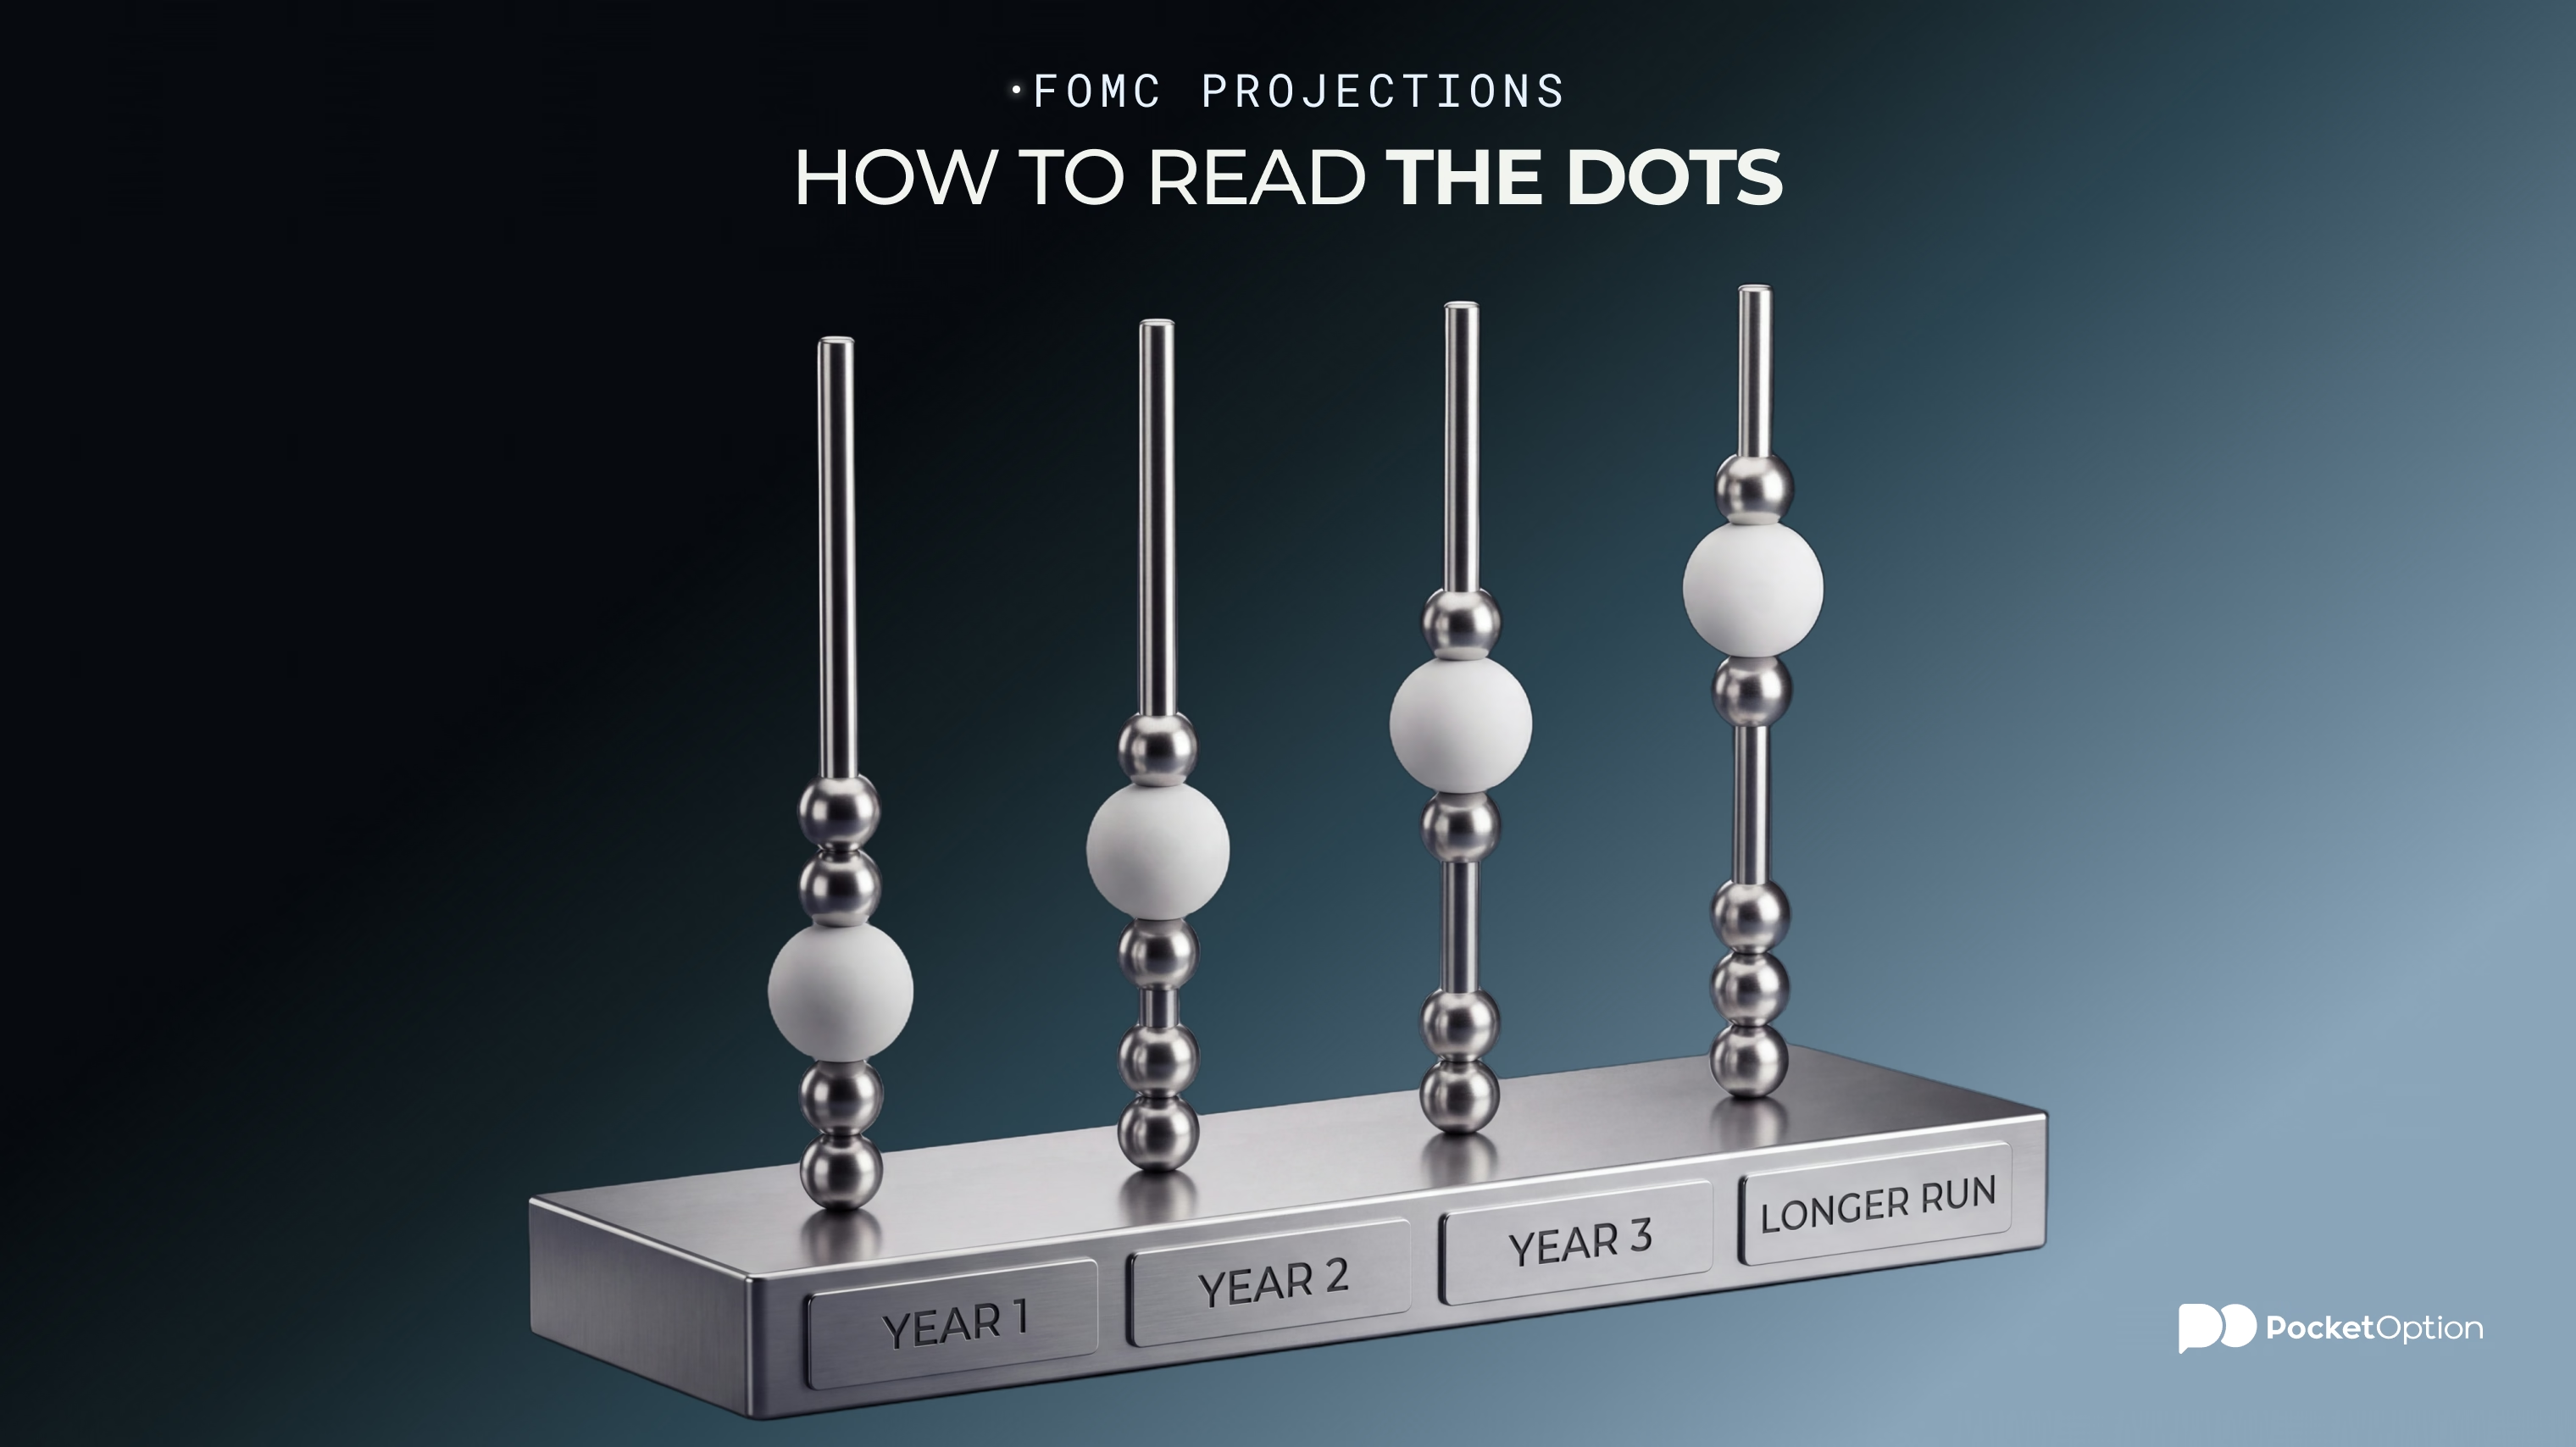
What the Years and Longer-Run Column Mean
Each year column shows rate projections for the end of that calendar year. The Longer Run column plays a different role. It reflects the level each participant expects the federal funds rate to drift toward over time, under appropriate policy and without new shocks. So what is the Fed dot plot telling you with that last column? A rough idea of where participants see rates settling. Not a call on one specific year.
What Does the Median Dot Mean?
Line every projection up from lowest to highest. The one in the middle is the median. With an even number of participants there's no single middle dot, so the median becomes the average of the two middle projections. Simple arithmetic.
So why does everyone quote it? Nineteen numbers are a mouthful. One is easy to repeat. Reporters and traders grab the median as shorthand for where the group sits. Useful. But it's a statistic built from individual opinions. It's not a Committee decision, not a consensus forecast, and it guarantees nothing about the path of rates. Next SEP, new data, fresh assessments, and the median may well move.
How to Read the Spread of the Dots
The median is half the story. The other half: how the dots are spread out. Dots bunched together mean projections sit close. Dots scattered across the page mean views differ more. Neither shape tells you what the Committee will do. Tight clusters don't lock in a decision. Wide spreads don't prove a fight inside the FOMC.
What You See | What It Can Suggest | What It Does Not Mean |
|---|---|---|
Tight cluster | Individual views sit close together | A locked-in decision |
Wide dispersion | Participants see a broader range of outcomes | Automatic conflict inside the FOMC |
Median shifts higher | The middle projection moved up versus the previous SEP | A promised rate increase |
Median shifts lower | The middle projection moved down versus the previous SEP | A promised rate decrease |
Longer-run dots change | Views on the eventual resting level of rates changed | A forecast for a specific year |
Use the table as a cheat sheet. Each row says what a picture might suggest, and where that stops.
Why the Dot Plot Changes From One SEP to the Next
Between two SEPs the world keeps moving. New inflation readings. New employment data. Growth surprises in either direction. Participants update their outlook, and with it their view of appropriate monetary policy. So the dots shift.
A shift doesn't mean the old plot was wrong. Every dot was a conditional call, made with what was known that day. Different information, different dots. That's the whole mechanism.
How Markets Compare the Dot Plot With Rate Expectations
Markets rarely read dots in isolation. They compare. The new median against the previous SEP. The new spread against the old one. And all of it against what rate expectations implied before the release.
Land above or below what traders expected, and the perceived path of rates can shift. But the reaction leans on other things too: the statement, the press conference, the inflation and jobs outlook, and what was already priced in. Can a plot look firm on paper and still barely move prices? Sure, if traders saw it coming. Any one-line rule about higher or lower dots ignores all of it.
Why the Dot Plot Is Not a Rate Promise
A dot plot is a snapshot. Each participant's view of appropriate monetary policy, using the information available when the SEP was prepared. Economic conditions change. Forecasts change with them. Real policy can drift far from earlier dots, especially a few years out.
The Fed even publishes uncertainty information around its projections. A hint that one point is a thin way to read any forecast. And grading the plot as accurate or inaccurate after one later decision misses what it is. It was never a promise to begin with.
What Traders Should Check in a New Fed Dot Plot
A new release calls for a short routine, not a trade idea. What to compare in a new dot plot:
Median projection for each year
Change versus the previous SEP
Distribution and dispersion of the dots
Longer-run projection
Whether the rate outlook moved together with GDP, unemployment and inflation projections
Difference between Fed projections and market expectations before the release
Any example in an article, this one included, ages quickly. Current values and the release date belong to the latest SEP, so check them directly on the Federal Reserve's website each time. And keep one limit in mind. The plot gives no reliable standalone signal for USD, bonds, equities or any other market.
Risk Disclaimer: Trading involves significant risk of capital loss. This article is for educational purposes only and does not constitute financial advice. Always conduct independent research and consider your risk tolerance before making any trading decisions.
See more:Education