What Is Core Inflation? Core vs Headline Inflation Explained
Core inflation strips food and energy out of a price index to show the underlying trend. Here is how it differs from headline inflation, why the two diverge, why economists watch core, and where it falls short.

Gas jumps 40 cents in a week. Tomatoes double after a bad harvest. Are prices across the whole economy climbing for good? Maybe. Maybe not. That question sits behind two numbers on every release day: headline and core.
What Is Core Inflation?
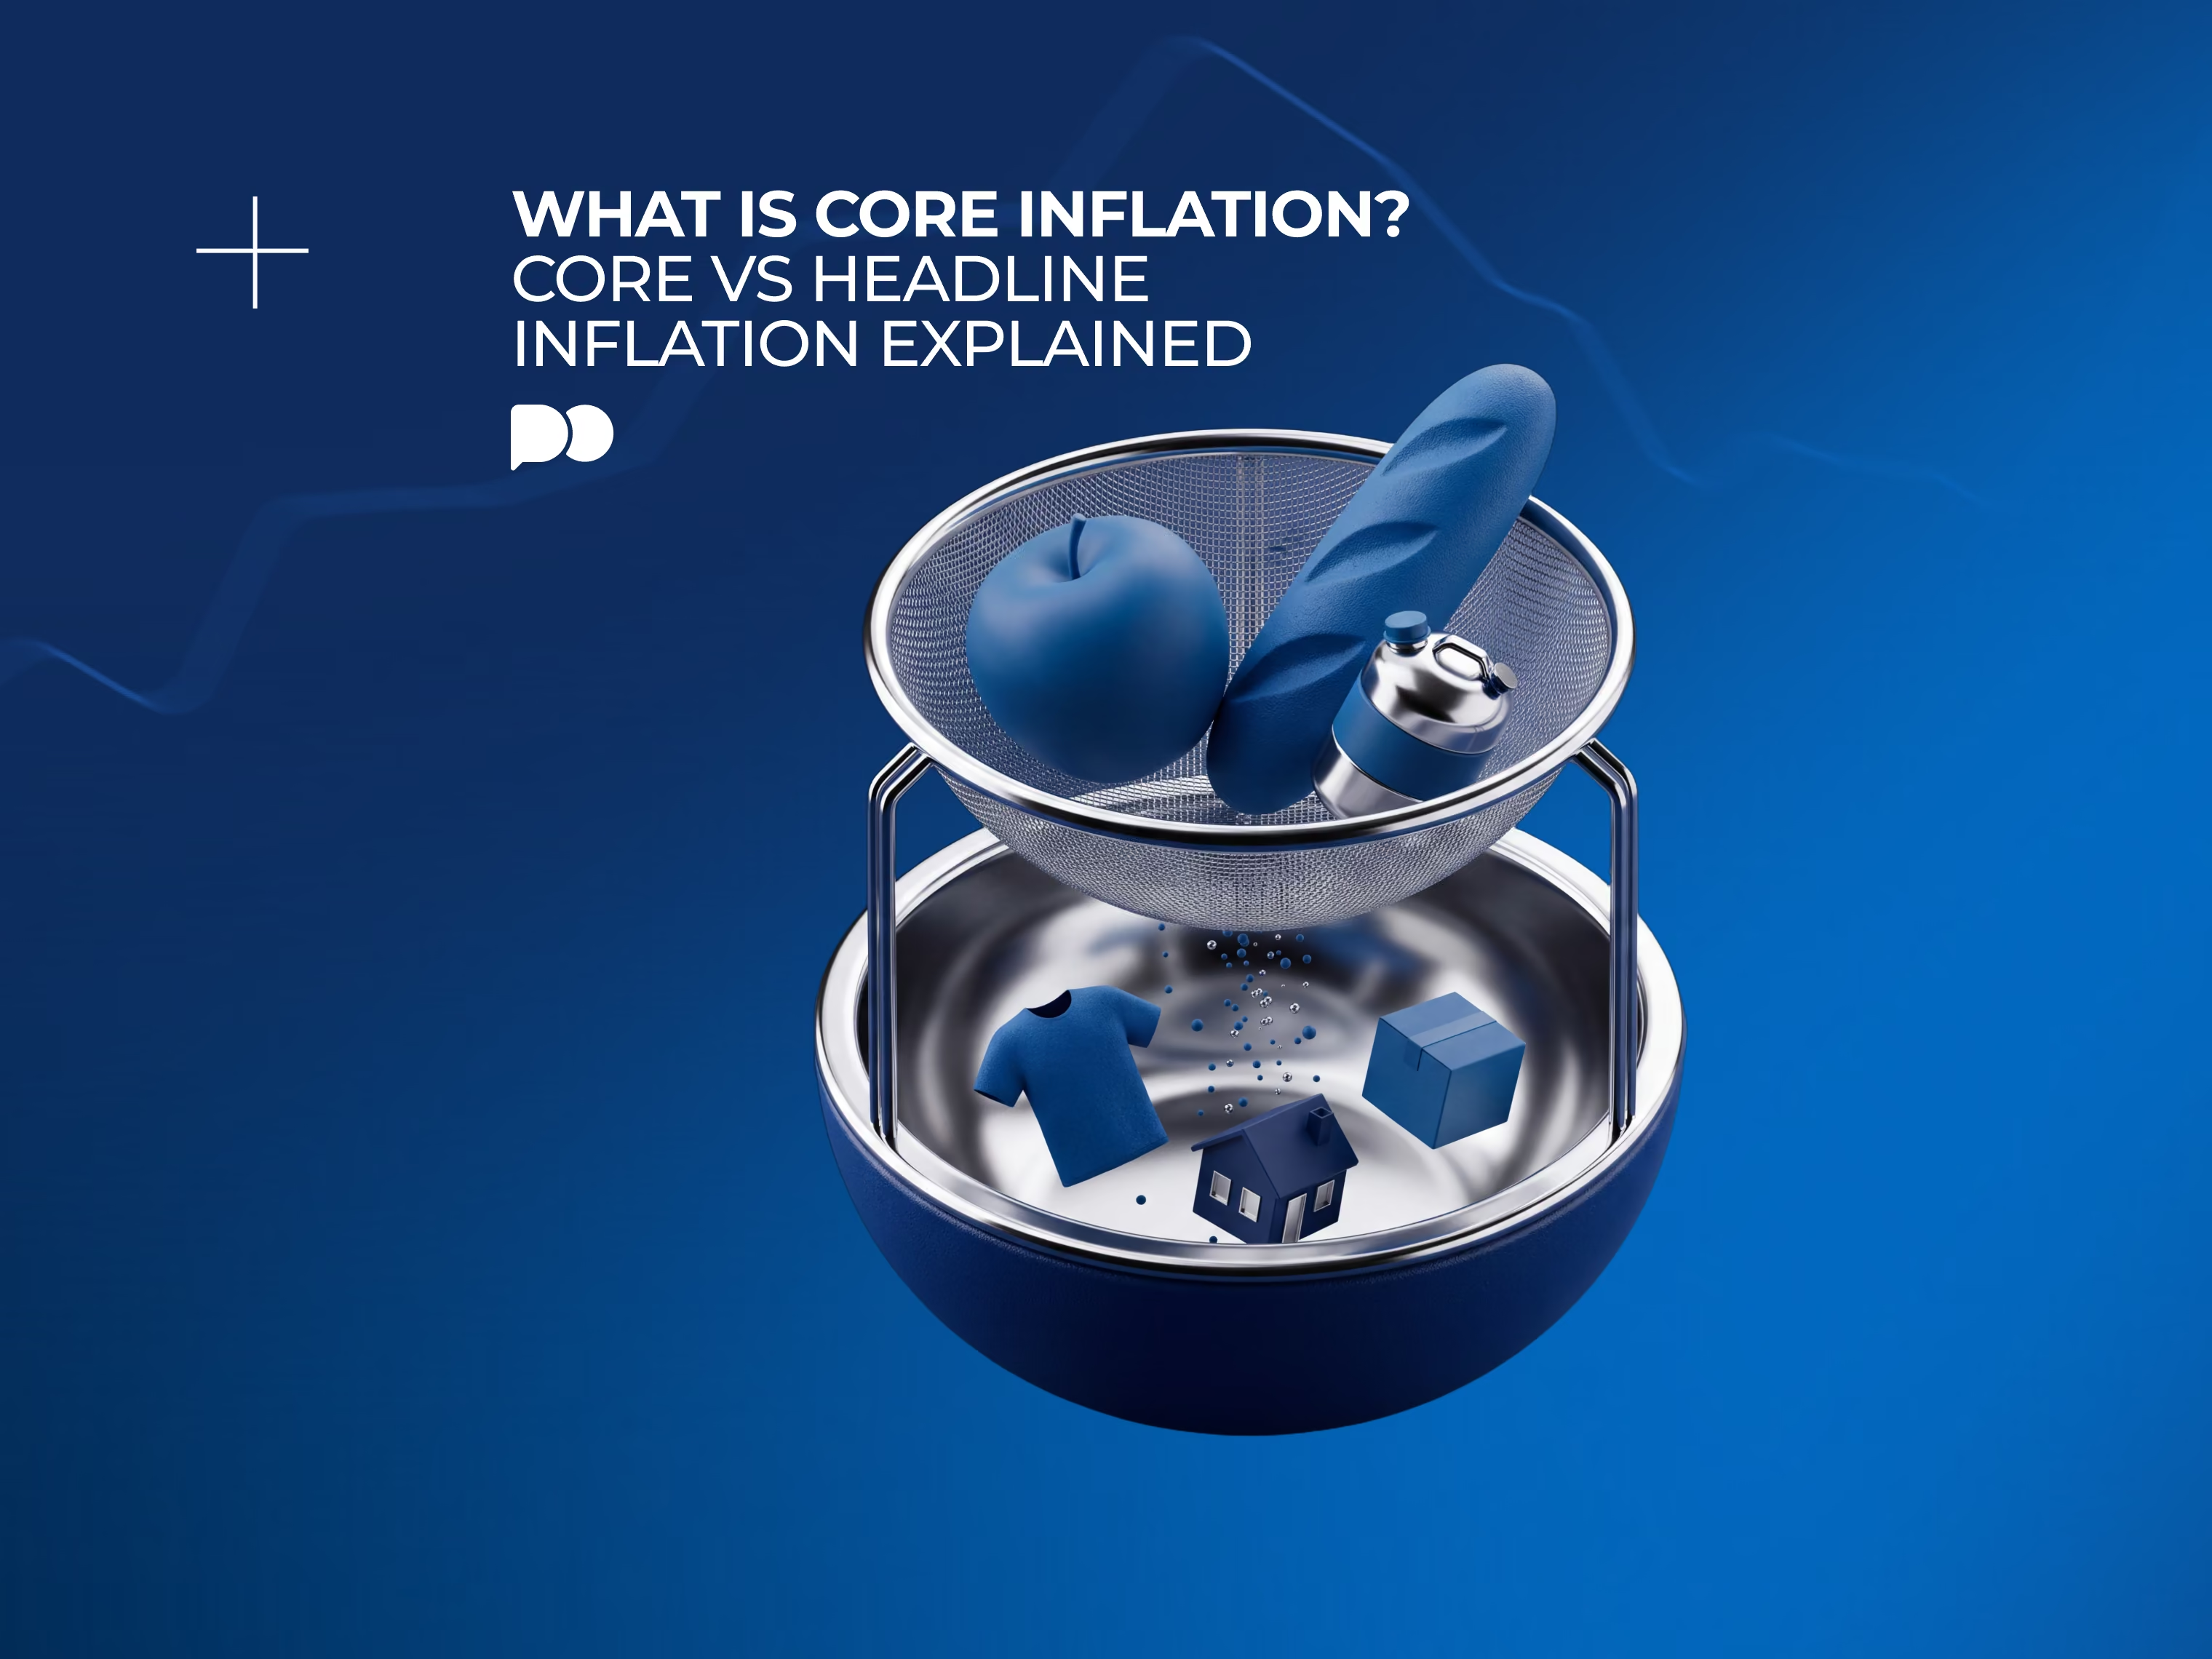
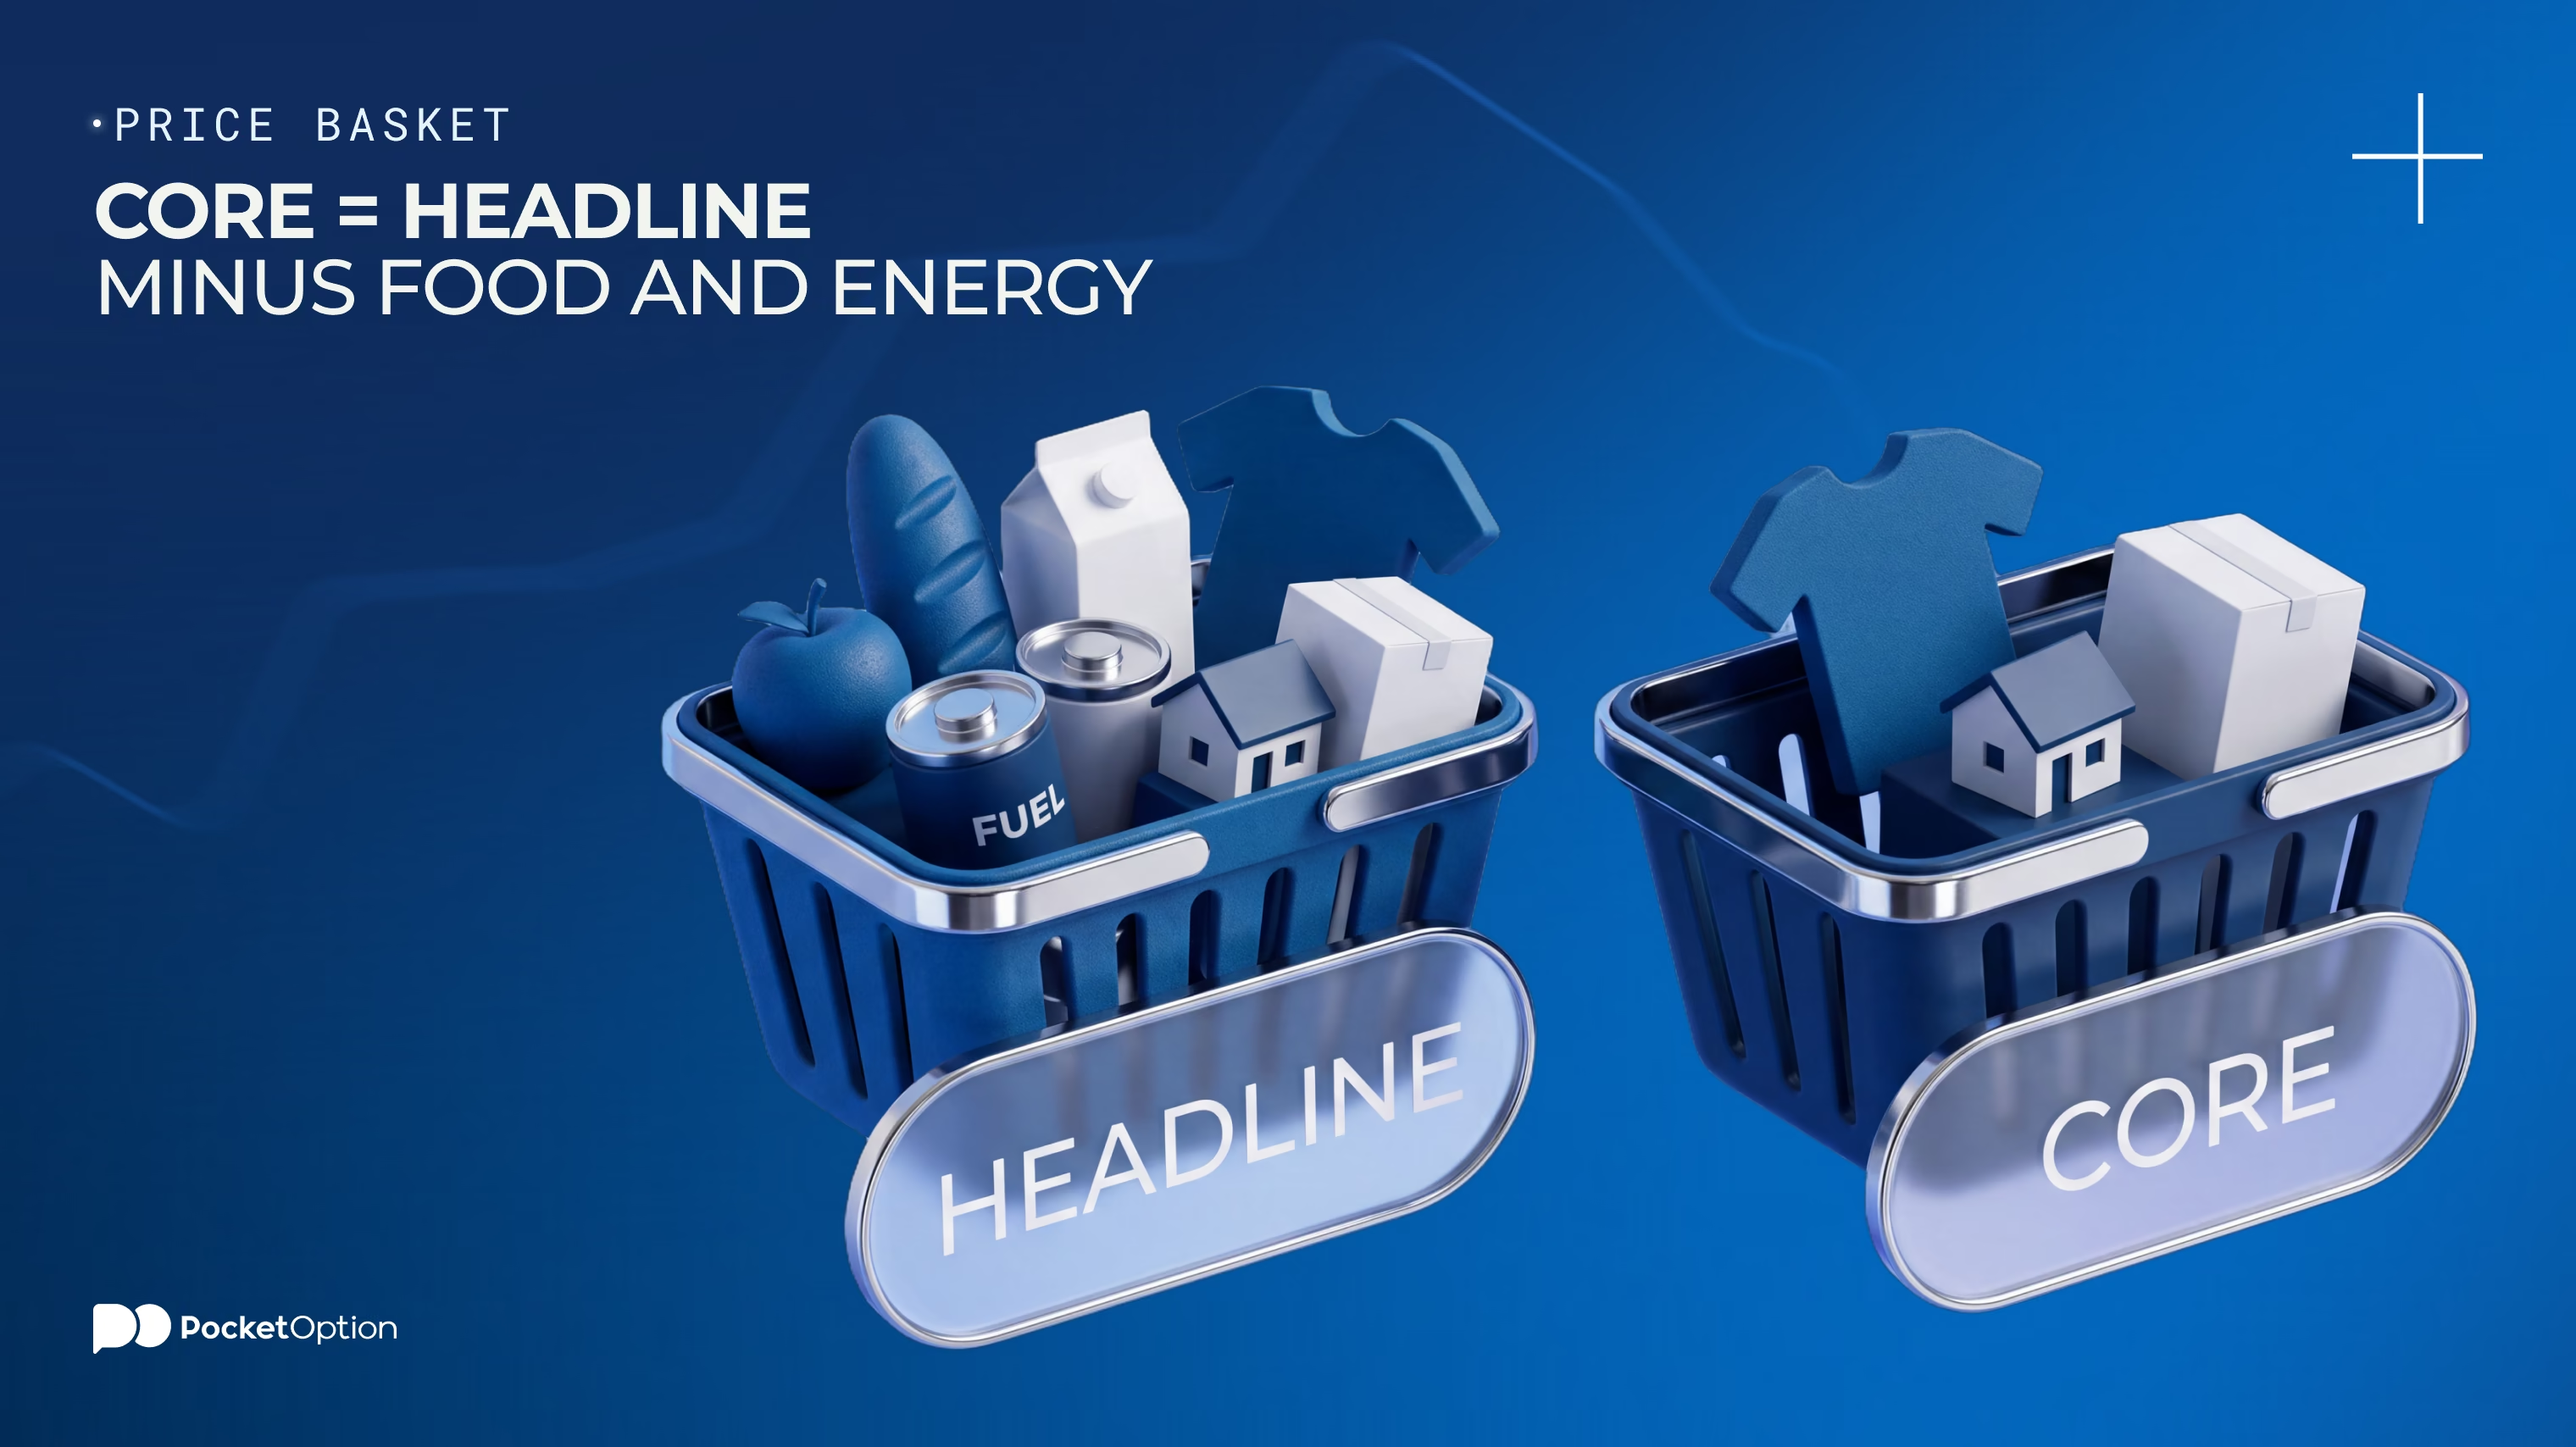
Core inflation is a price measure built to show the underlying trend. It strips out the categories that bounce around most. In the common U.S. versions, core CPI and core PCE, that means food and energy.
Simple idea. Easy to misread. Food and energy aren't ignored. You still buy both, and both stay in the headline figure. Core just sets them aside. Definitions shift a little by index, country and method. Core inflation is the calm version of the story. Treat core inflation as the quieter reading of the same economy.
Open a demo account and watch markets react to price data releases.
Try Demo AccountReading about it is slow. Watching a release land is faster.
Price reports hit at fixed times, and markets often twitch within seconds. Sometimes the move matches the headline number. Sometimes it follows a detail buried inside the report. A demo account lets you watch all of it with virtual funds, so the first few releases are cheap lessons.
Next release day, try demo trading. Keep a chart open. Watch what the numbers do.
What Does Core Inflation Exclude?
Asked what is core inflation leaving out? Food and energy, in most U.S. measures. Why those two? Ever watched pump prices jump after one pipeline hiccup? Or lettuce double after a rainy spring? That's the swing core sets aside.
Pull up a fuel chart and you'll see it. The pocket option tutorial shows where the tools are.
Core isn't spotless, though. Airfares stay in, and anyone who has booked a flight in December knows how wild those get. Used cars swing too. Meanwhile some excluded foods barely move. So what is core inflation really measuring? A cleaner trend. Cleaner, not clean.
What Is Headline Inflation?
Headline inflation is the change in prices for the whole basket of a price index. Food and energy included. That makes it closer to what you feel at the checkout. It also jumps around. One category can drag the whole number up or down in a single month. So treat headline inflation as the broad view. One month isn't a trend.
Core Inflation vs Headline Inflation
Traders argue about core inflation vs headline inflation like it's a football match. Wrong framing. Neither is the real number. They answer different questions.
Feature | Core | Headline |
|---|---|---|
Categories included | All but food and energy | Full consumer basket |
Food and energy | Left out | Included |
Short-term volatility | Smoother | Swings more |
Usefulness for underlying trend analysis | Higher | Lower |
Usefulness for household cost pressure | Lower | Higher |
Main limitation | Exclusions are a shortcut | A few categories distort it |
Picture a winter where oil jumps. Pump prices rise, headline follows, core barely notices. A few months later, delivery trucks cost more to run. Wages creep up. Restaurants reprint their menus. Now core moves too. When oil falls, run the film backwards: headline drops first, core takes its time.
Why Economists and Central Banks Watch Core Inflation
Rate decisions take a while to bite. Policymakers have to guess today which price moves will last. Core helps with that guess. Do central banks ignore headline? They don't. The Fed has said it watches many measures and subcategories, not just one.
Why Core Inflation Has Limitations
Any filter loses something. Why core may not fully capture underlying inflation:
Volatile prices exist outside food and energy
Some excluded food items aren't very volatile
Lasting food or energy shocks spill into other prices
Methodology differs across measures
Core can understate the cost pressure households feel
Use core as a second opinion on the full number, never a replacement. Fed research has flagged the same weakness: exclusion-based measures catch the trend only imperfectly.
How Traders Can Interpret Core and Headline Inflation
Picture two releases. In the first, headline jumps on an oil spike while core sits still. In the second, core climbs in rent, services and goods, everywhere at once. Same scary headline, very different story. That's why you look past the level: where does the move come from, how long has it lasted, how widely does it spread? And no, neither number is a standalone signal for rates, bonds, currencies or stocks.
Risk Disclaimer: Trading involves significant risk of capital loss. This article is for educational purposes only and does not constitute financial advice. Always conduct independent research and consider your risk tolerance before making any trading decisions.
See more:Glossary