What Are Chartists and How Do They Use Technical Analysis?
Chartists make trading decisions from price charts. They don't start with earnings reports or economic data. They start with what price has already done and ask what it might do next.

Who Are Chartists: Definition
So, what is a chartist? It's a trader or analyst who reads price charts to decide when to buy and sell. The term overlaps with technical analyst, and many people use the two as synonyms.
Chartists study how price and volume behave over time. They look for trends, turning points and shapes that repeat. Most work with candlestick or bar charts, which show the open, high, low and close for each period. If candlesticks are new to you, this guide to candlestick trading charts is a good place to start.
The approach is old. Charles Dow laid much of the groundwork around 1900, and Japanese rice traders used early candlestick methods in the 1700s.
The Core Assumption Behind Chartism
Chartism rests on one big idea: past price behavior can help you anticipate future moves. Behind it sit three working beliefs.
Price reflects everything. News, expectations and fear are assumed to be priced in already.
Prices move in trends. A trend is expected to continue until there's evidence it has ended.
History tends to repeat. Crowds react in similar ways, so similar shapes can show up again.
These are assumptions, not laws. Supporters of the efficient market hypothesis argue that past prices alone can't deliver consistent excess returns. Chart signals fail often, so treat them as probabilities.
Main Technical Analysis Tools Chartists Use
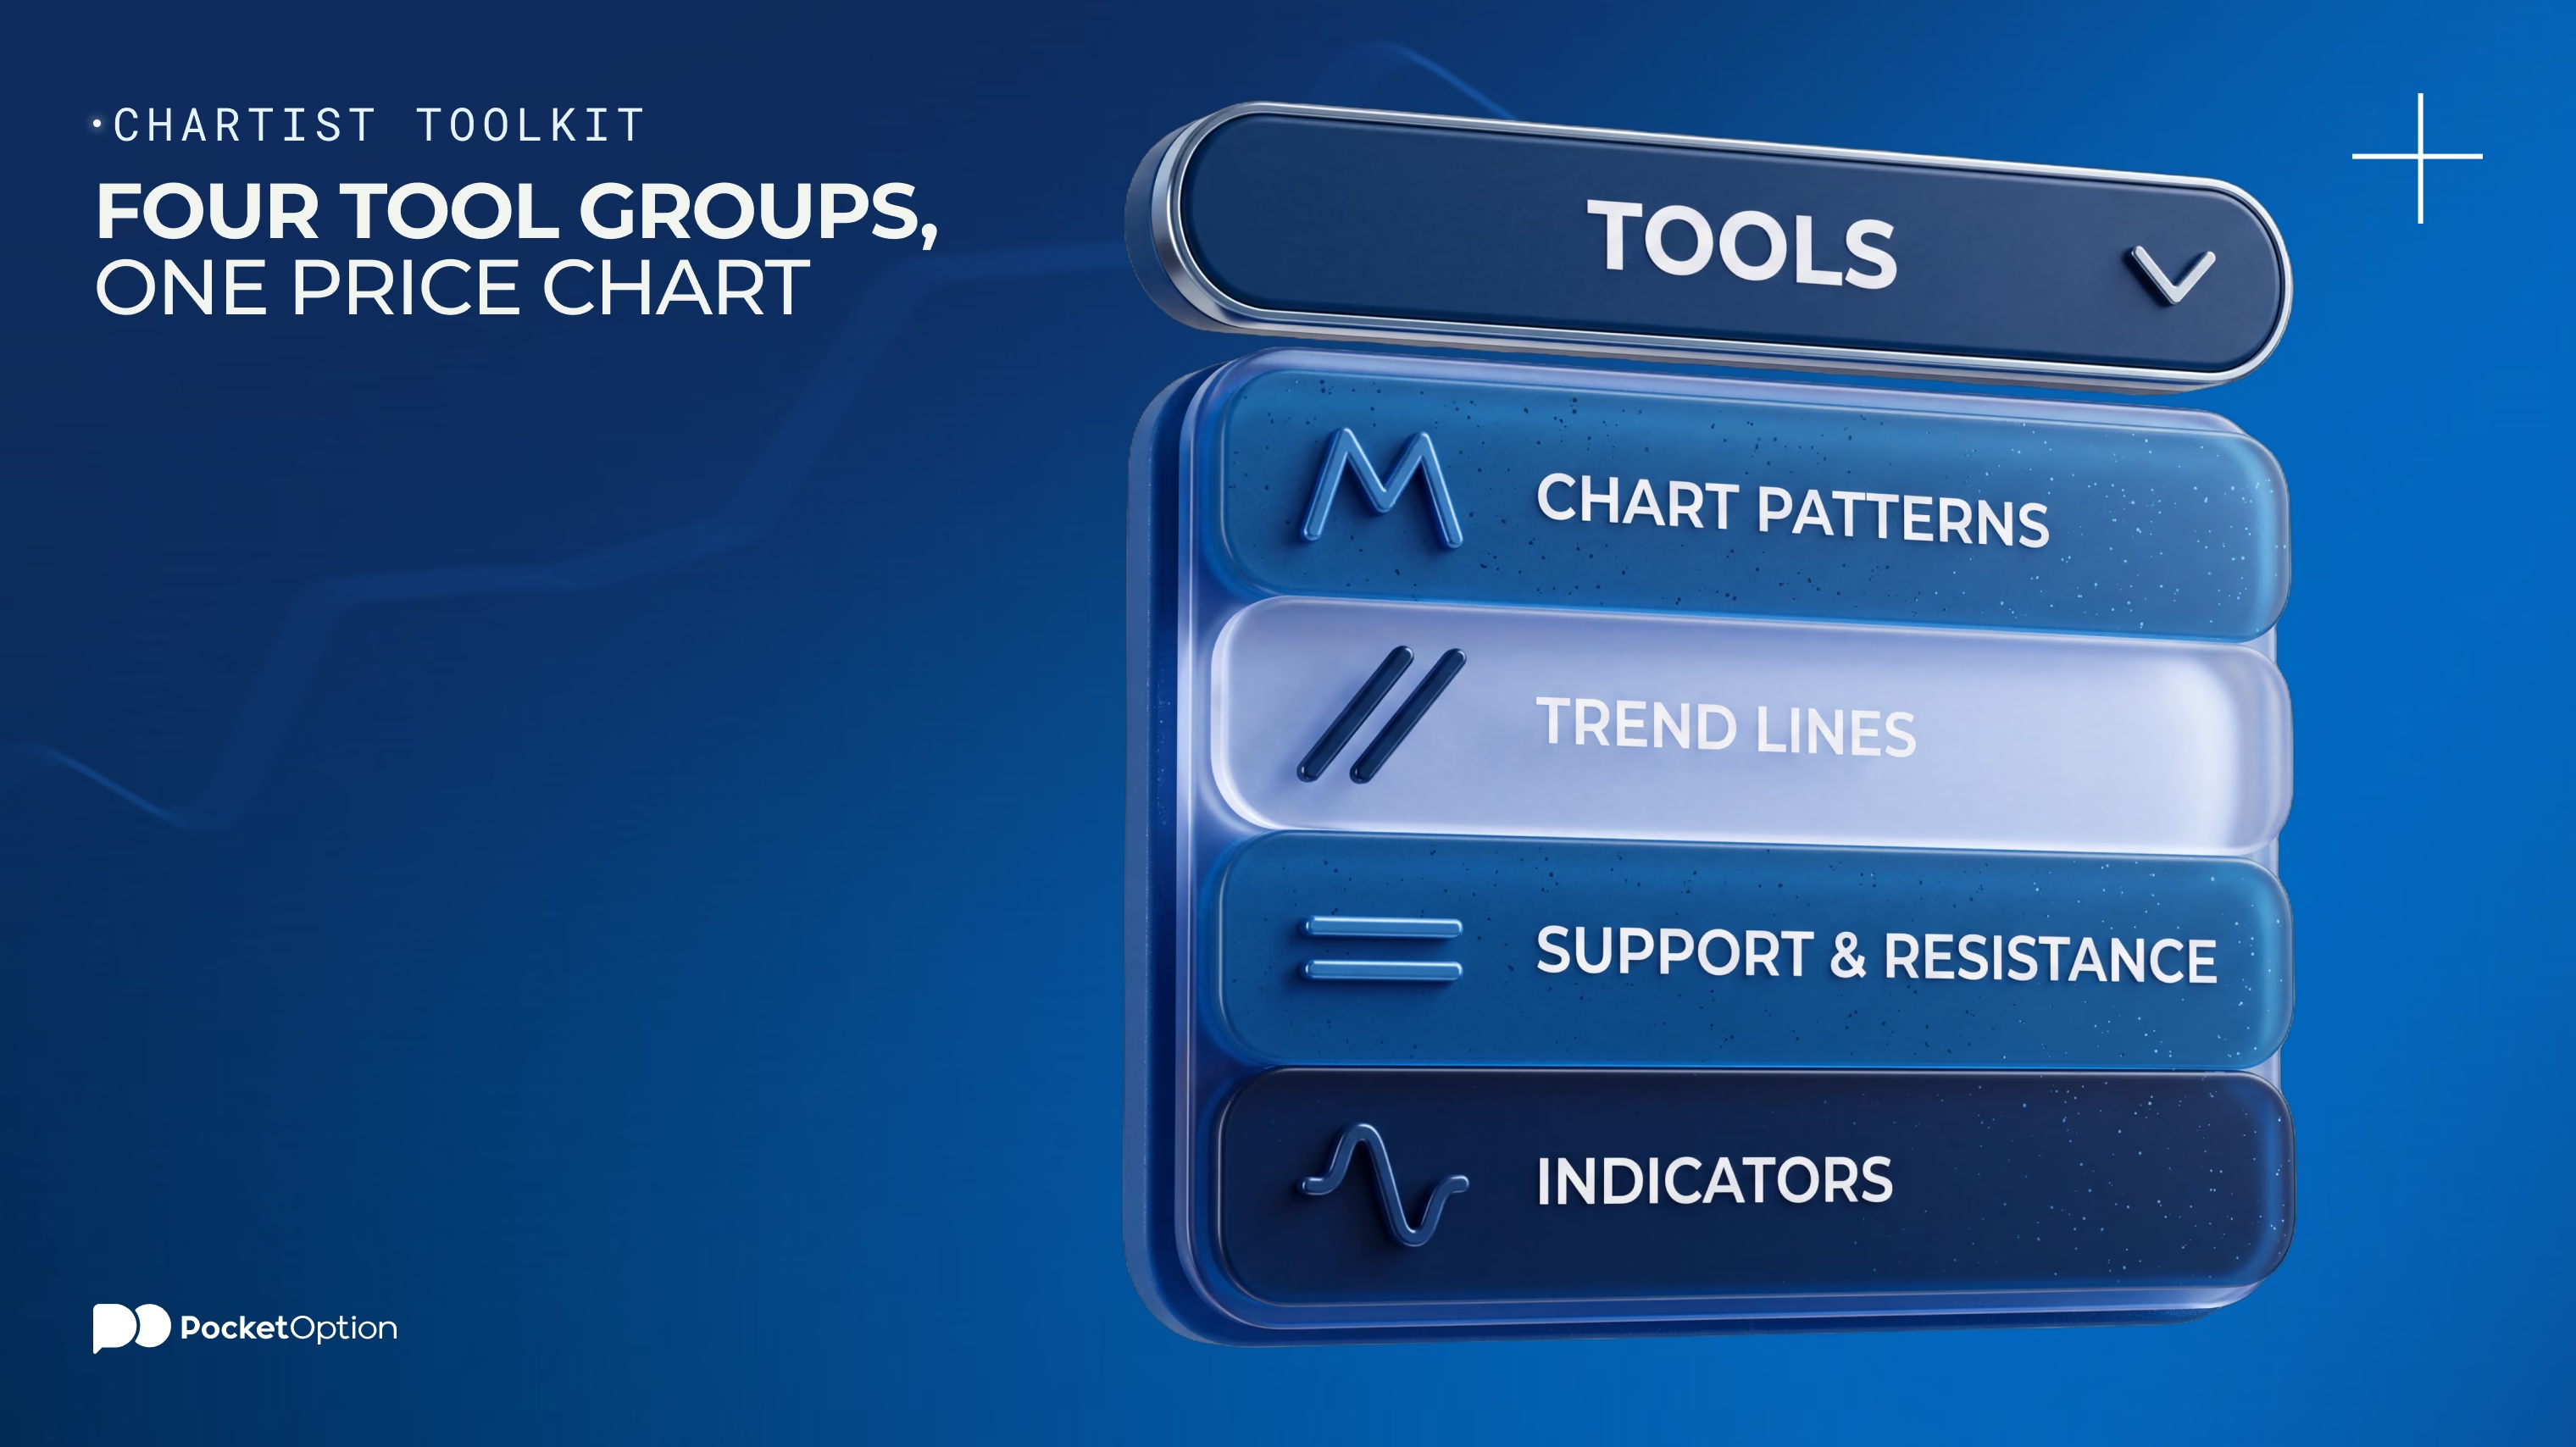
Chartists rely on a handful of technical analysis tools. Most fit into four groups:
Tool | What it shows | Examples |
|---|---|---|
Chart patterns | Shapes that hint at continuation or reversal | Head and shoulders, double top, triangles, flags |
Trend lines and channels | Direction and slope of a move | Rising trend line, parallel channel |
Support and resistance | Areas where buying or selling appeared before | Prior highs and lows, round numbers |
Indicators | Calculations based on price or volume | Moving averages, RSI, MACD |
Chart patterns get the most attention. Some form in hours, while others take weeks. Slow, curved reversals are one example, and this breakdown of rounding top and rounding bottom patterns shows how traders read them. No single tool is enough on its own, so chartists usually look for several signals pointing the same way.
Chartists vs Fundamental Analysts
The chartist vs fundamental analyst question comes down to inputs. A chartist looks at price and volume. A fundamental analyst looks at the business or economy behind the price, such as earnings, debt, interest rates and industry trends.
The goals differ too. A fundamental analyst tries to estimate what an asset is worth. A chartist cares more about timing: when to enter and when to exit. Fundamental work often suits longer holding periods, while chart reading is common in short-term trading. For the bigger picture of how share prices form, this simple explanation of how the stock market works covers the basics.
Can Chartists Also Use Fundamental Analysis
Yes, and many do. Some traders use fundamentals to choose what to trade and charts to decide when. Others simply check the economic calendar so a big data release doesn't catch them off guard.
Mixing methods can help, but it can also confuse. If the two disagree, you need a rule for which one wins. Set that rule before you trade, not in the middle of a move.
Spot the patterns on live charts.
Get StartedConclusion
Chartists bet that price history holds useful clues. Their tools are ways to organize those clues, and they can help with timing and risk planning. They can't promise an outcome, so pair any chart signal with a clear stop and a position size you can afford to lose.
Disclaimer: Trading involves significant risk of capital loss and may not be suitable for all investors. Past performance does not guarantee future results.
See more:Glossary