434
 Albert RobertsonBearish
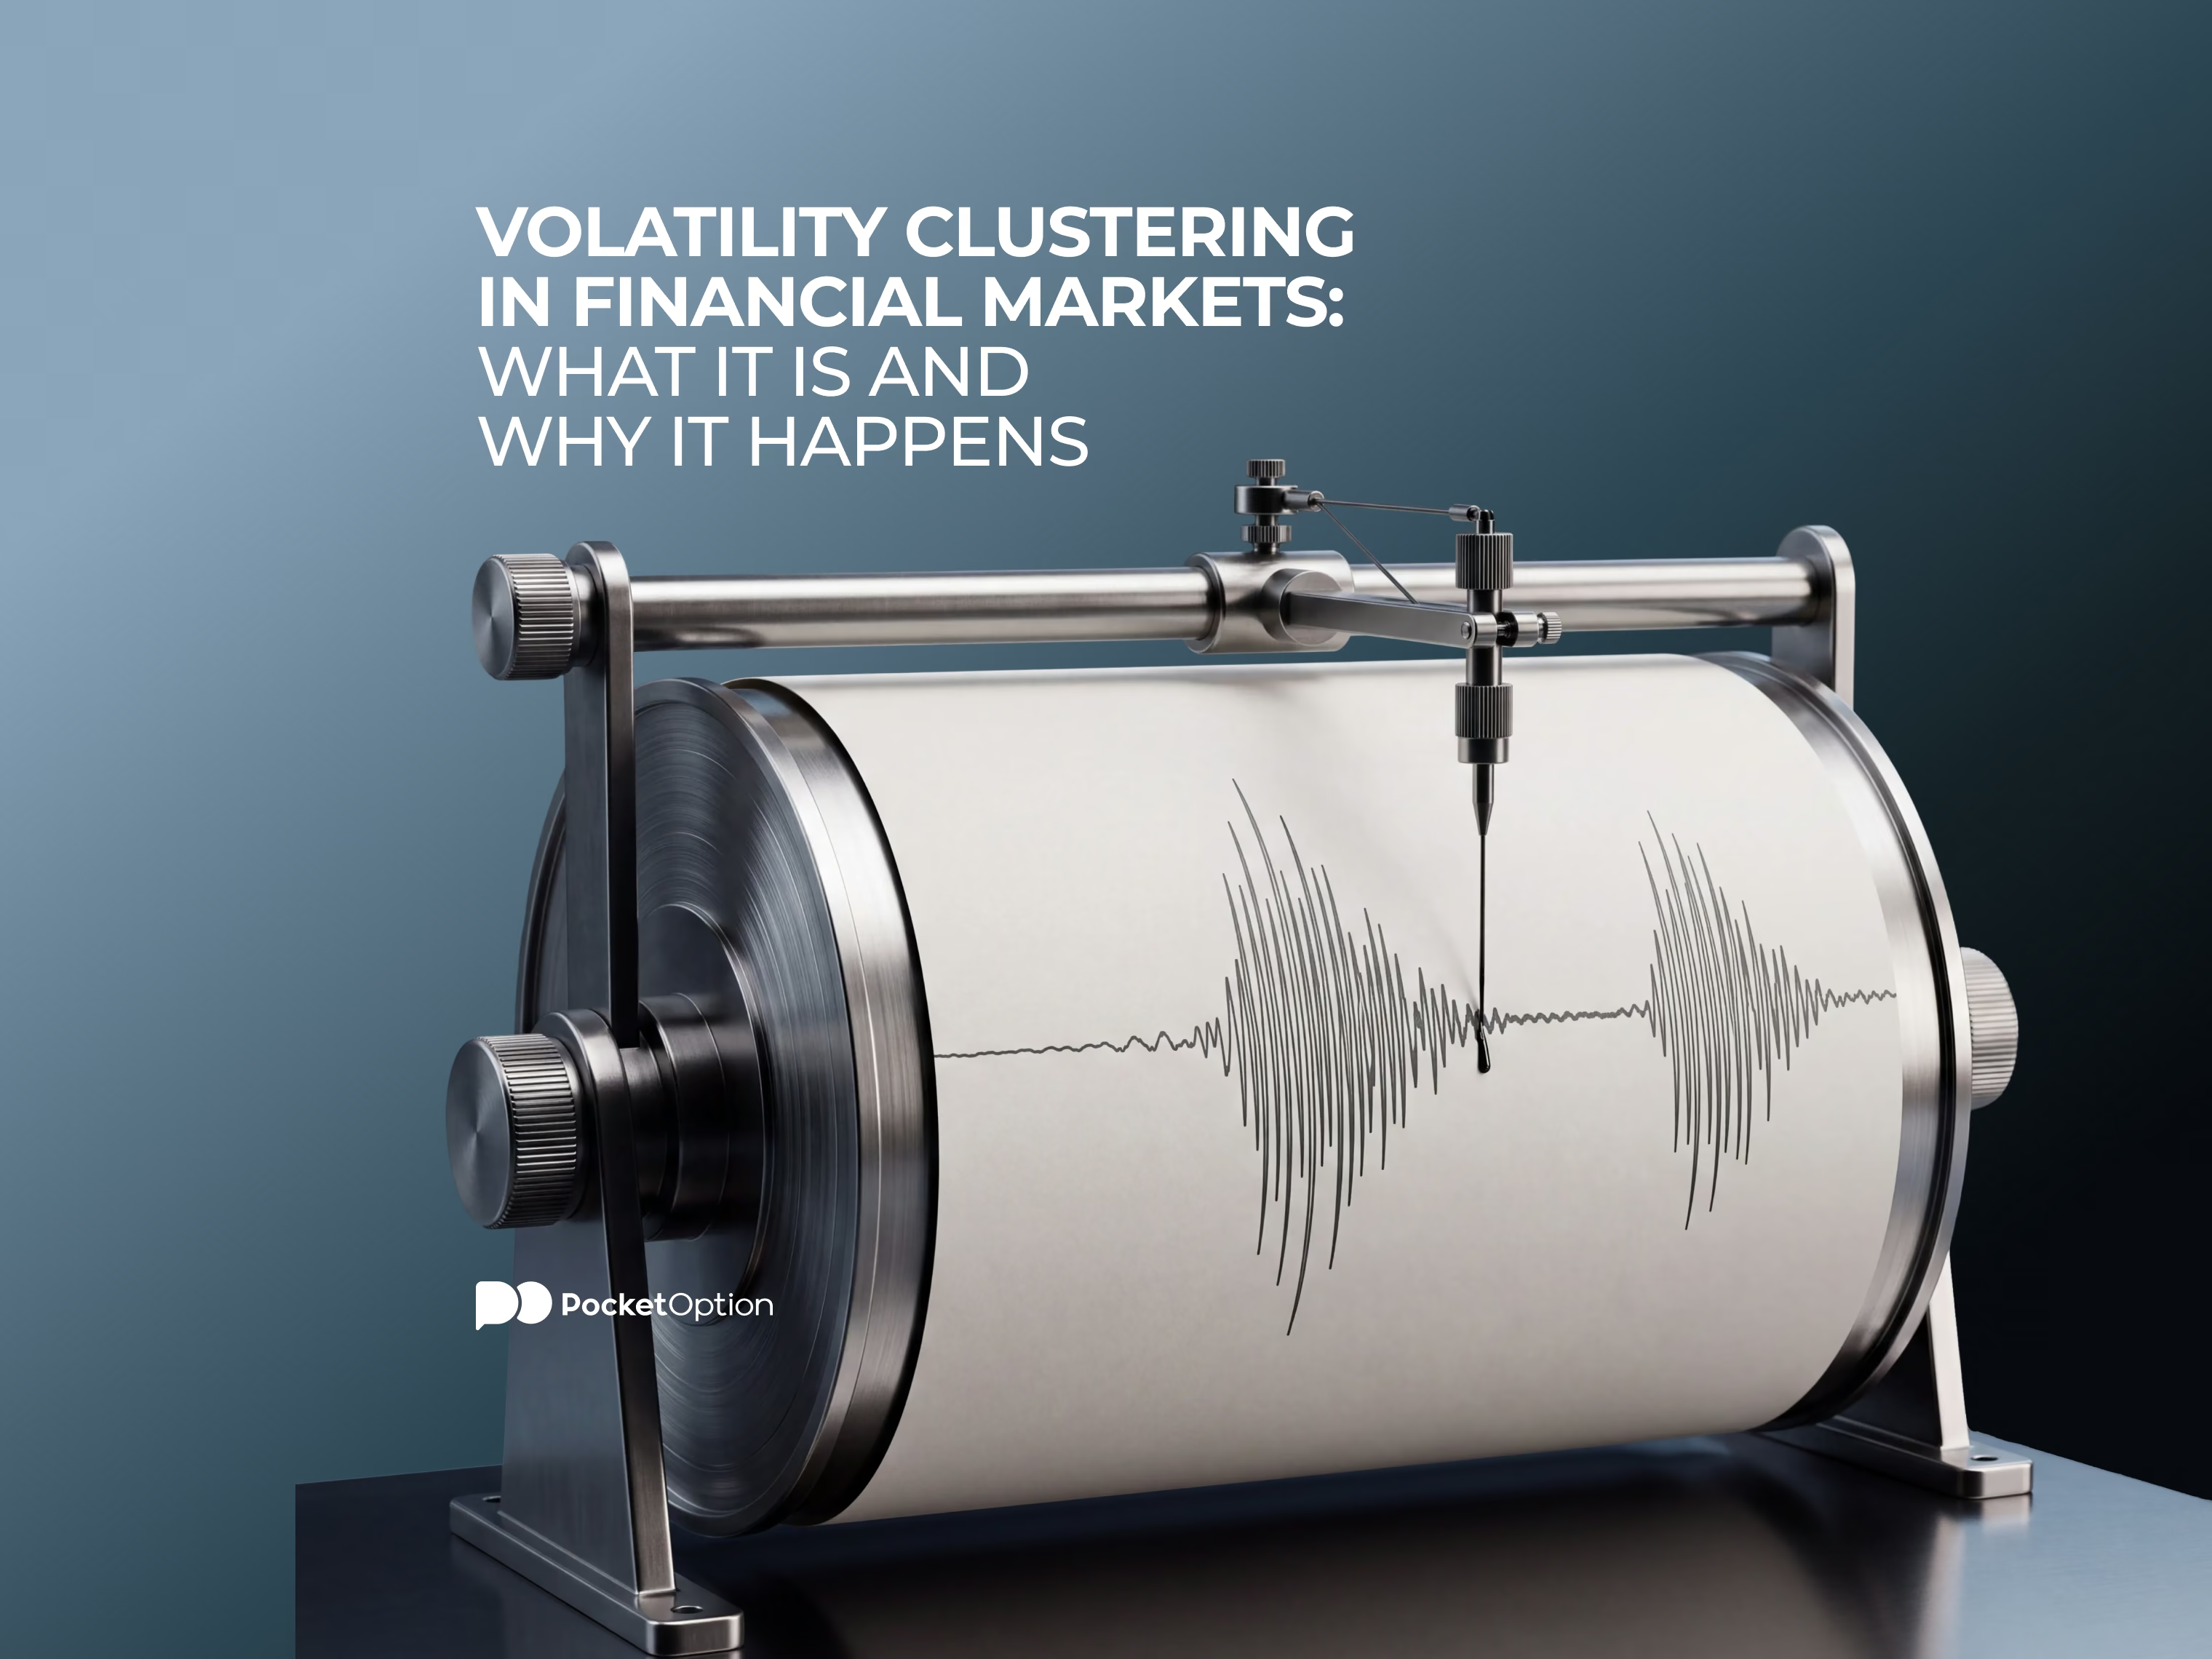
Volatility clustering describes how periods of large price changes and calm periods with small changes each tend to group together over time. This guide explains why the pattern happens, how it differs from a single volatility spike, how ARCH and GARCH models capture it, and what it means for assessing risk.
 Albert RobertsonBearish
Leading indicators try to flag a possible shift in momentum or direction before it fully shows up in price, while lagging indicators confirm a move after it's already underway. This guide covers how each type works, common examples like RSI and MACD, and why traders often combine both.
 Albert RobertsonBearish
PCE and CPI both track US consumer inflation, but differ in coverage, weighting, and data sources. This guide covers what each index measures, why their values can diverge, and why the Fed relies on PCE for its long-run inflation goal.



 Albert RobertsonBearish
Two assets can look similarly risky on paper, but be nothing of the sort in reality. Standard deviation counts the wobble, but pays no mind to the size of the thing doing the ‘wobbling’. That’s where a coefficient of variation (CV) is useful. It puts the risk and reward in one fraction, and might help your trading or investing.
 Diego FernándezBearish
An investment fund promises an average annual return of 12%. After five years, you have 10,000 growing to 15,470. Both figures are correct and refer to the same investment. The discrepancy between them is 2,150 and figuring out where it comes from is the key idea of this article.
 Albert RobertsonBearish
How much selling can a company get, out of the stuff that it owns? This is the question people ask when they determine the asset turnover ratio. On the surface, it’s a single line of arithmetic, but in reality, it can easily determine the direction of an investment or a trade.
 Eric BriggsBearish
Two tickers, one project, and no end of old pages nobody ever went back and put right. That is the bulk of the muddle behind what is RNDR crypto. RENDER is the project running the show presently, over on Solana network. RNDR is the Ethereum one it came out of.
 Diego FernándezBearish
With three numbers and one line of mathematics you get the value of a share. That is the appeal. Problem is, changing one of those three numbers by one percentage point can change the answer by a third and nothing in the formula warns you about it. In this article we will analyze the formula and demonstrate why it is extremely unstable.
 Diego FernándezBearish
Some industries are profitable by their nature whereas others tend to struggle despite good management. The reason behind this phenomenon lies in the structural nature of industries and not in their management. This model is used to identify the structure of an industry. It breaks down an industry into five competitive forces and measures the intensity of these factors.
 Albert RobertsonBearish
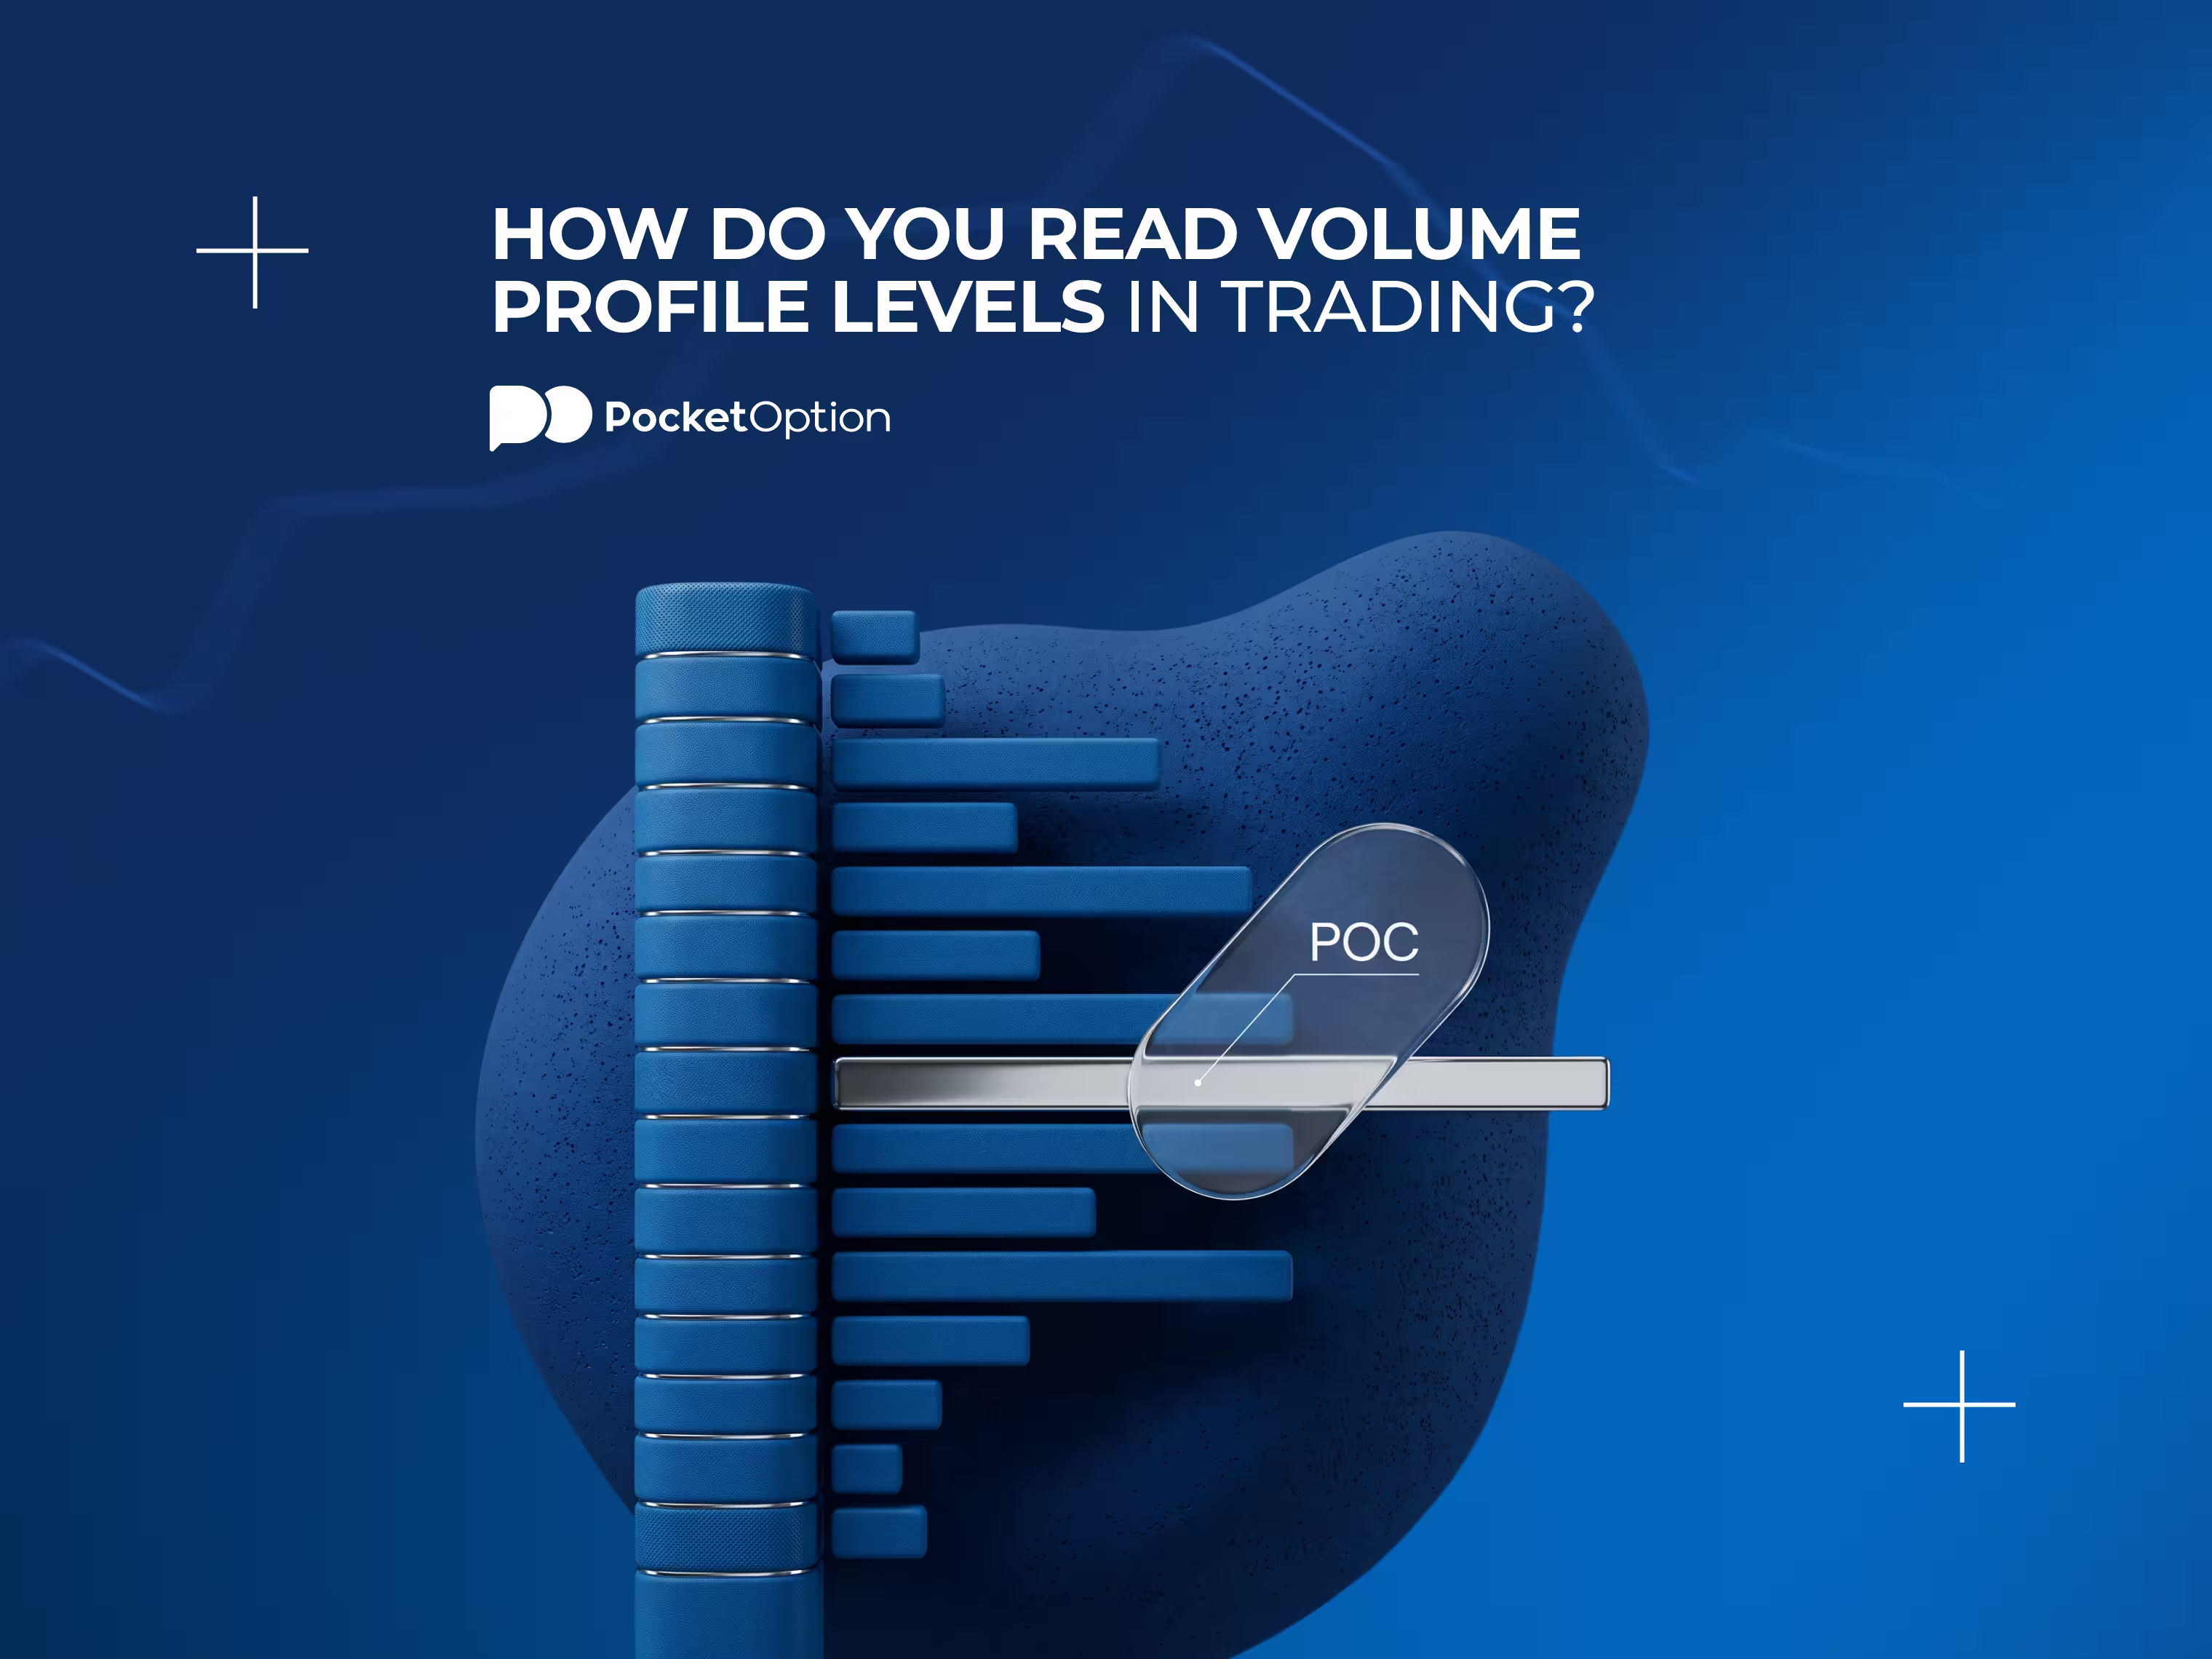
Volume profile shows which price levels saw the most trading activity during a chosen period, not just when trading happened. This guide covers POC, Value Area, HVN, LVN, and where these levels can mislead you.
 Albert RobertsonBearish
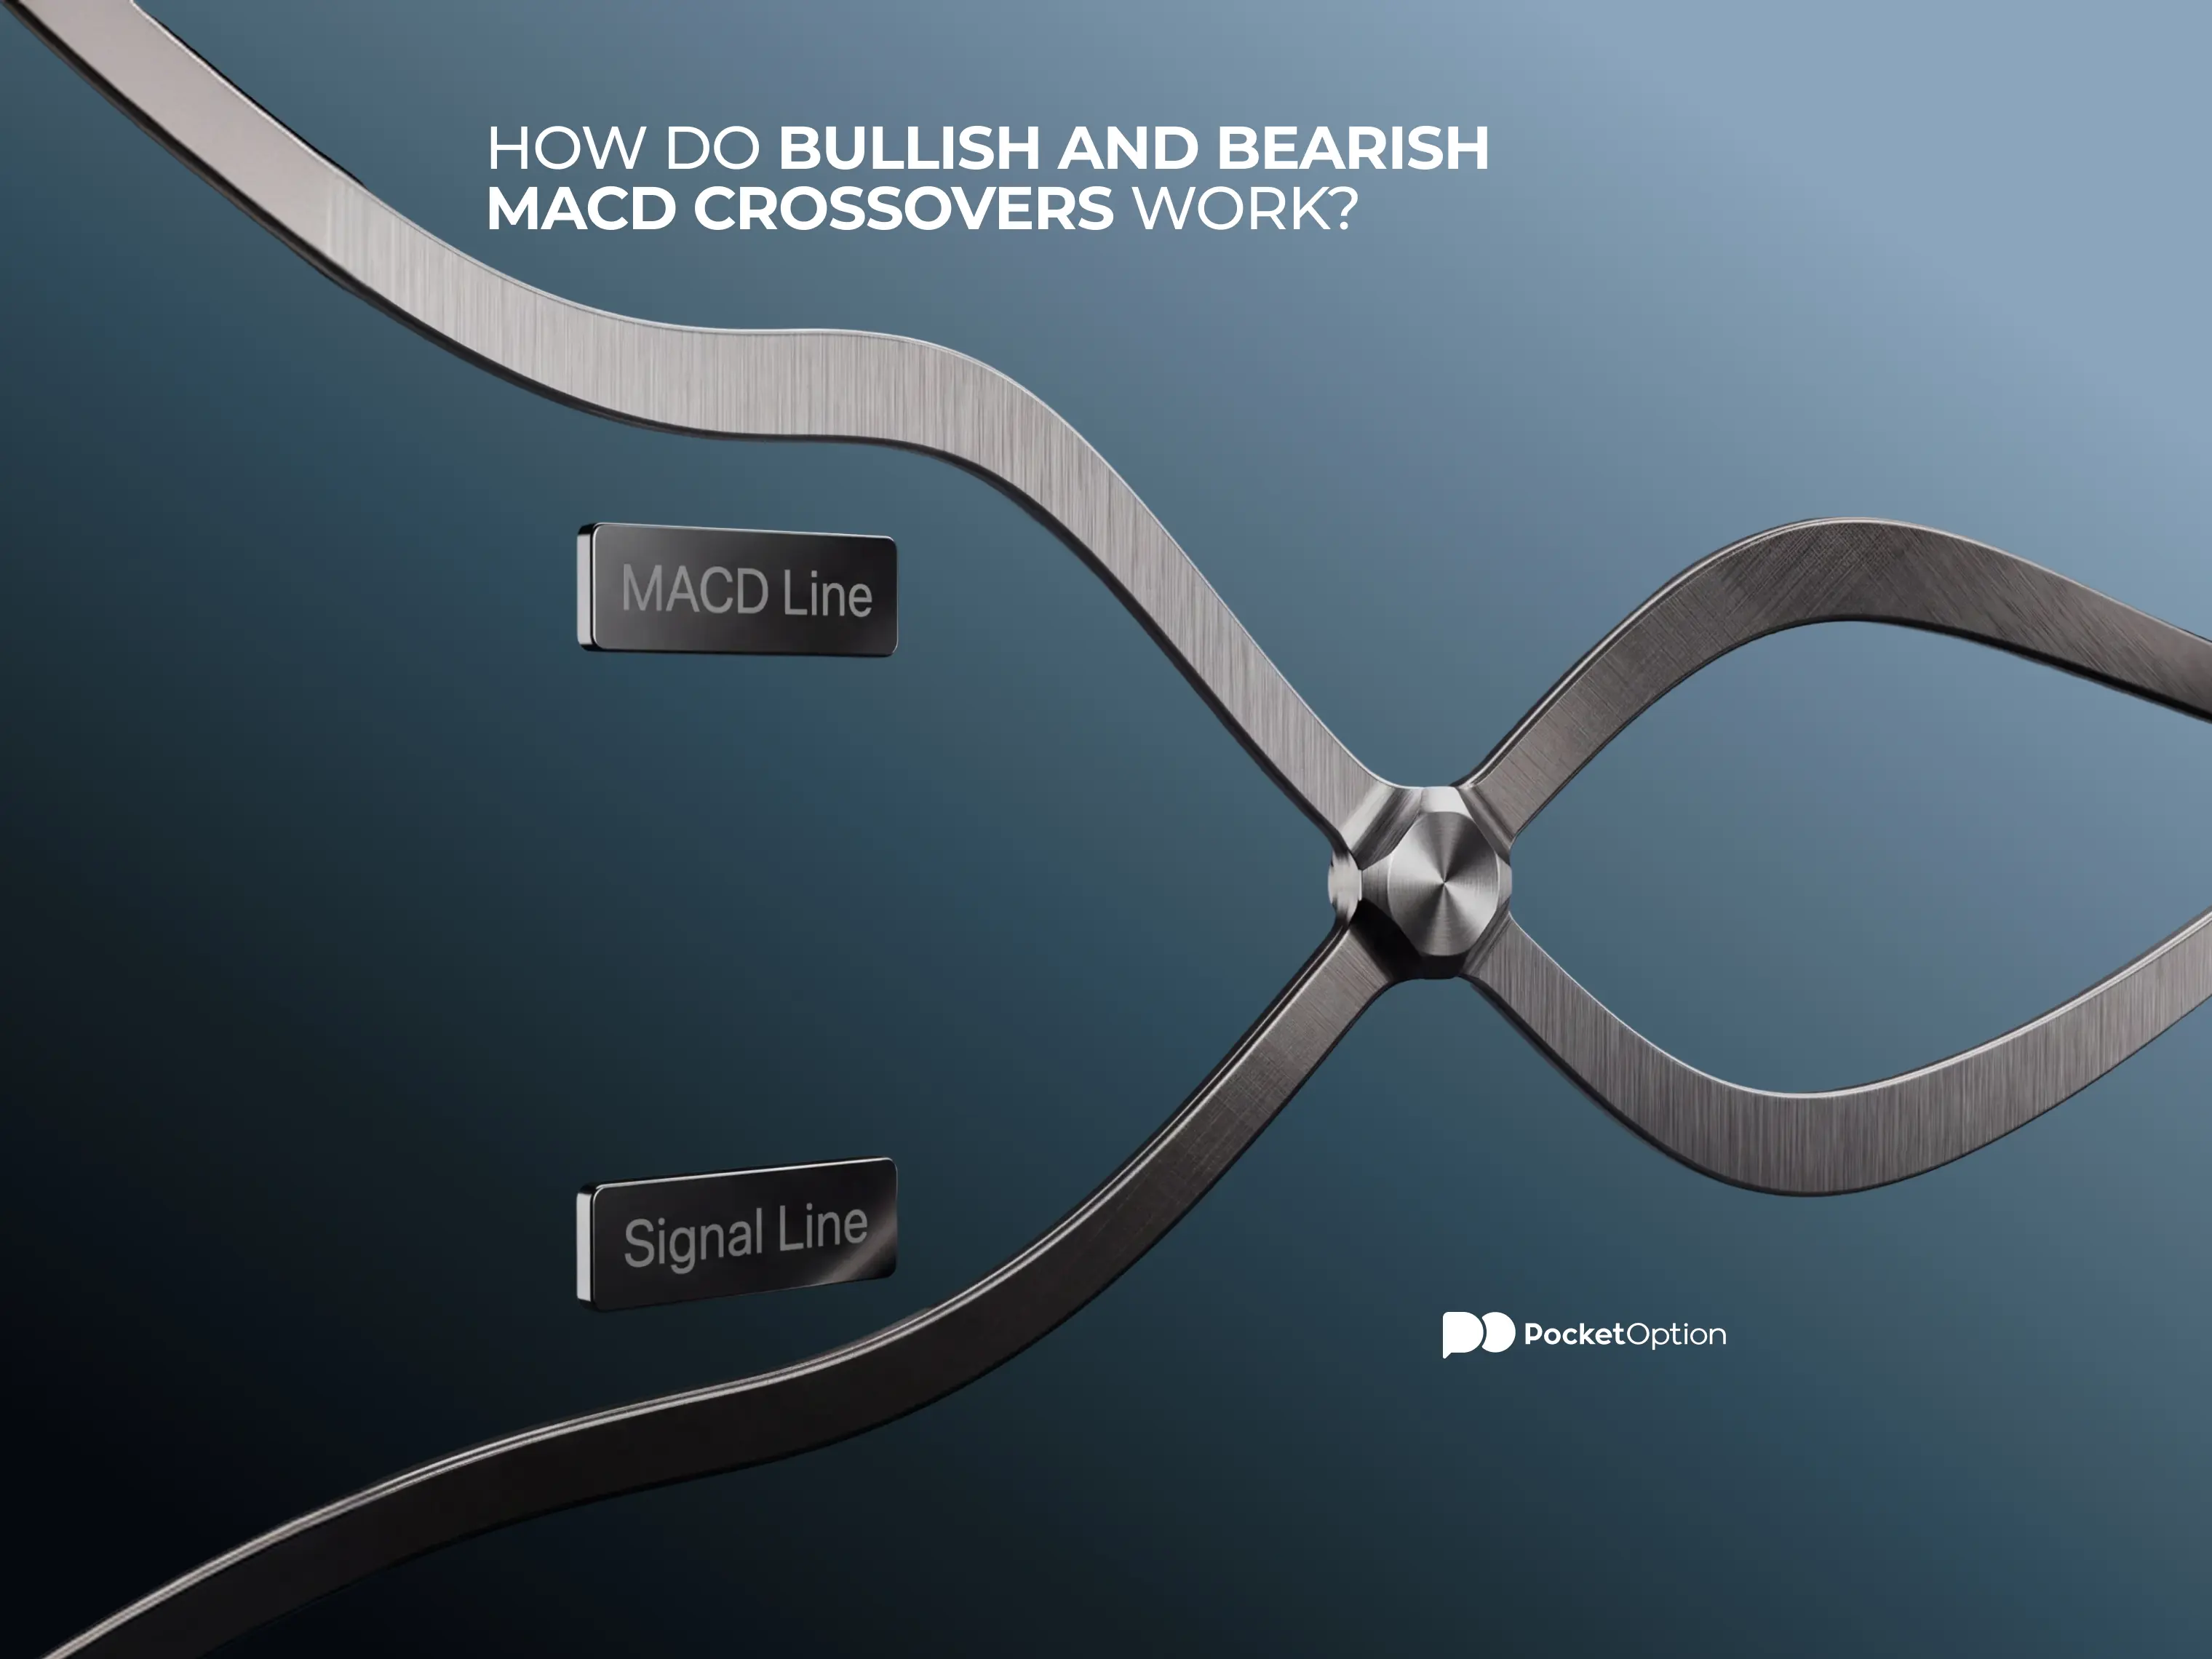
A macd trading strategy built around crossovers means reading each cross as a shift in momentum context, not a guaranteed signal. This guide covers bullish and bearish crossovers, why zero line position matters, and how to weigh a cross against trend and price structure.
 Albert RobertsonBearish
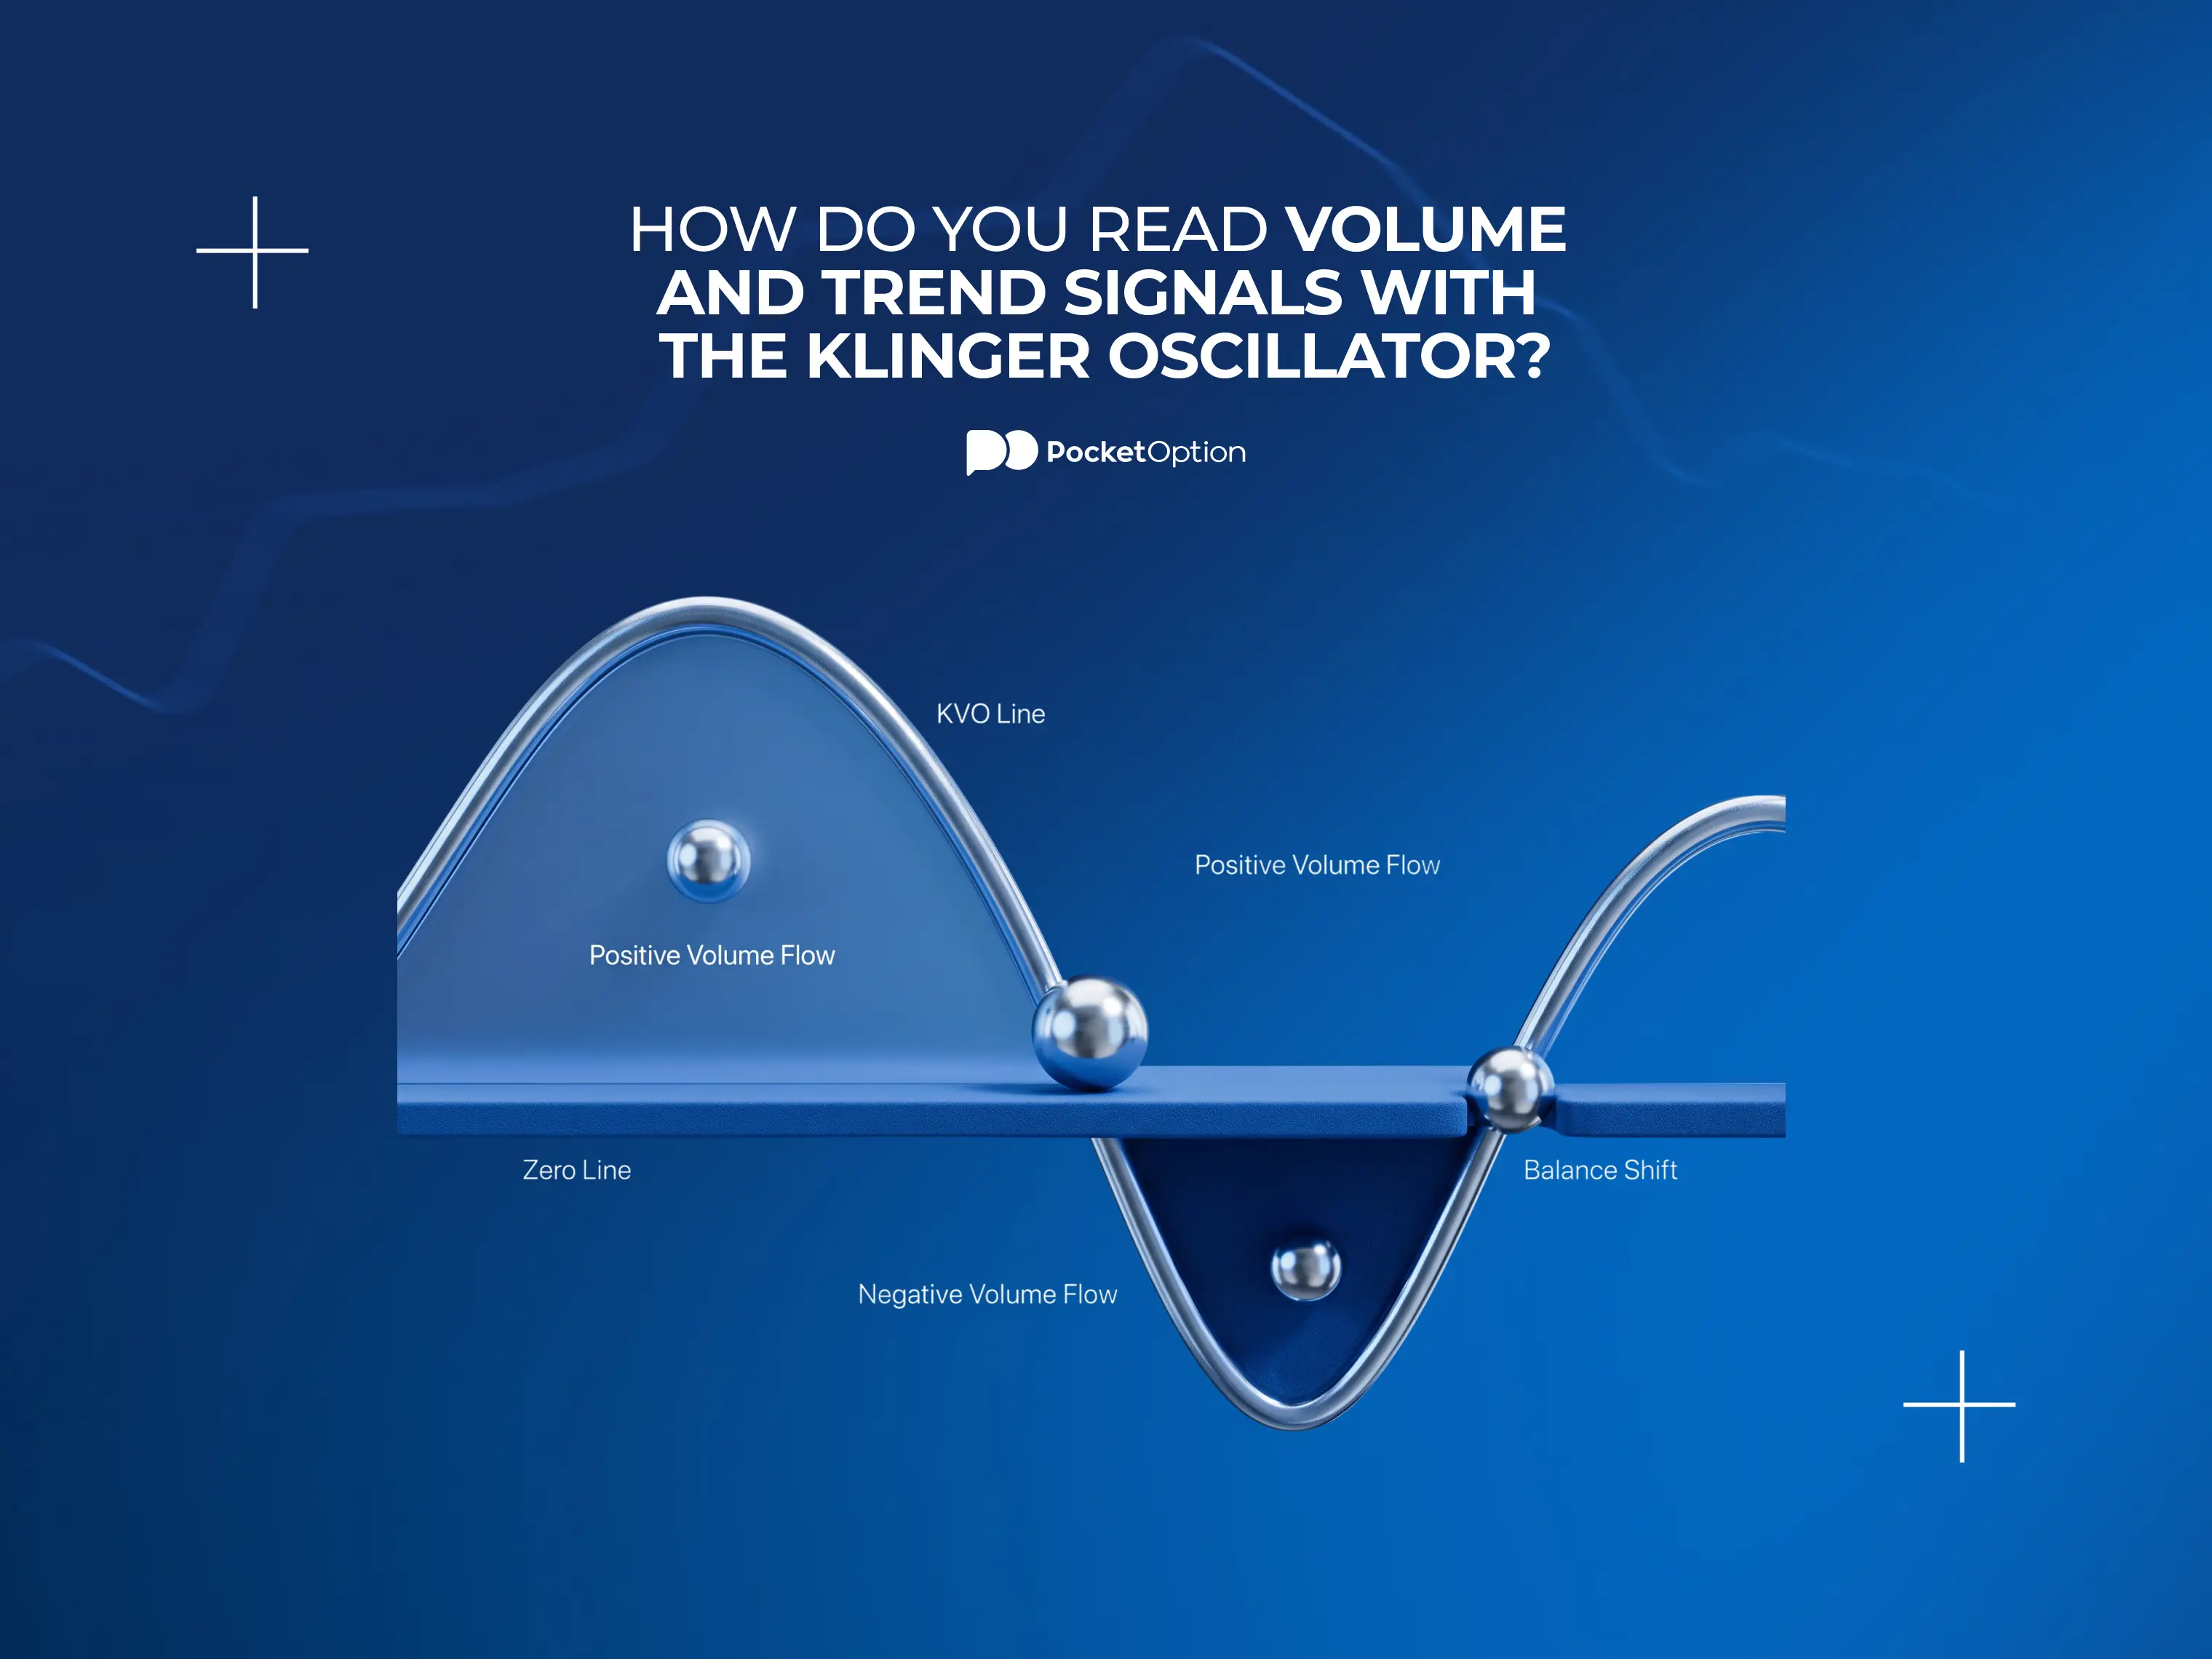
The Klinger oscillator combines price movement and volume into one reading of volume flow. This guide covers Volume Force, signal-line crossovers, zero-line context, divergence, and its limits.