


News
StreamsEventsMedia
Streams
News
HumorDataSignals
CryptoEducationGEOPlatform updatesProduct GuidesPsychologyGlossary
LearningRegulation and safetyCalculatorsTradingMarkets
Trading StrategiesBonuses and promotionsTrading platformsReviews
Risk warning:

Investing in financial products involves risks. Past performance does not guarantee future returns, and values may fluctuate due to market conditions and changes in underlying assets. Any forecasts or illustrations are for reference only and are not guarantees. This website does not constitute an invitation or recommendation to invest. Before investing, seek advice from financial, legal, and tax professionals, and assess whether the product suits your goals, risk tolerance, and circumstances. This website does not provide service to residents of the EEA countries, USA, Israel, UK, Philippines, Japan and Brazil.

Risk Disclosure
Copyright ©2026 Pocket Option

Blog

  • 323
  • 441
  • 546
  • 567
  • 355
  • 249
True strength index example
Albert RobertsonBearish
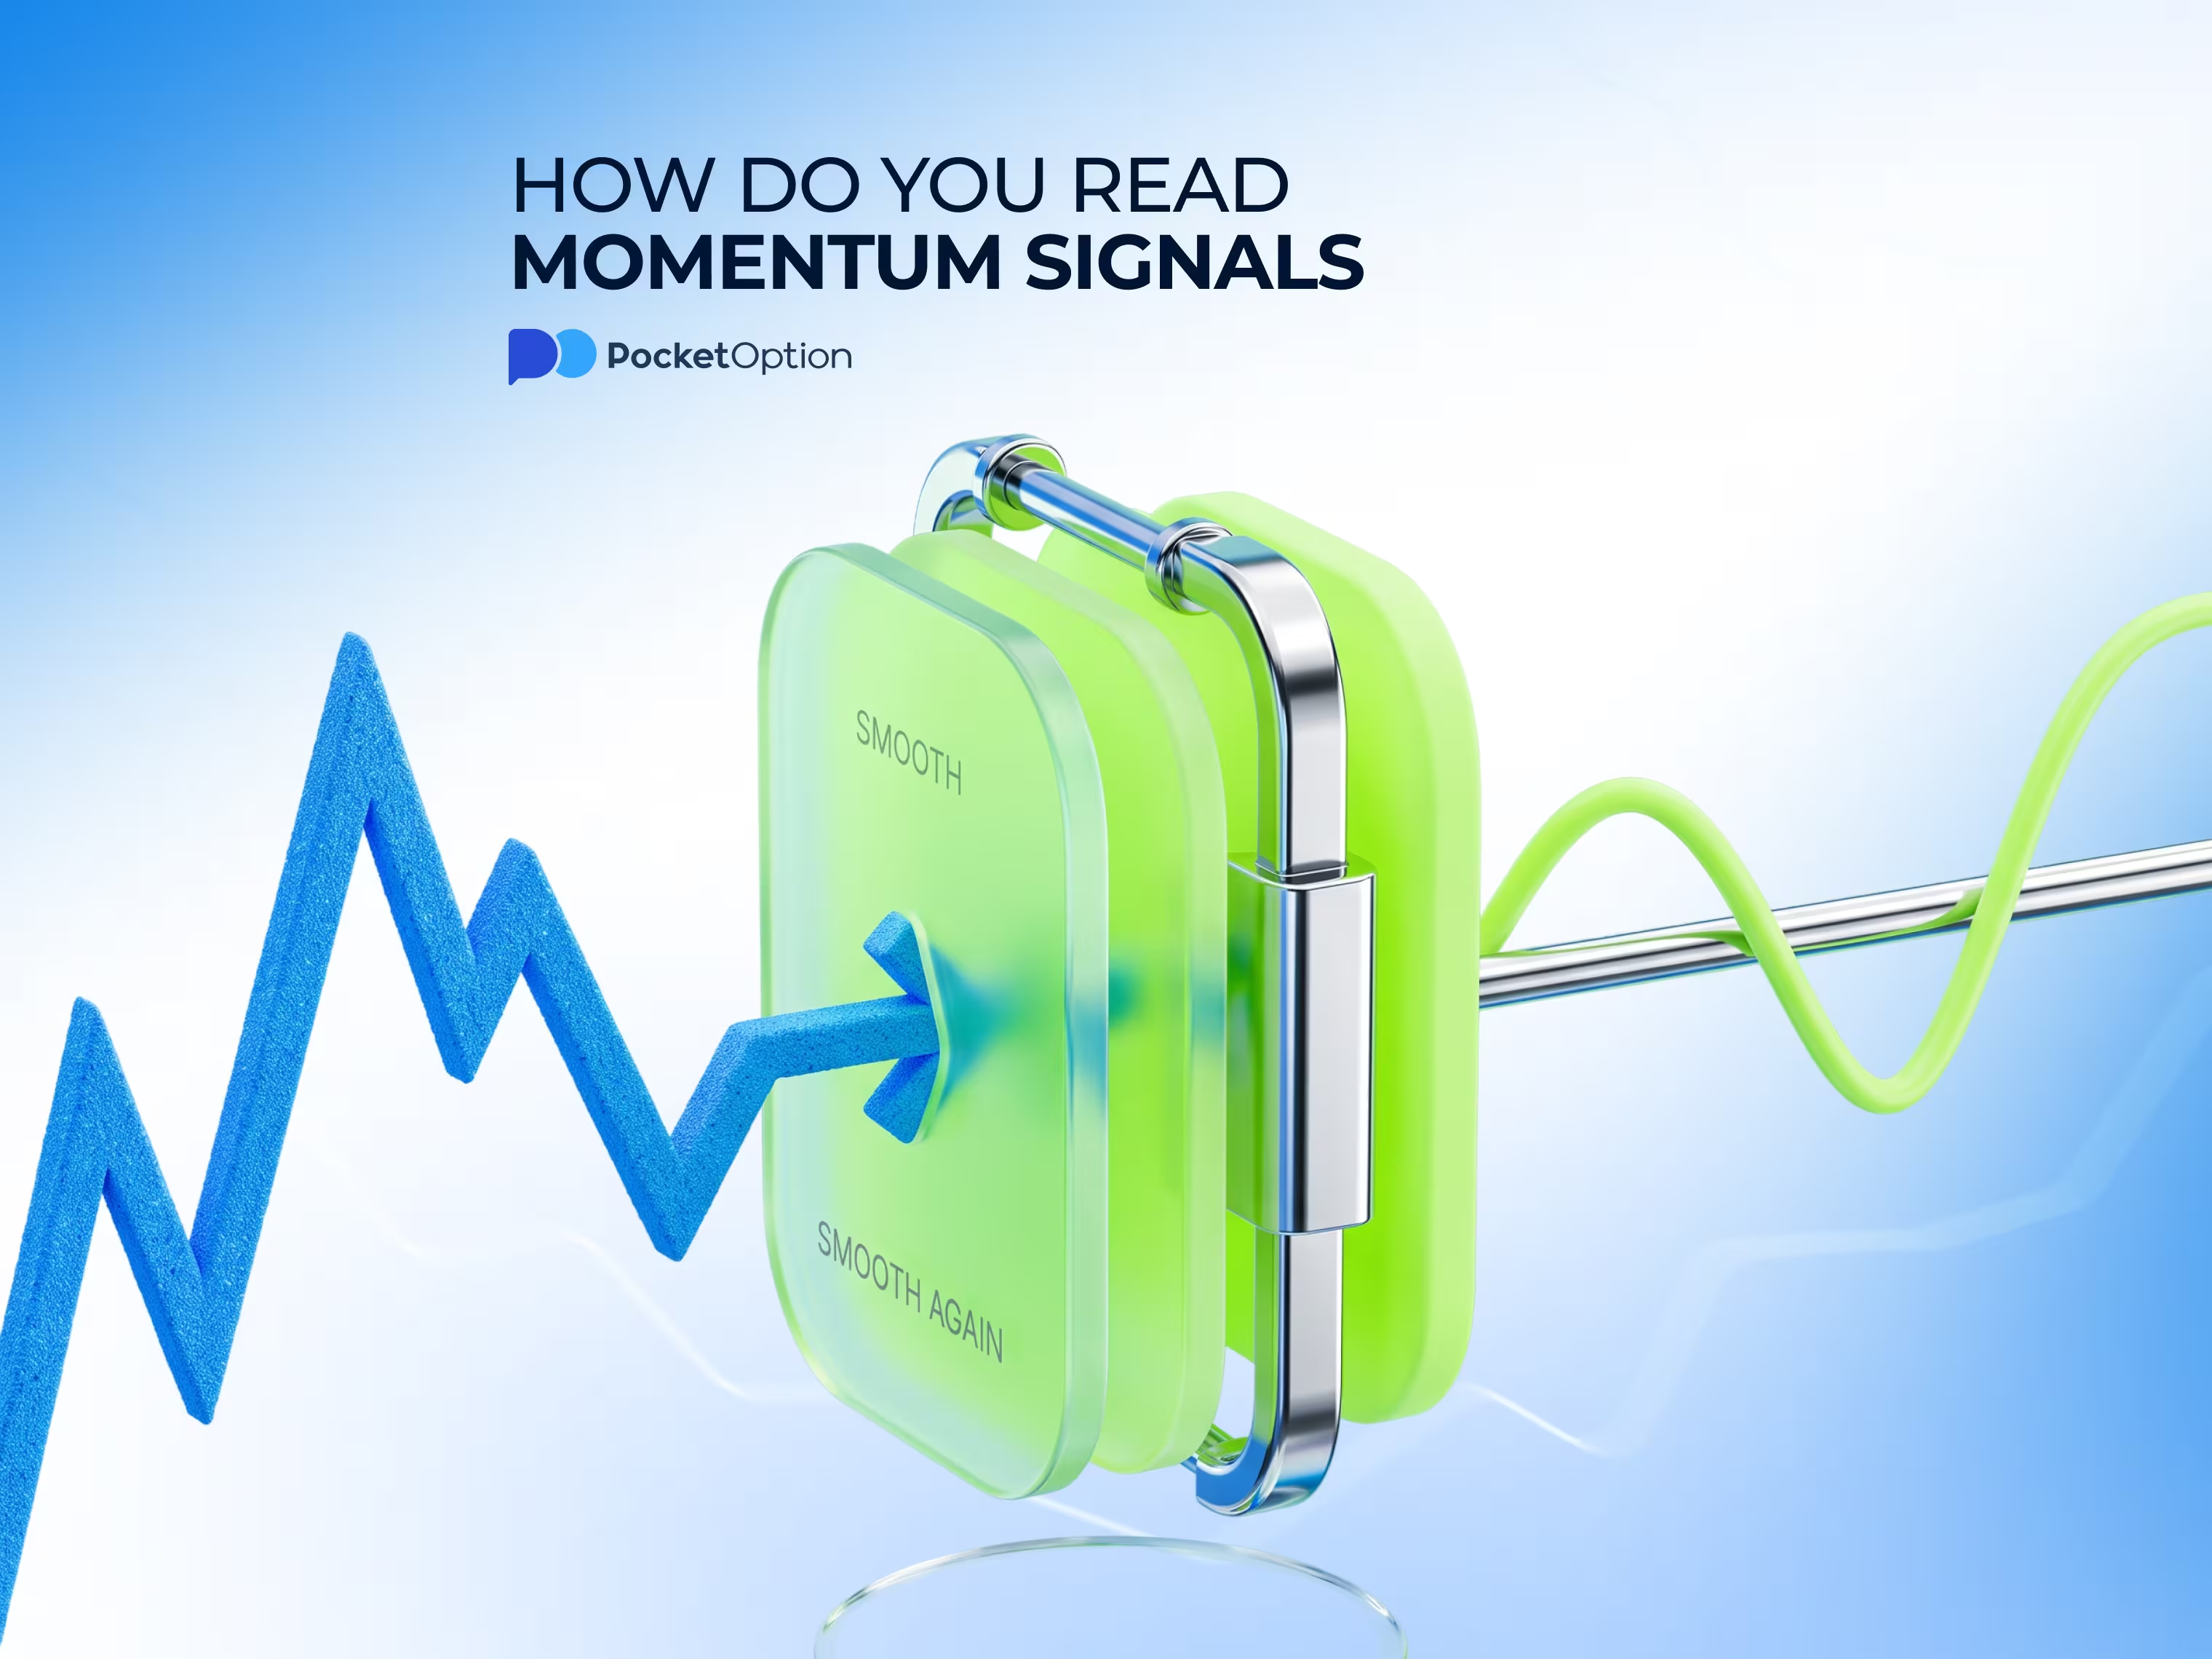
How Do You Read Momentum Signals With the True Strength Index (TSI)?

The true strength index is a momentum oscillator built on double-smoothed price change, oscillating around a zero line. This guide covers the formula, how settings change sensitivity, zero-line and signal-line crossovers, divergence, and its limits.


September 2540
House money effect example
Diego FernándezBearish
How Can the House Money Effect Change Risk-Taking After a Gain?

The house money effect describes how a recent trading gain can change how acceptable further risk feels, rooted in mental accounting and shifting reference points. This guide covers where it comes from, how it differs from other biases, and how to notice it in your own decisions.

September 2550
Currency strength meter example
Albert RobertsonBearish
How Does a Currency Strength Meter Compare Strong and Weak Currencies?

A currency strength meter compares the relative strength and weakness of several currencies at once, based on movement across the pairs connected to each one. This guide covers how it's calculated, how to read the results, and its limits.
September 2540
Bearish signals example
Albert RobertsonBearish
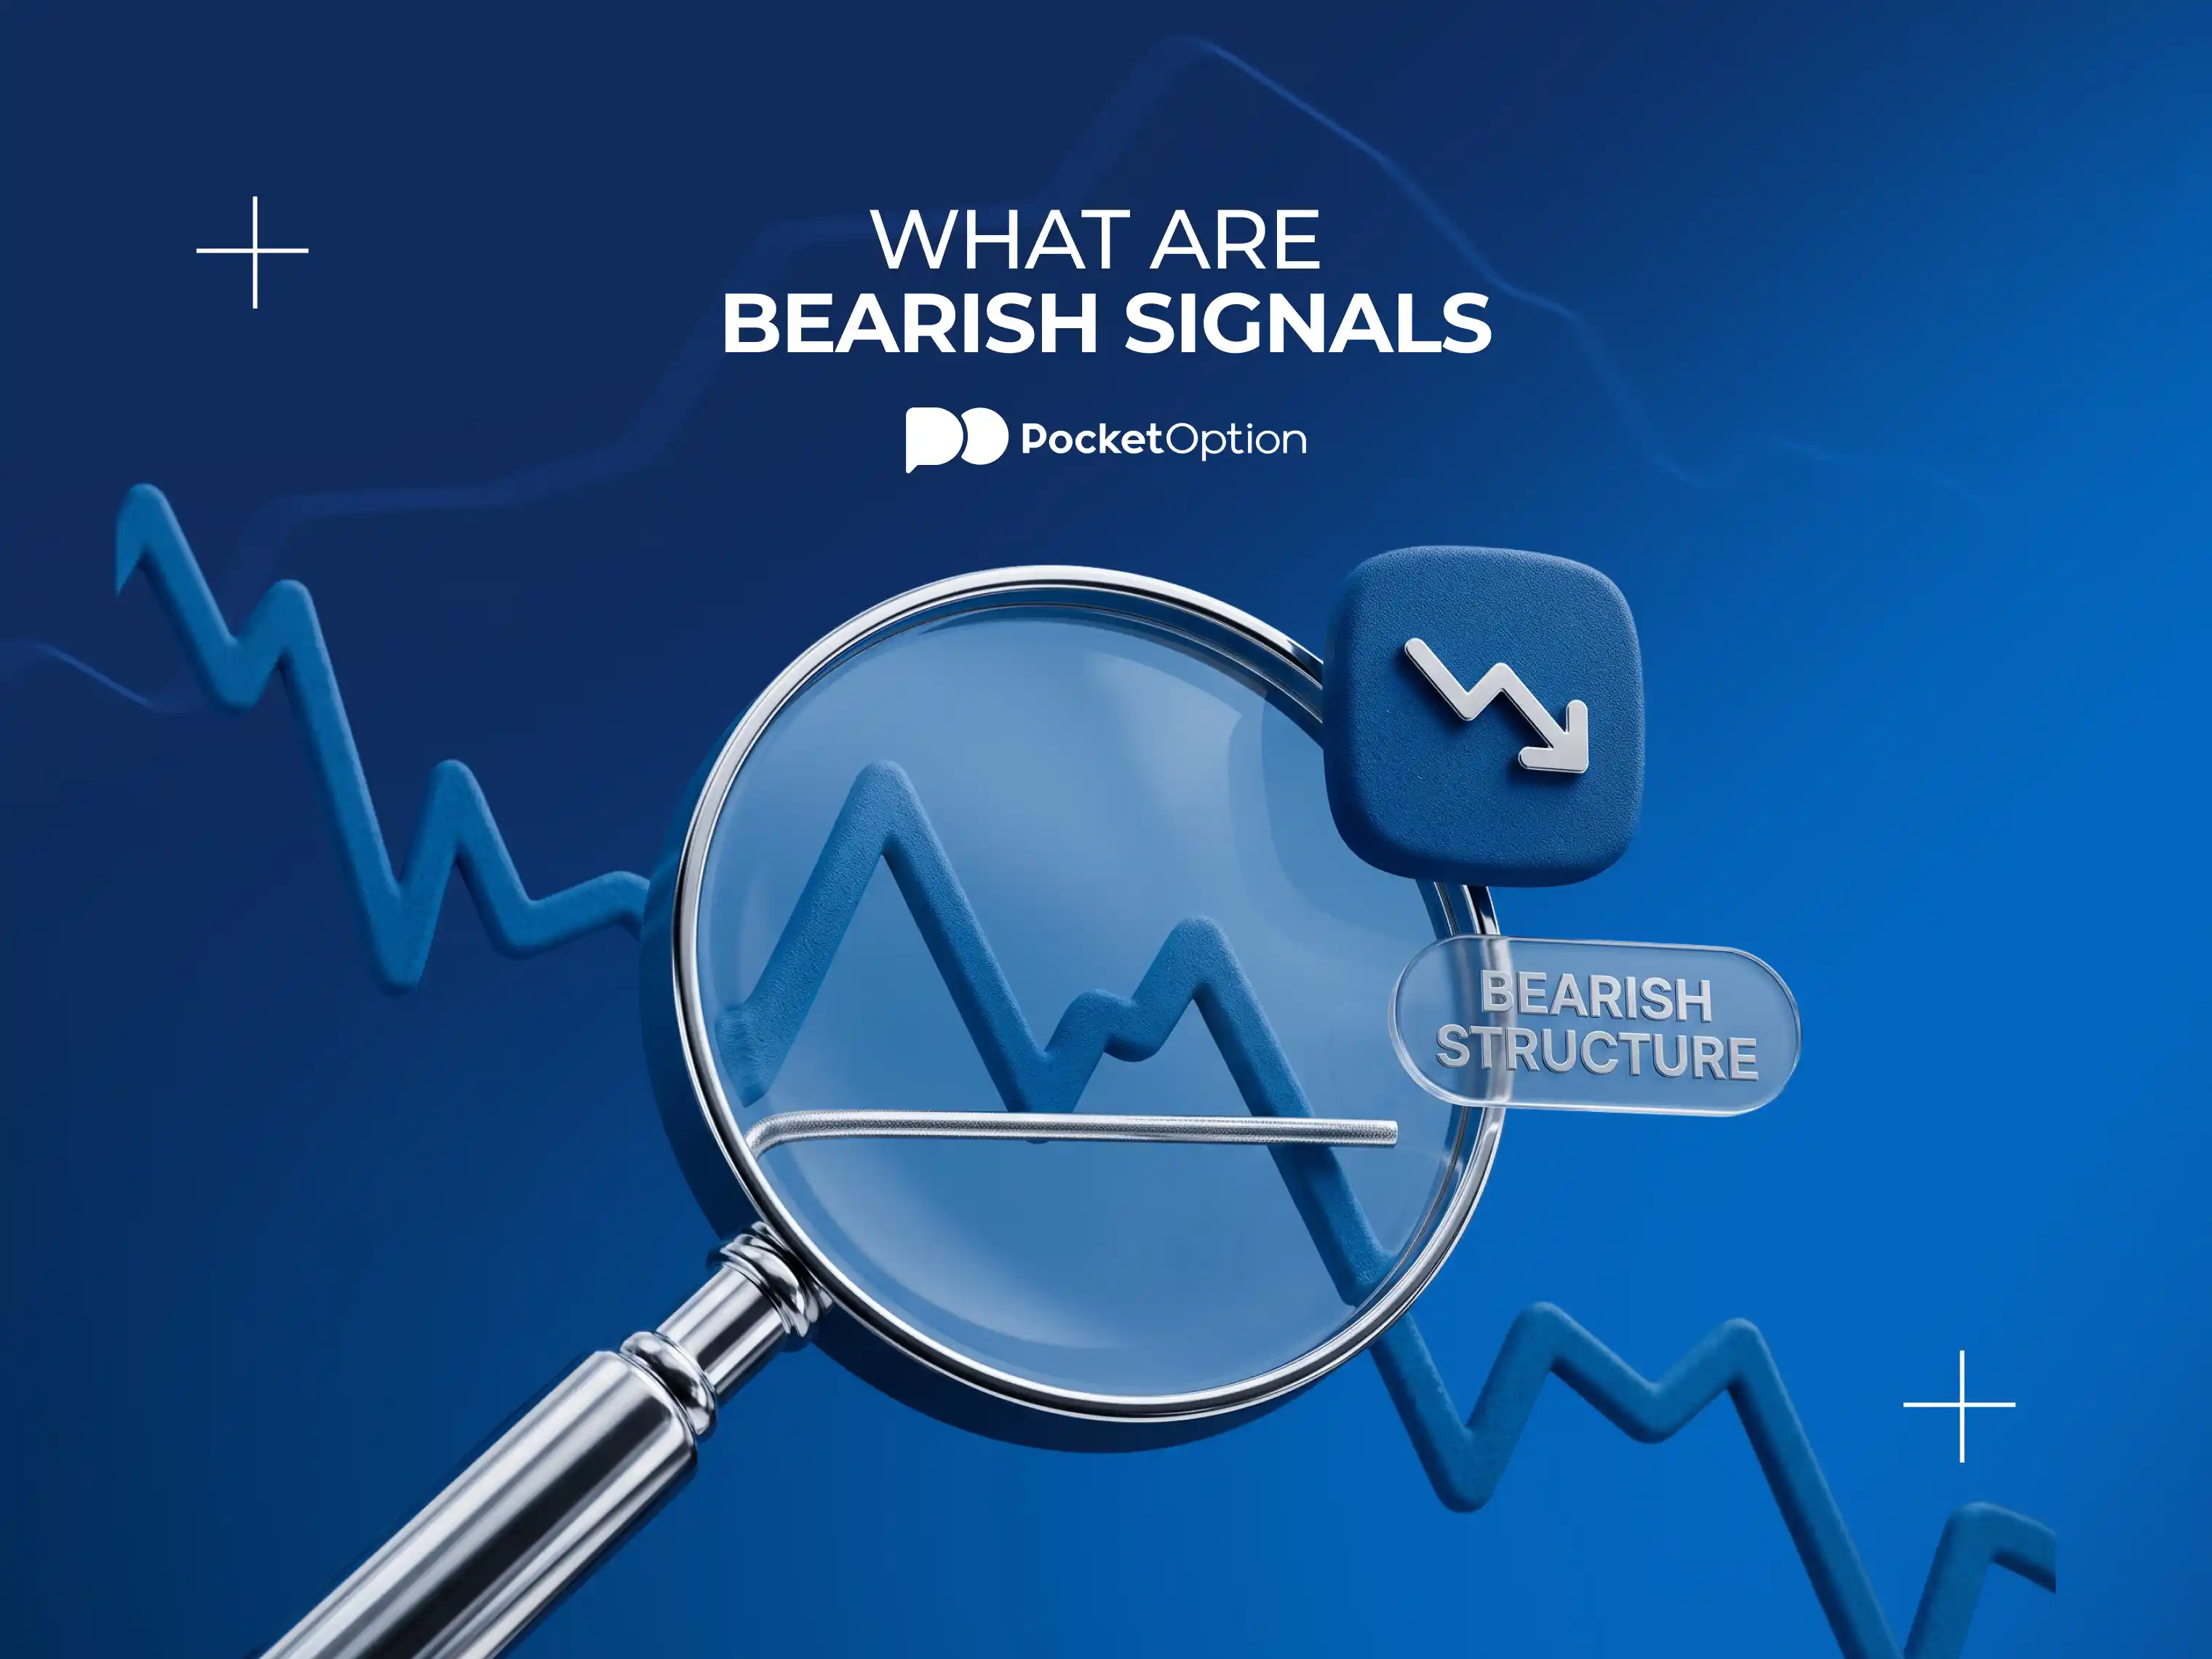
What Are Bearish Signals and How Can You Spot Them on a Chart?

Bearish signals are a collection of features, price structure, support breaks, momentum, and volume, that may point toward price weakness without guaranteeing it. This guide covers what to watch for, why one signal is usually not enough, and when these signals can mislead.
September 2530
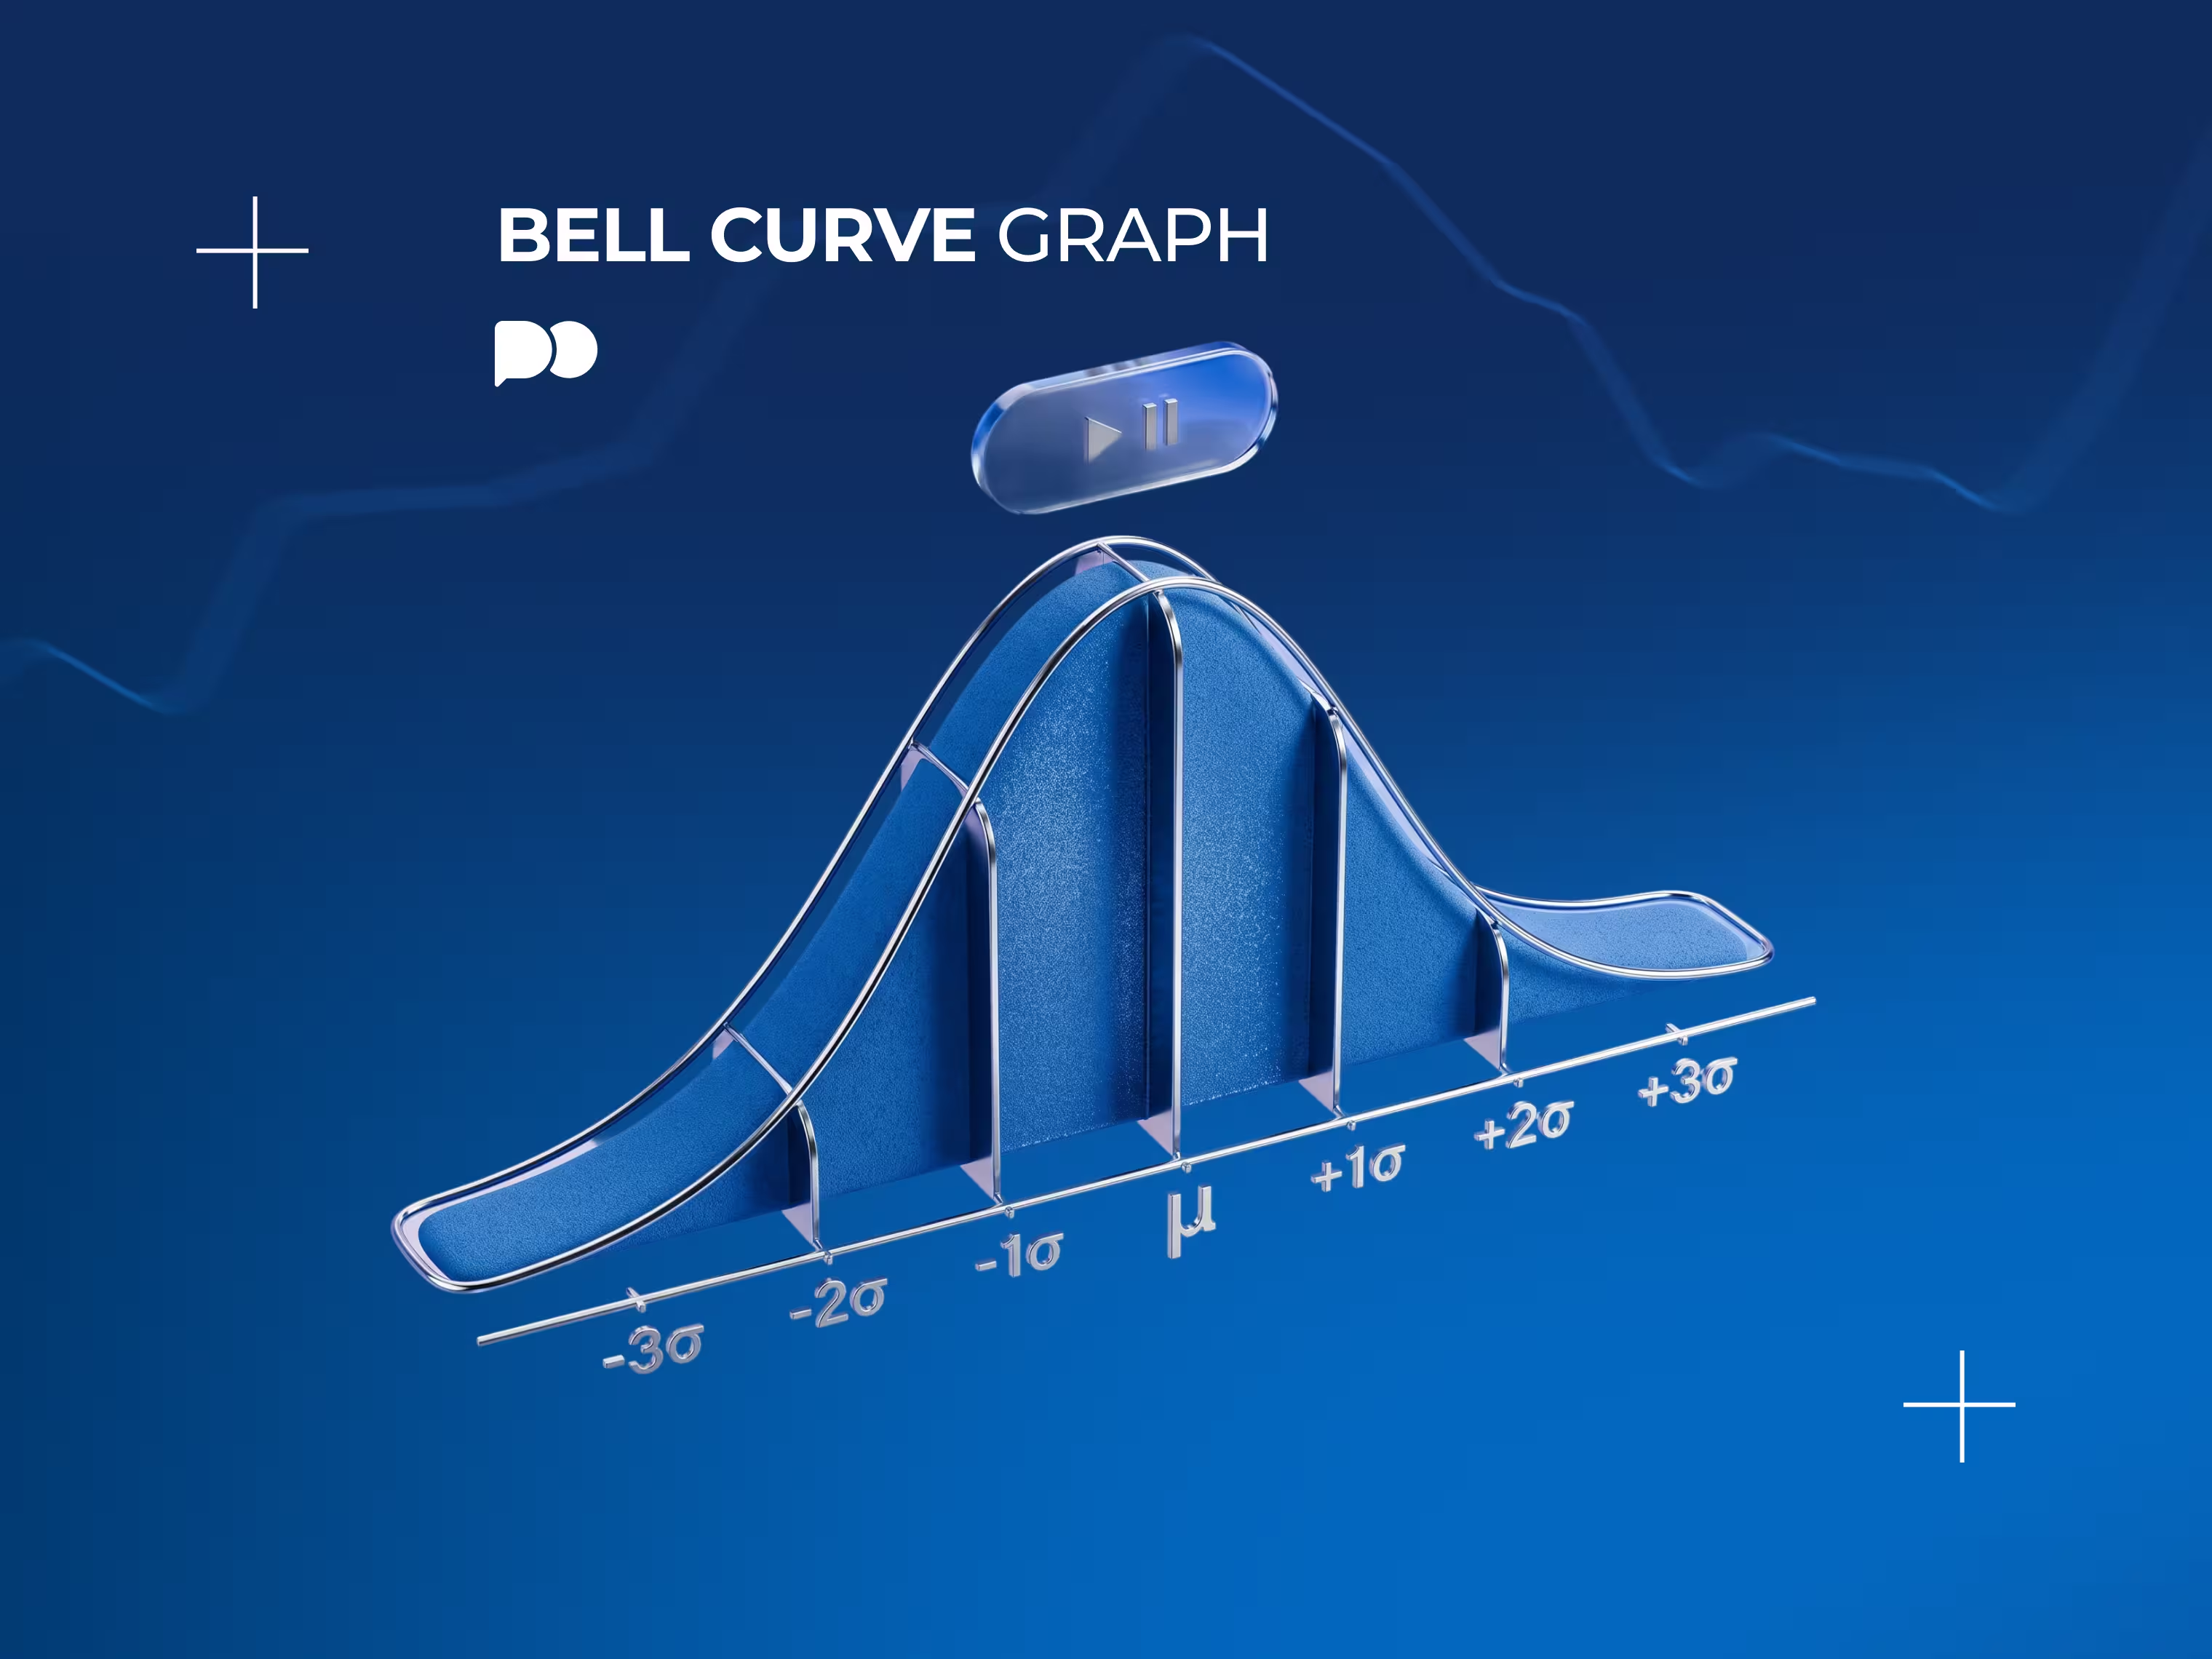
Bell curve graph with standard deviations labeled
Diego FernándezBearish
Bell Curve Graph: How to Read the Bell-Shaped Curve, Standard Deviation and Percentages

All phenomena tend to concentrate around the average and become rarer the farther away they are from it. And this single concept gives you the shape you recognize well and allows you to translate a set of numbers into the probabilities. In this article, we'll talk about the shape itself, some basic statistics concepts related to it, and the misleading way it could be applied in financial markets.

September 2430
Stakeholders meaning in business
Albert RobertsonBearish
Stakeholders Meaning. Who They Are in Business, Types and Real-World Examples

A company has meaning to more people than just the shareholders (the ones who actually own it). Some have signed a contract with it, some can shut it down completely, and some just allow it to function. All of them are called its stakeholders.

September 2430
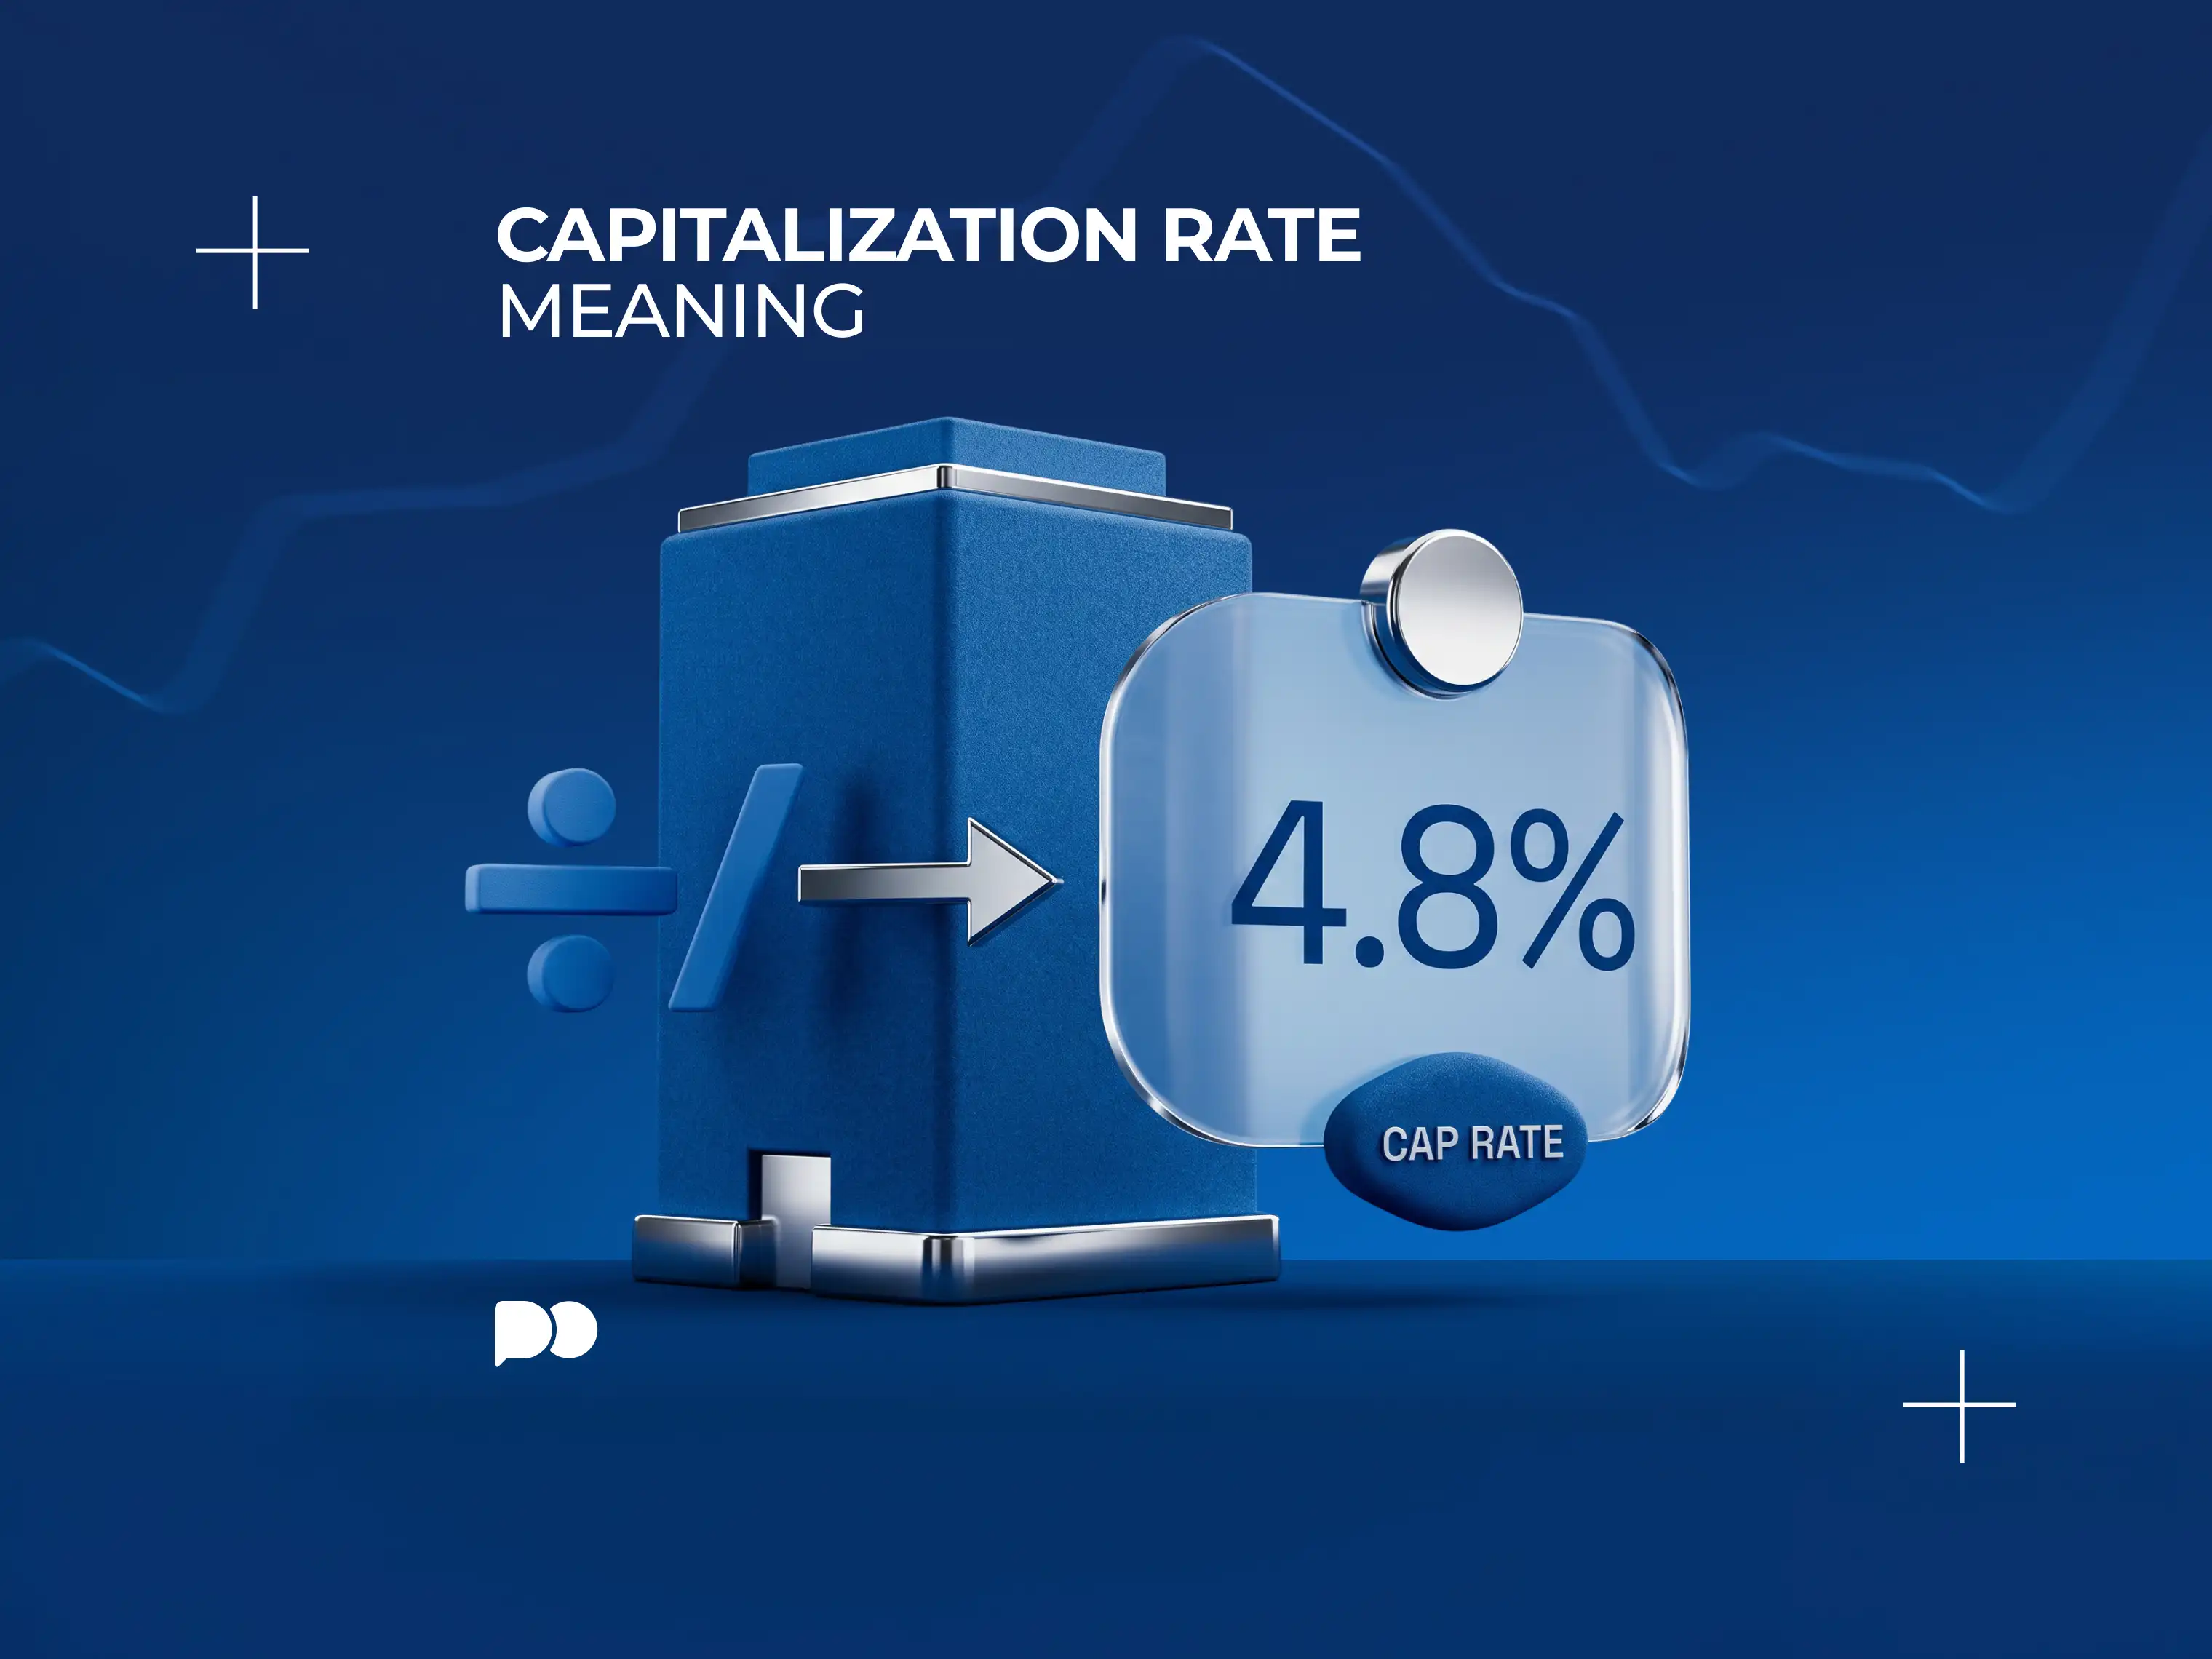
Capitalization rate meaning in real estate
Capitalization Rate Meaning: How Cap Rate Works in Real Estate and What It Tells InvestorsSeptember 24
Token sale stages before a crypto exchange listing
How to Buy New Crypto Before Listing: Risks, Methods and What Listing Really MeansSeptember 24
What is a peg in crypto shown as a token price held at one US dollar
What Is a Peg in Crypto? What Depegging MeansSeptember 24
Fiat wallet with traditional currency and crypto
What Is a Fiat Wallet? How Fiat and Crypto Wallets Differ and Where to Store CashSeptember 24
The annual high and low on a stock chart
52 Week Range Meaning: How to Read Highs, Lows and Context in Stock ChartsSeptember 24
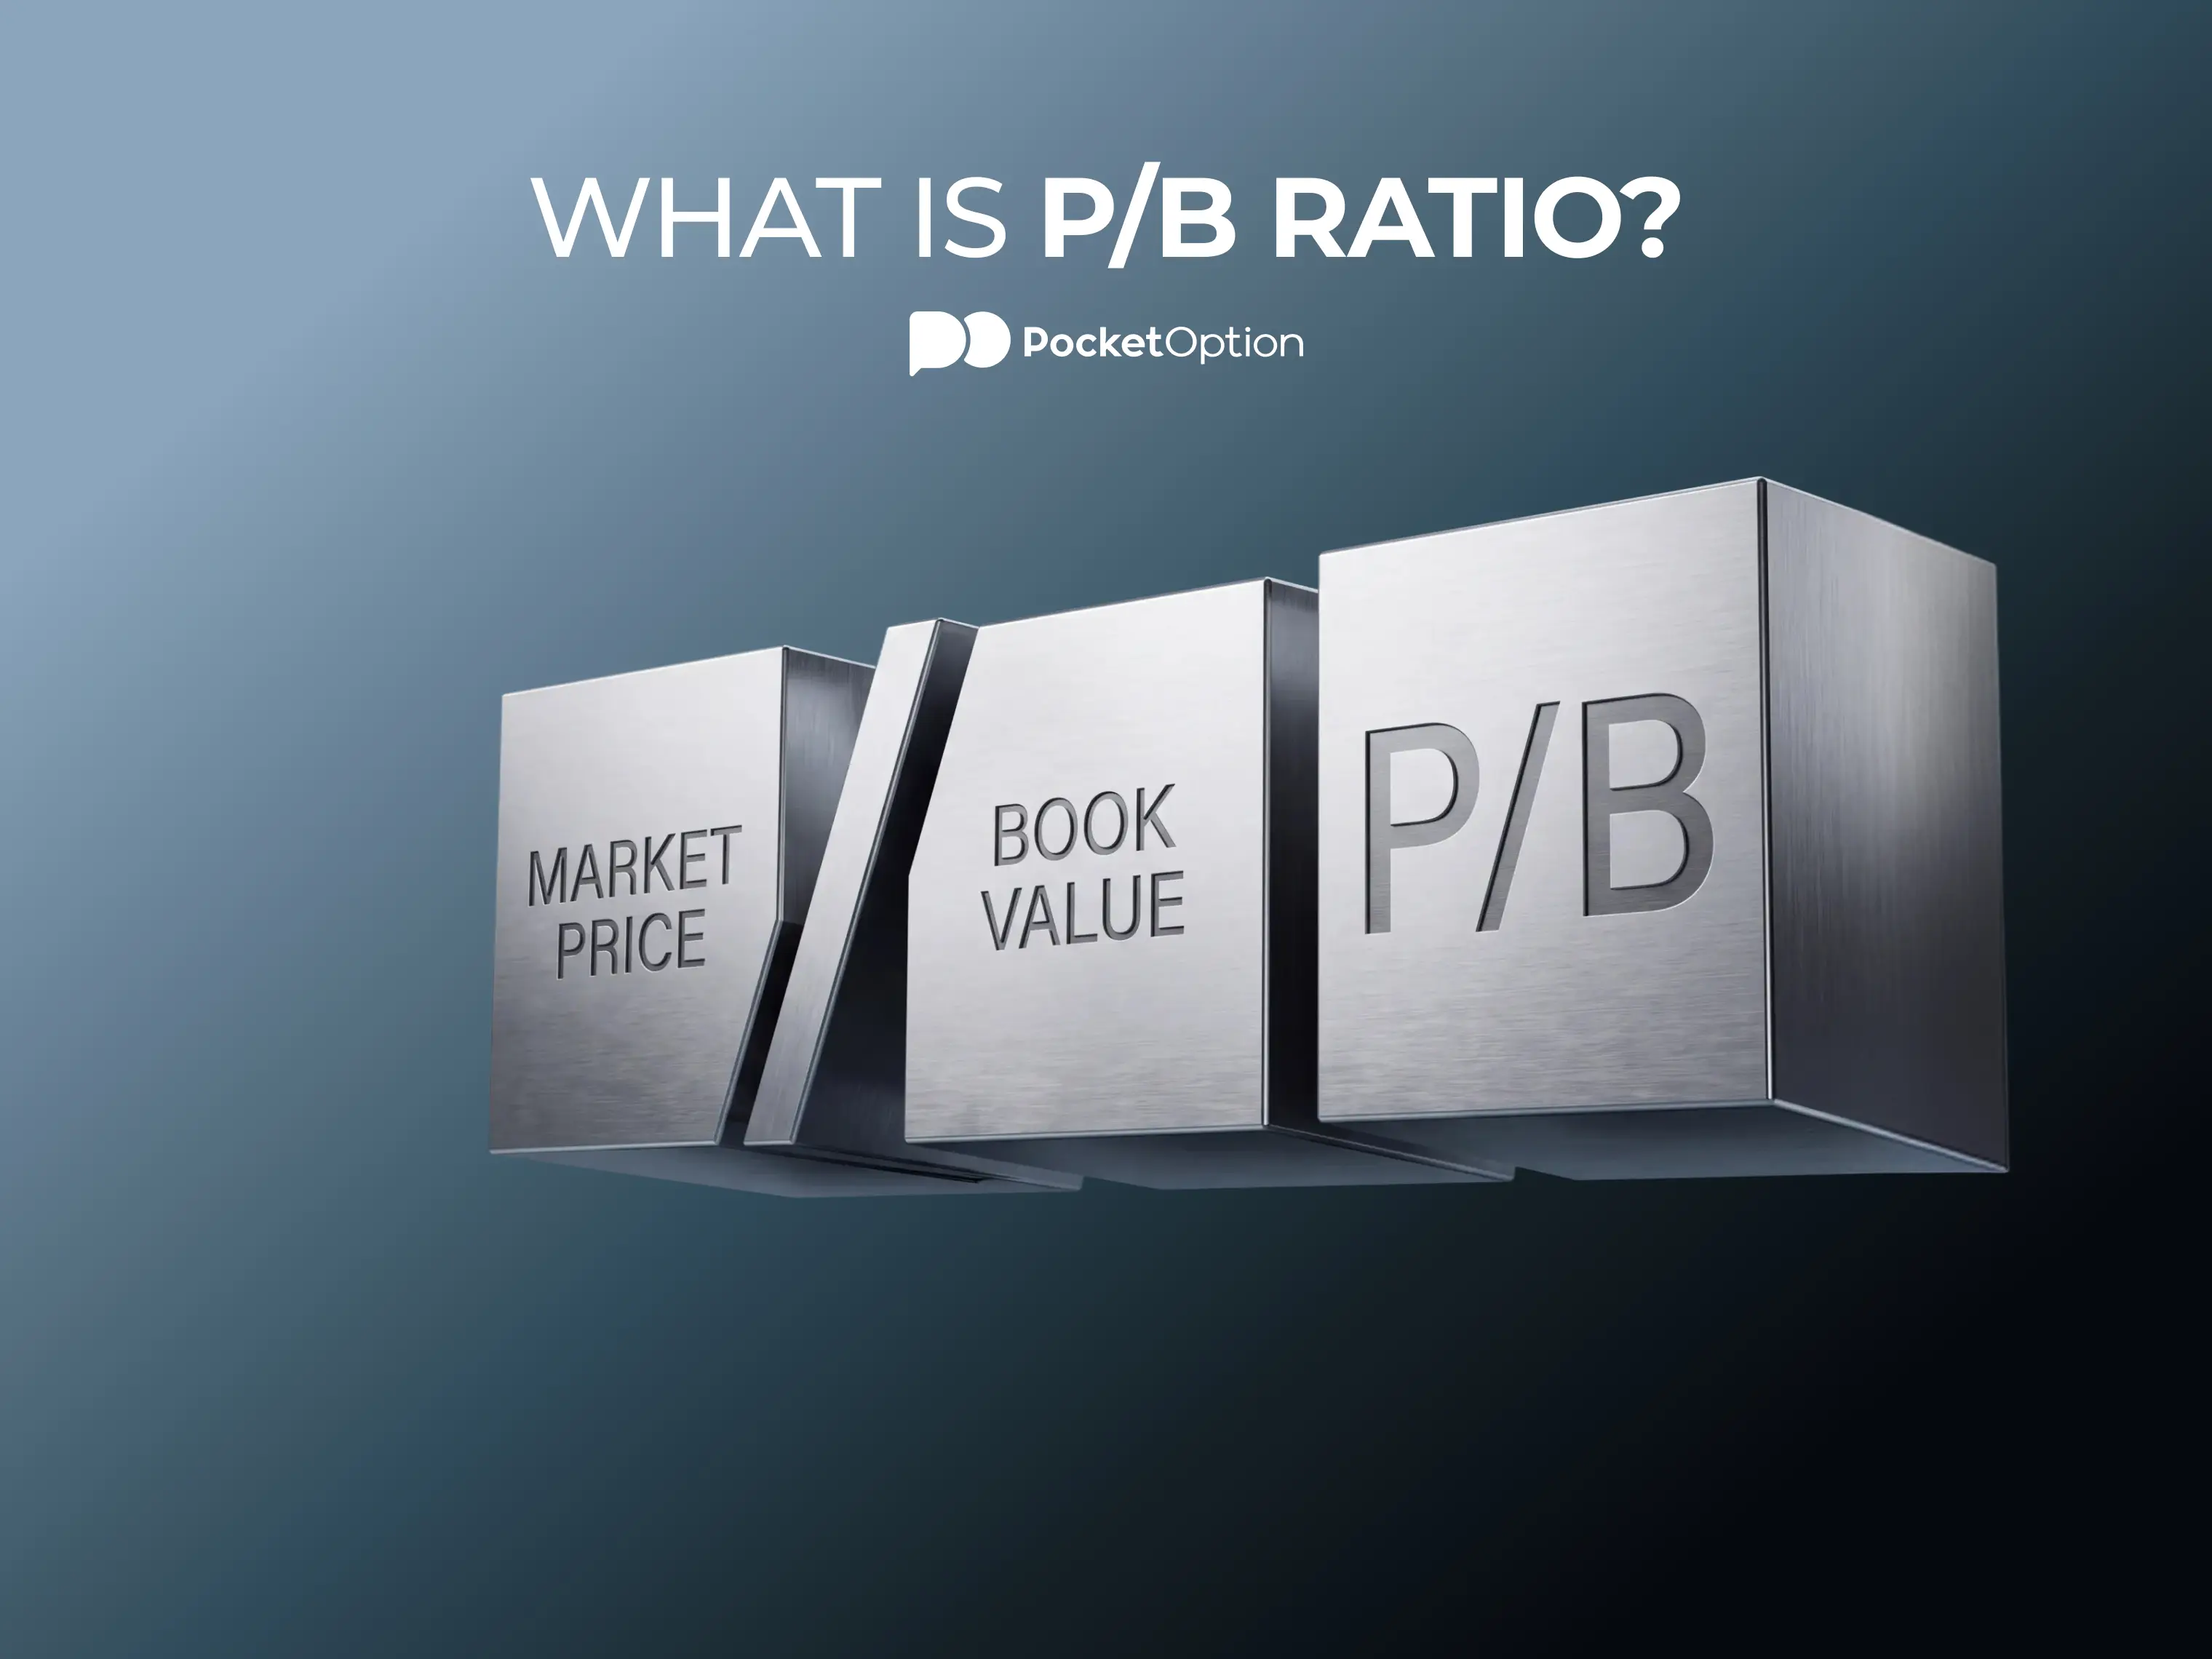
ratio formula and price to book ratio calculation
What Is P/B Ratio? How to Tell If a Stock Is Cheap or Expensive Relative to Its AssetsSeptember 24
IG Markets weekend trading
Albert RobertsonBearish
What Is IG Markets Weekend and How Does Weekend Trading Work There?

Most markets shut on Friday evening and stay shut. A few brokers quote prices anyway across Saturday and Sunday, on a limited set of instruments, under rules that are not quite the weekday rules.
September 2420
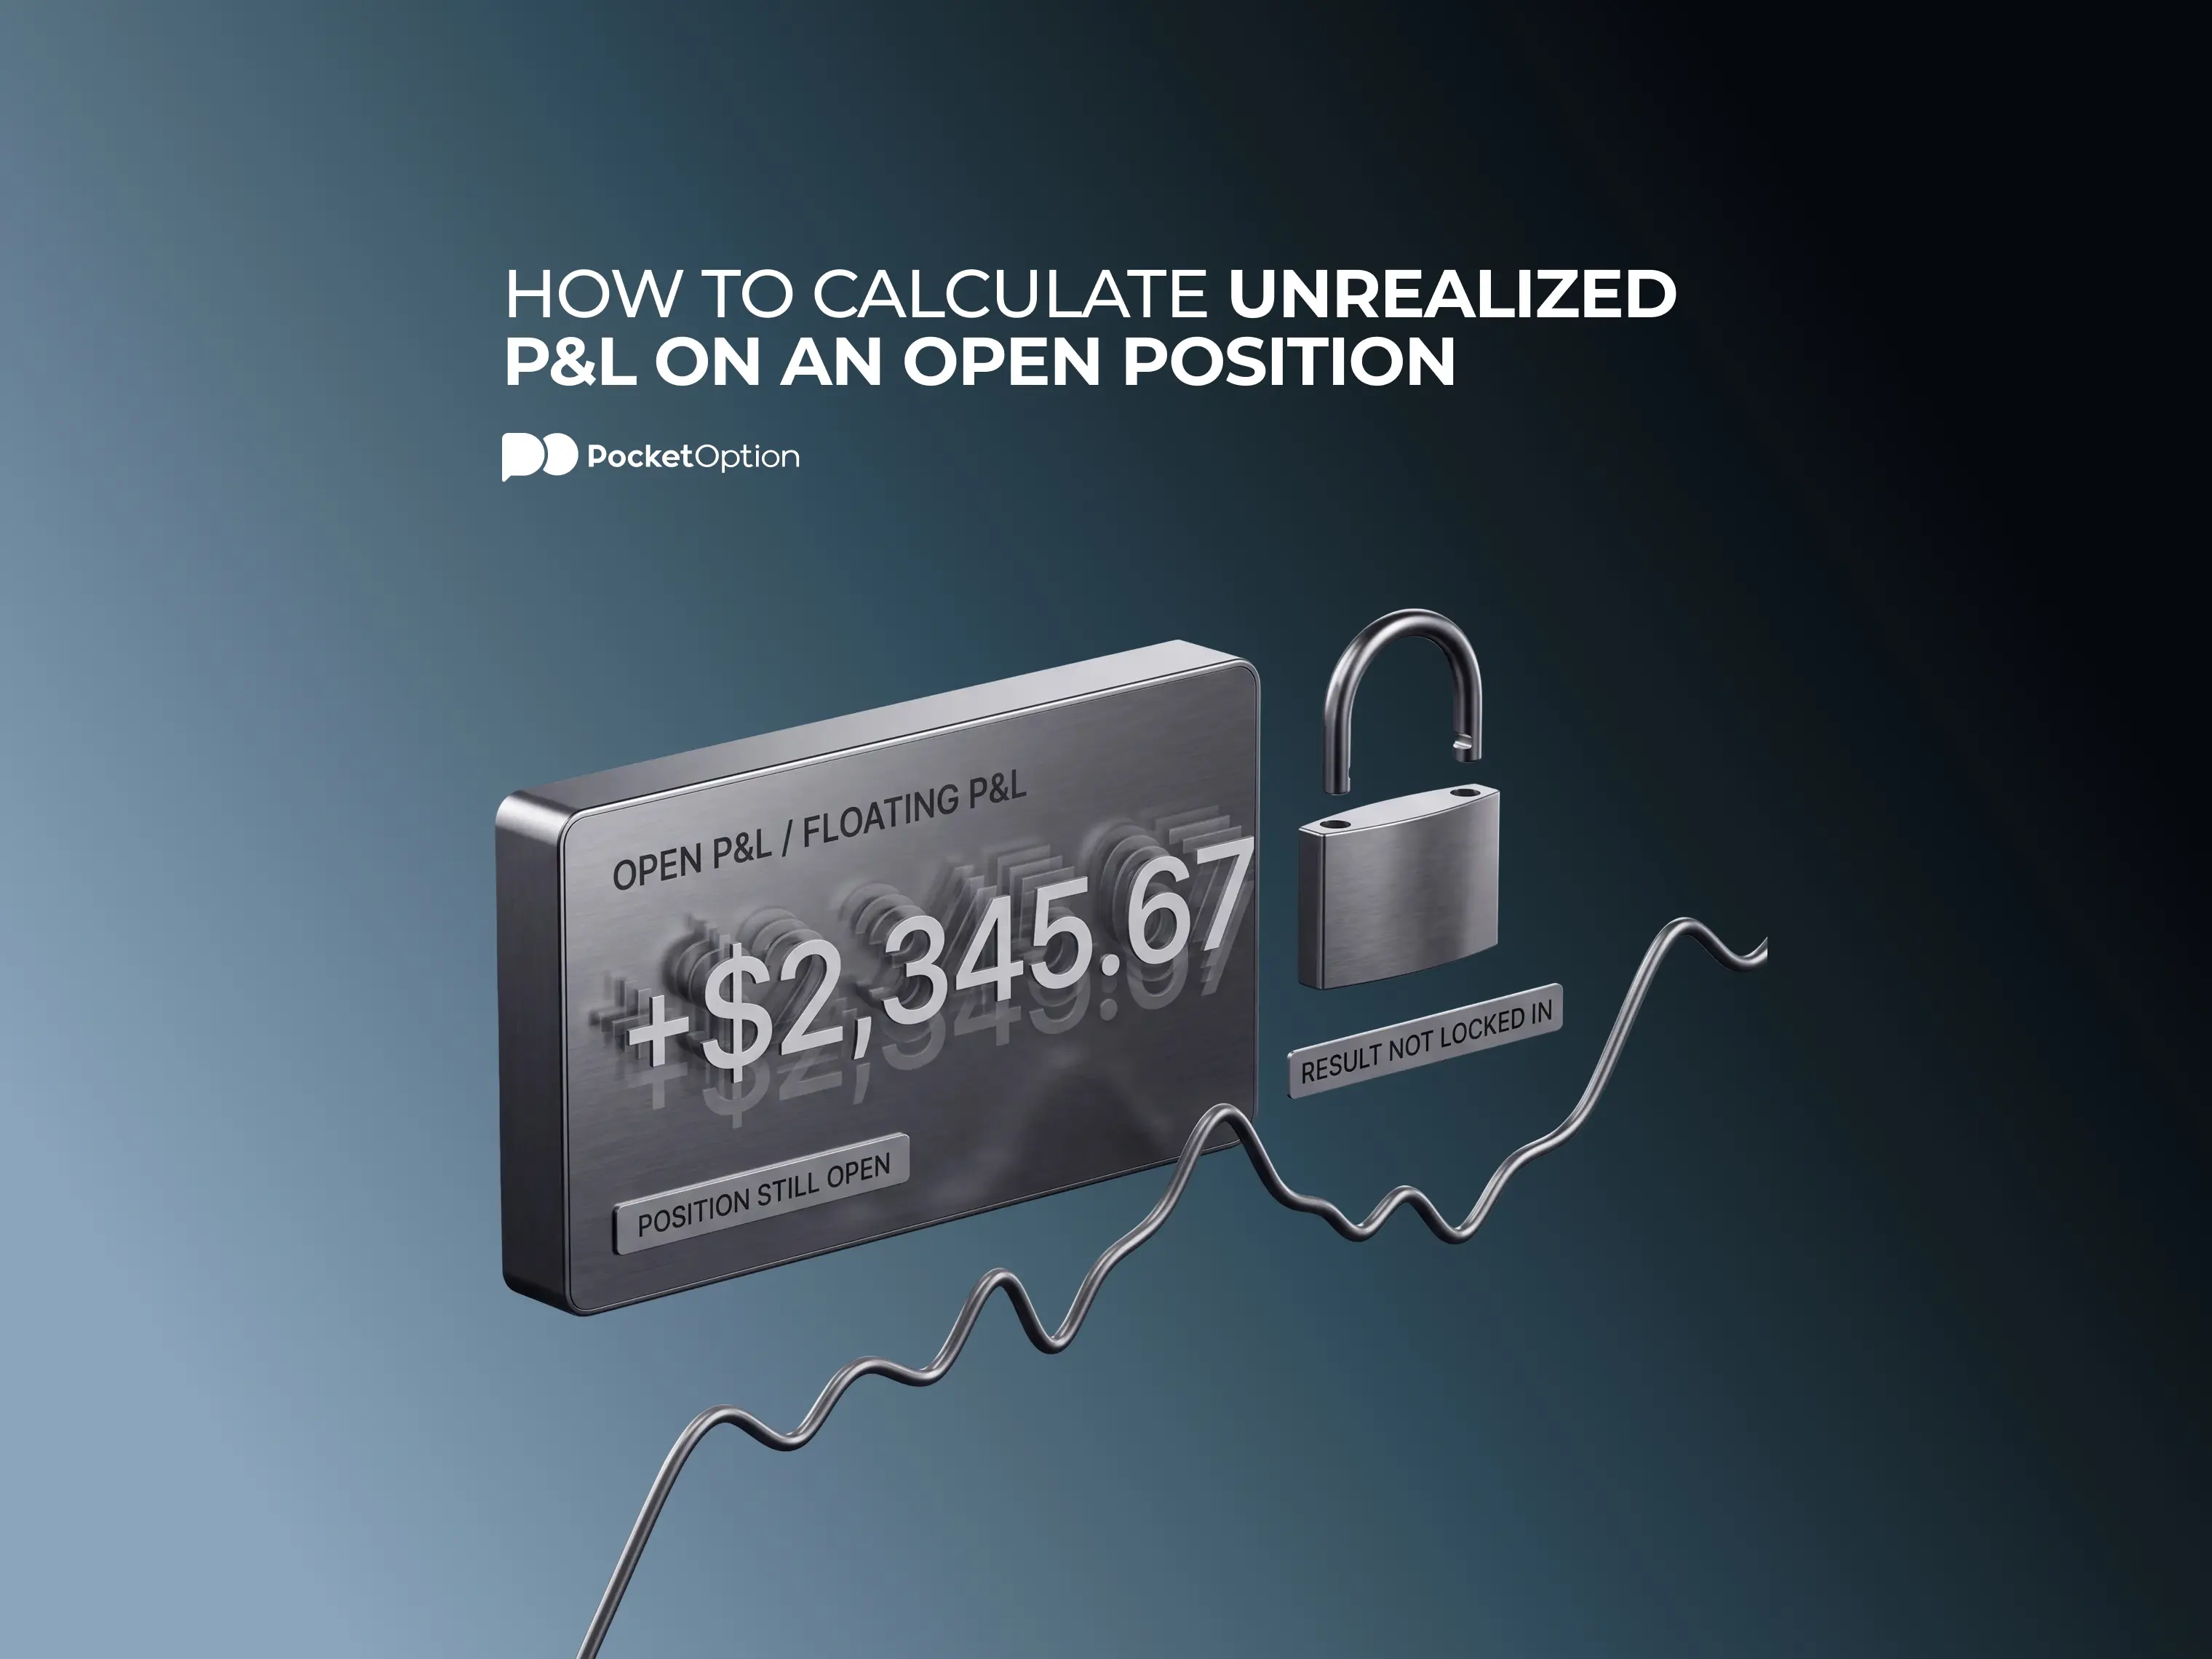
unrealized profit and loss
Albert RobertsonBearish
How to Calculate Unrealized P&L on an Open Position

An open position carries a number that changes every second and has not actually happened yet. Both halves of that matter. It moves constantly, and none of it is real until the position closes.

September 2420
asset classes
Albert RobertsonBearish
What Is an Asset Class? Definition and Main Types

Group things that behave alike and you can say something useful about the group. That is all a class is, really. The interesting part is what happens to the instruments that refuse to sit neatly inside any one of them.

September 2210
  • 1
  • …
  • 6
  • 7
  • …
  • 8
  • …
  • 468