278
 Albert RobertsonBearish
Disinflation means inflation is slowing while prices still rise. Deflation means the general price level falls. Here is how the two differ, what causes each, how they can affect the economy and markets, and what to check when inflation is falling.
 Albert RobertsonBearish
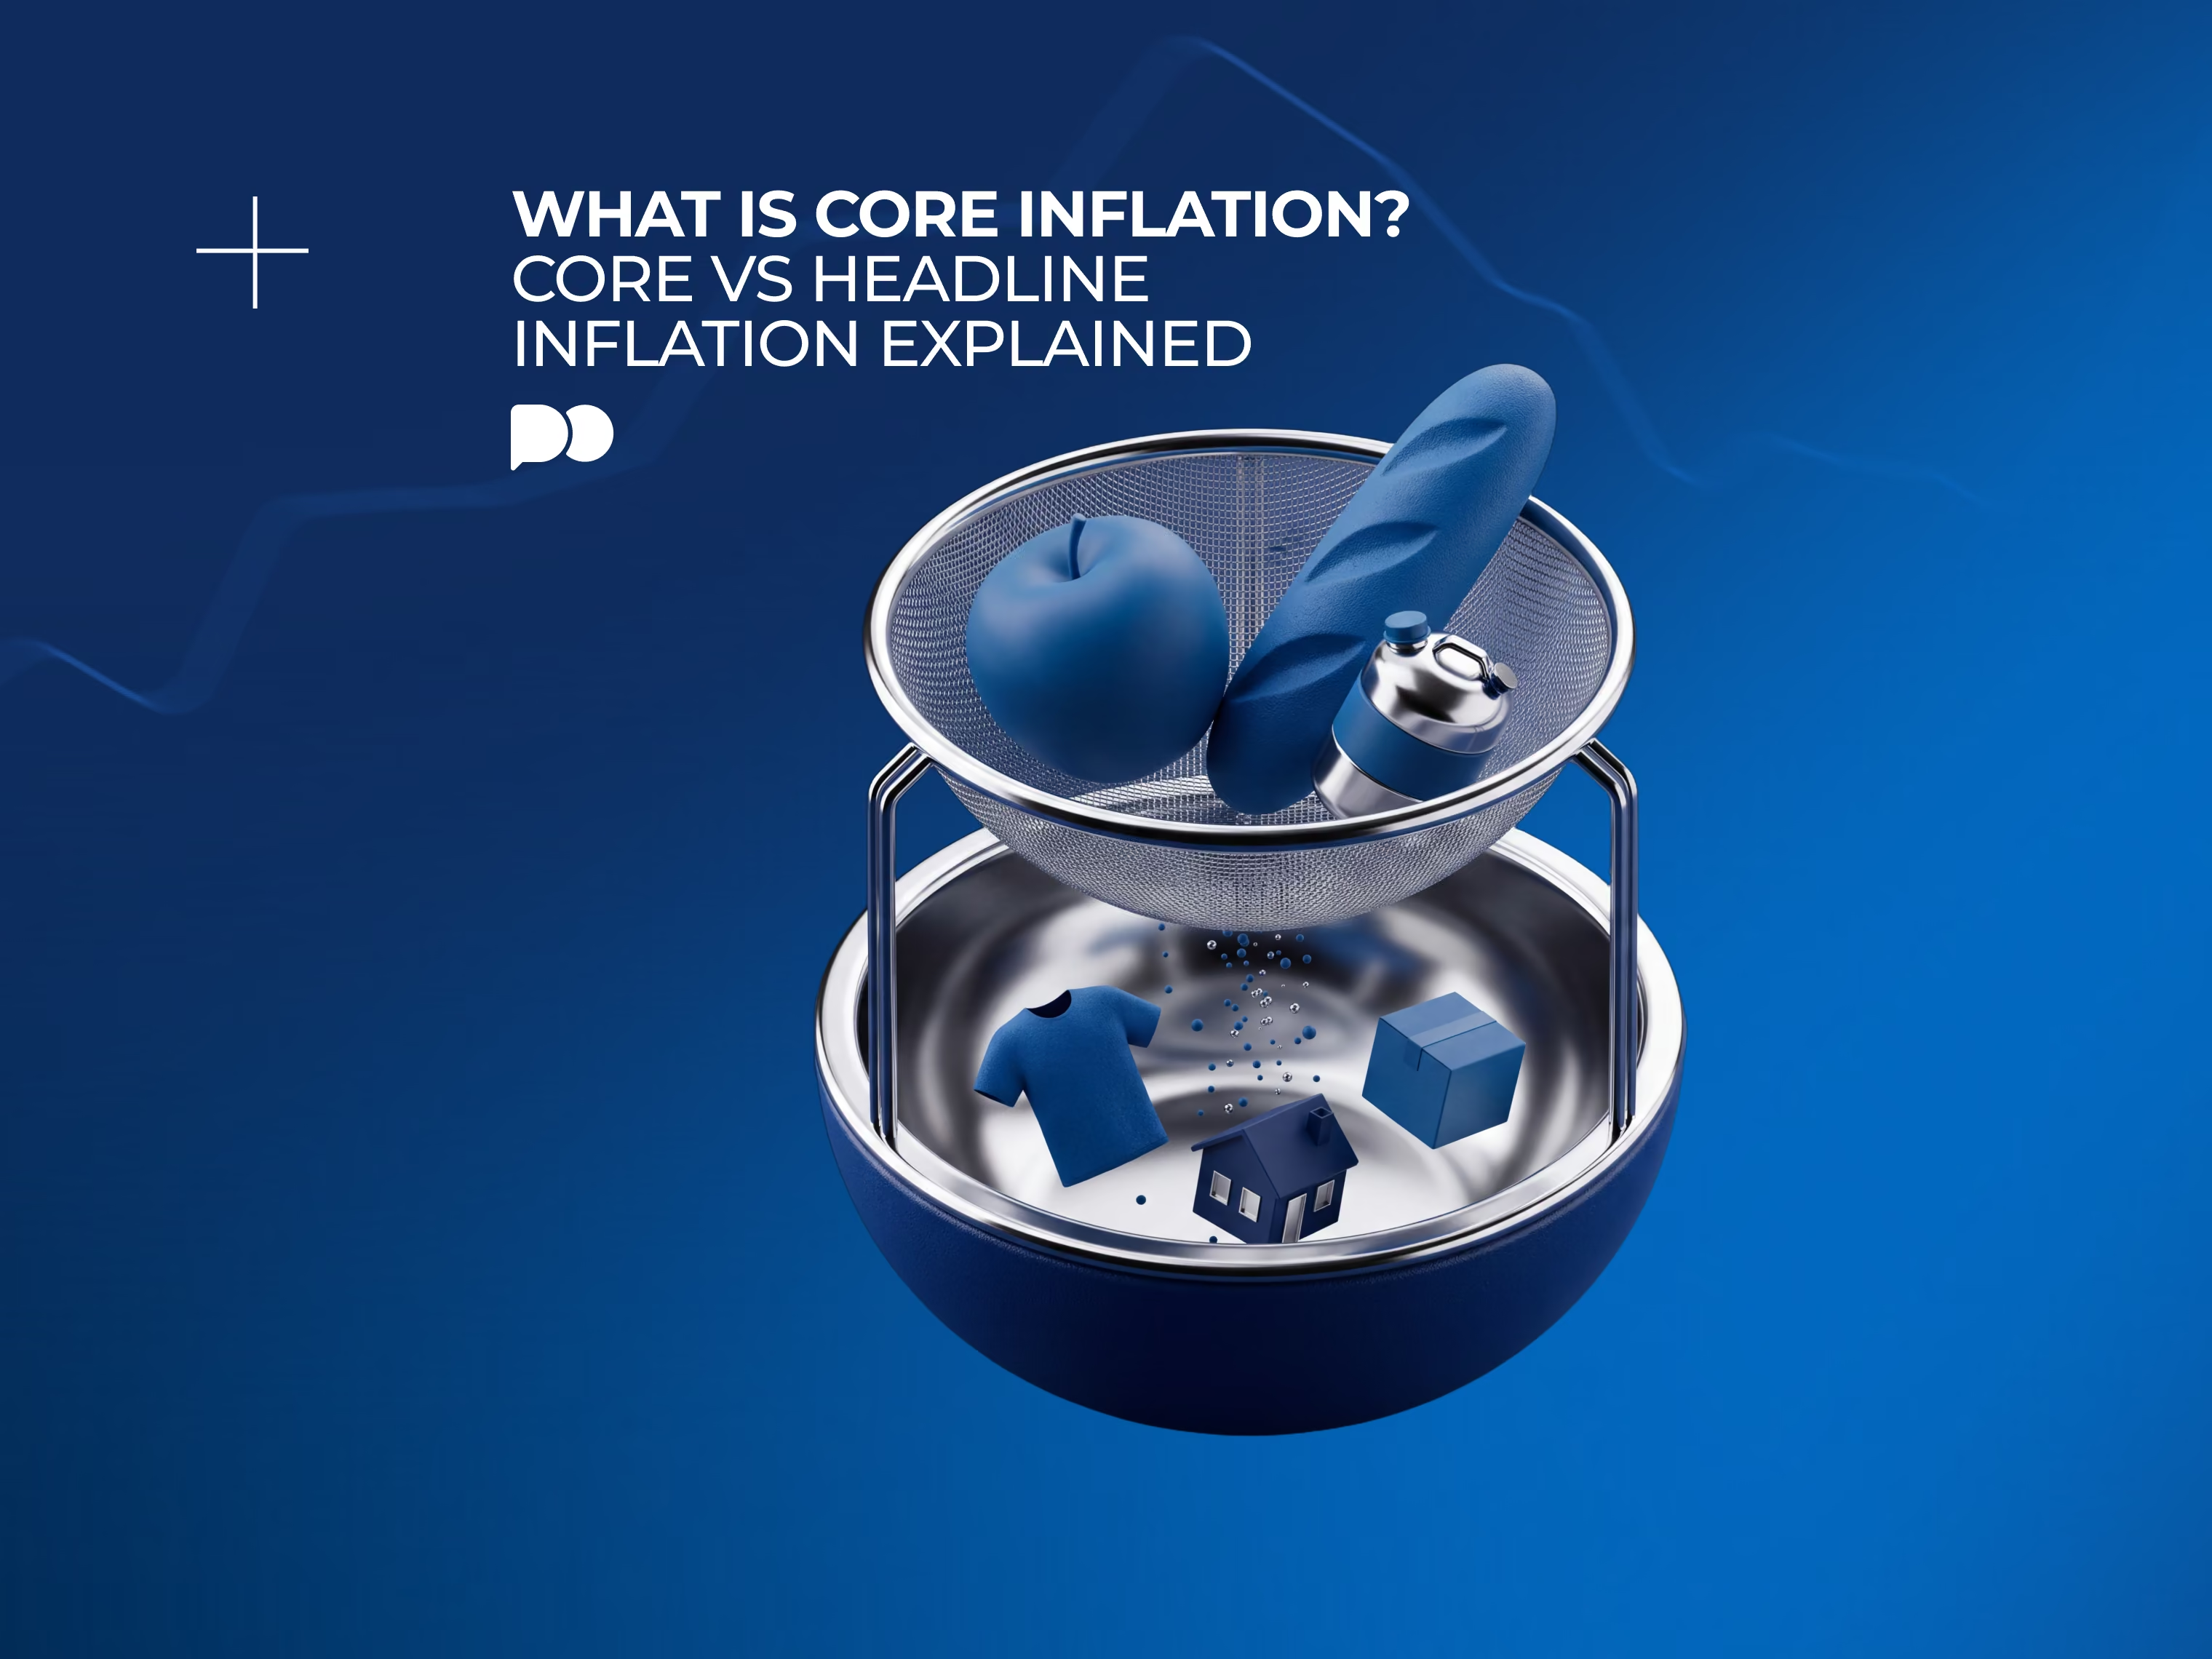
Core inflation strips food and energy out of a price index to show the underlying trend. Here is how it differs from headline inflation, why the two diverge, why economists watch core, and where it falls short.
 Albert RobertsonBearish
Stagflation is the mix of high or stubborn inflation, weak growth and a soft job market. Here is what causes it, how it differs from plain inflation and recession, why it squeezes central banks, and how it may touch currencies, stocks, bonds and commodities.




 Albert RobertsonBearish
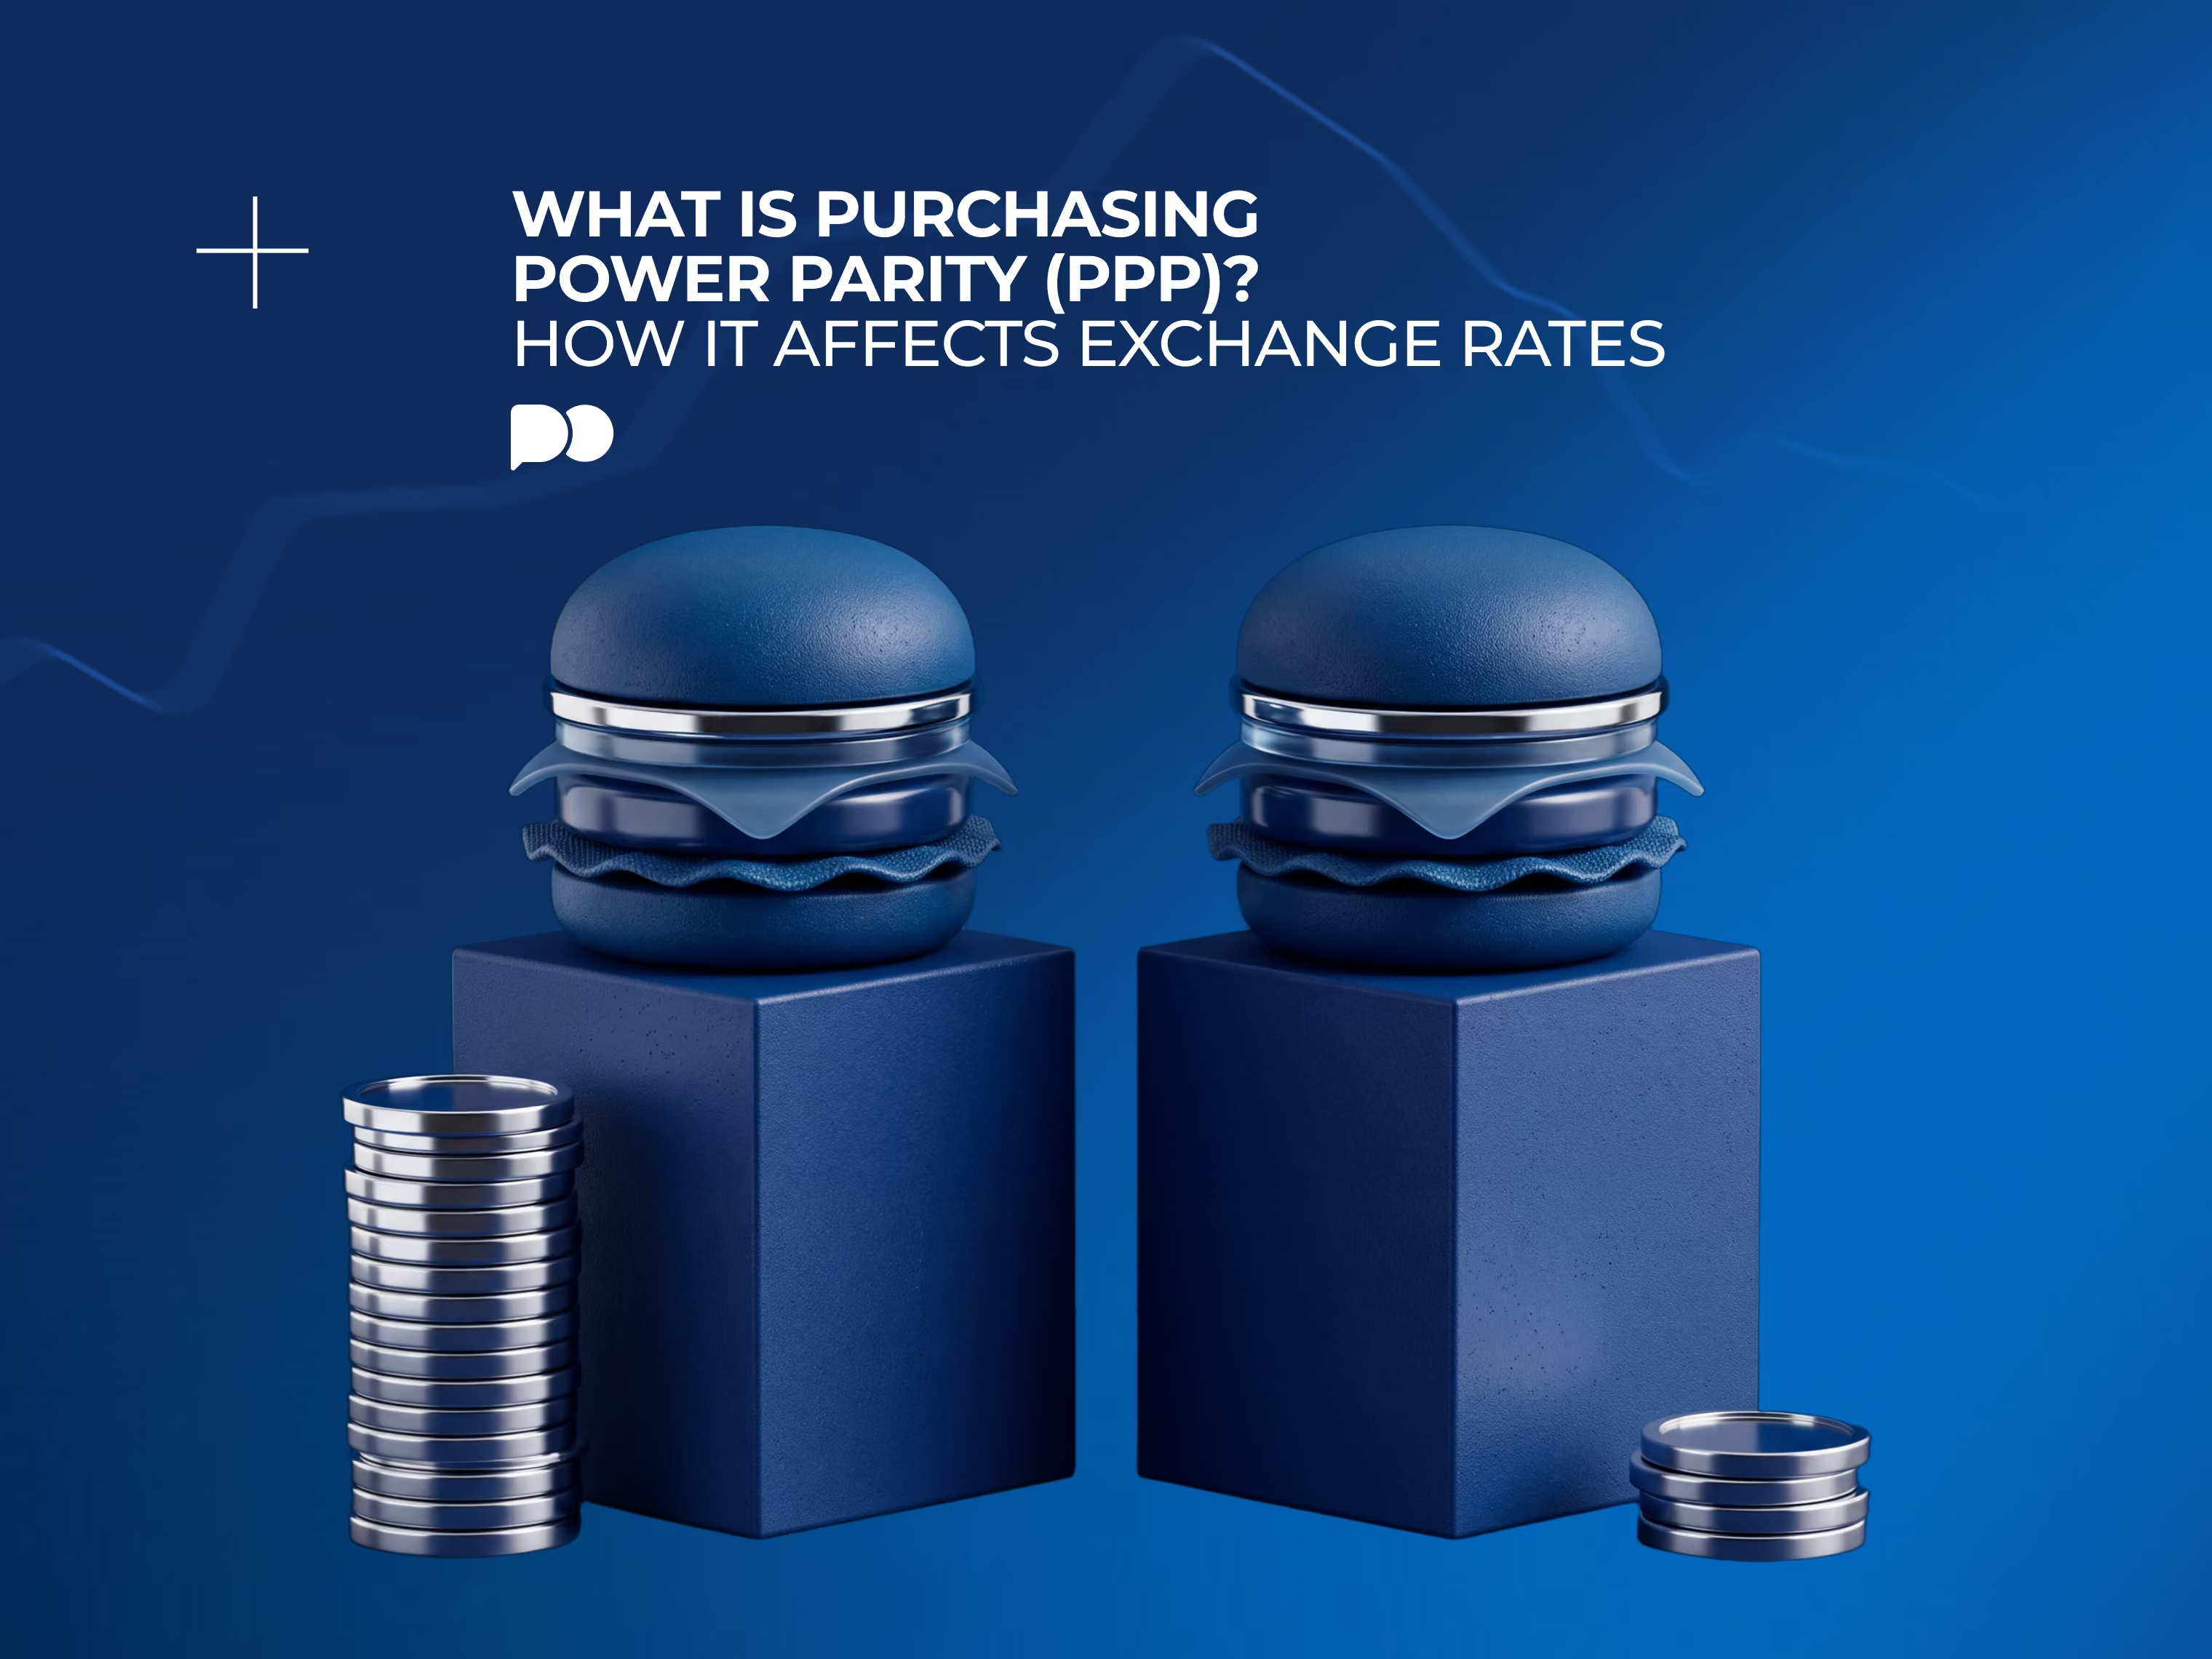
Purchasing power parity compares currencies through the cost of a similar basket of goods. Here is how absolute and relative PPP differ, how a PPP rate is worked out, why market rates drift away from it, and how traders can read it in context.
 Albert RobertsonBearish
Amortisation means spreading a cost or a debt over time. The word turns up in two places: loan repayments and accounting for intangible assets. Both follow the same idea of reducing a value in planned steps.
 Albert RobertsonBearish
OBV is a simple volume indicator with a clear job. It tracks whether volume is flowing into or out of an asset, so you can check whether a price trend has real support behind it.
 Albert RobertsonBearish
Not every crypto transfer is written to the blockchain right away. Many happen off chain, in systems that sit beside the main network and settle back to it later. That makes them faster and cheaper, but you give up some transparency.
 Albert RobertsonBearish
Chartists make trading decisions from price charts. They don't start with earnings reports or economic data. They start with what price has already done and ask what it might do next.
 Albert RobertsonBearish
A stop limit order lets you set two prices instead of one. The first wakes the order up. The second caps the price you'll accept. You gain control over price, but you give up the certainty of a fill.
 Albert RobertsonBearish
The Fed dot plot collects individual FOMC rate projections in one chart. This guide explains what each dot represents, how to read the years and the longer-run column, what the median and the spread suggest, and what to compare in each new release.
 Albert RobertsonBearish
The Fisher Effect links nominal interest rates, real interest rates, and expected inflation. This guide explains the exact and simplified formulas, works through a plain numeric example, and covers why the observed relationship can diverge from the clean theory in practice.
 Albert RobertsonBearish
The Taylor Rule is a formula that suggests a short-term interest rate based on inflation and economic activity. This guide explains the classic 1993 formula, what the inflation gap and output gap mean, why the neutral real rate matters, and how traders can interpret the rule as a reference point rather than a trading signal.