




News
StreamsEventsMedia
Streams
News
HumorDataSignals
CryptoEducationGEOPlatform updatesProduct GuidesPsychologyGlossary
LearningRegulation and safetyCalculatorsTradingMarkets
Trading StrategiesBonuses and promotionsTrading platformsReviews
Risk warning:

Investing in financial products involves risks. Past performance does not guarantee future returns, and values may fluctuate due to market conditions and changes in underlying assets. Any forecasts or illustrations are for reference only and are not guarantees. This website does not constitute an invitation or recommendation to invest. Before investing, seek advice from financial, legal, and tax professionals, and assess whether the product suits your goals, risk tolerance, and circumstances. This website does not provide service to residents of the EEA countries, USA, Israel, UK, Philippines, Japan and Brazil.

Risk Disclosure
Copyright ©2026 Pocket Option

Blog

  • 329
  • 336
  • 534
  • 240
  • 236
  • 335
Aroon indicator Up and Down lines on a trading chart
Albert RobertsonBearish
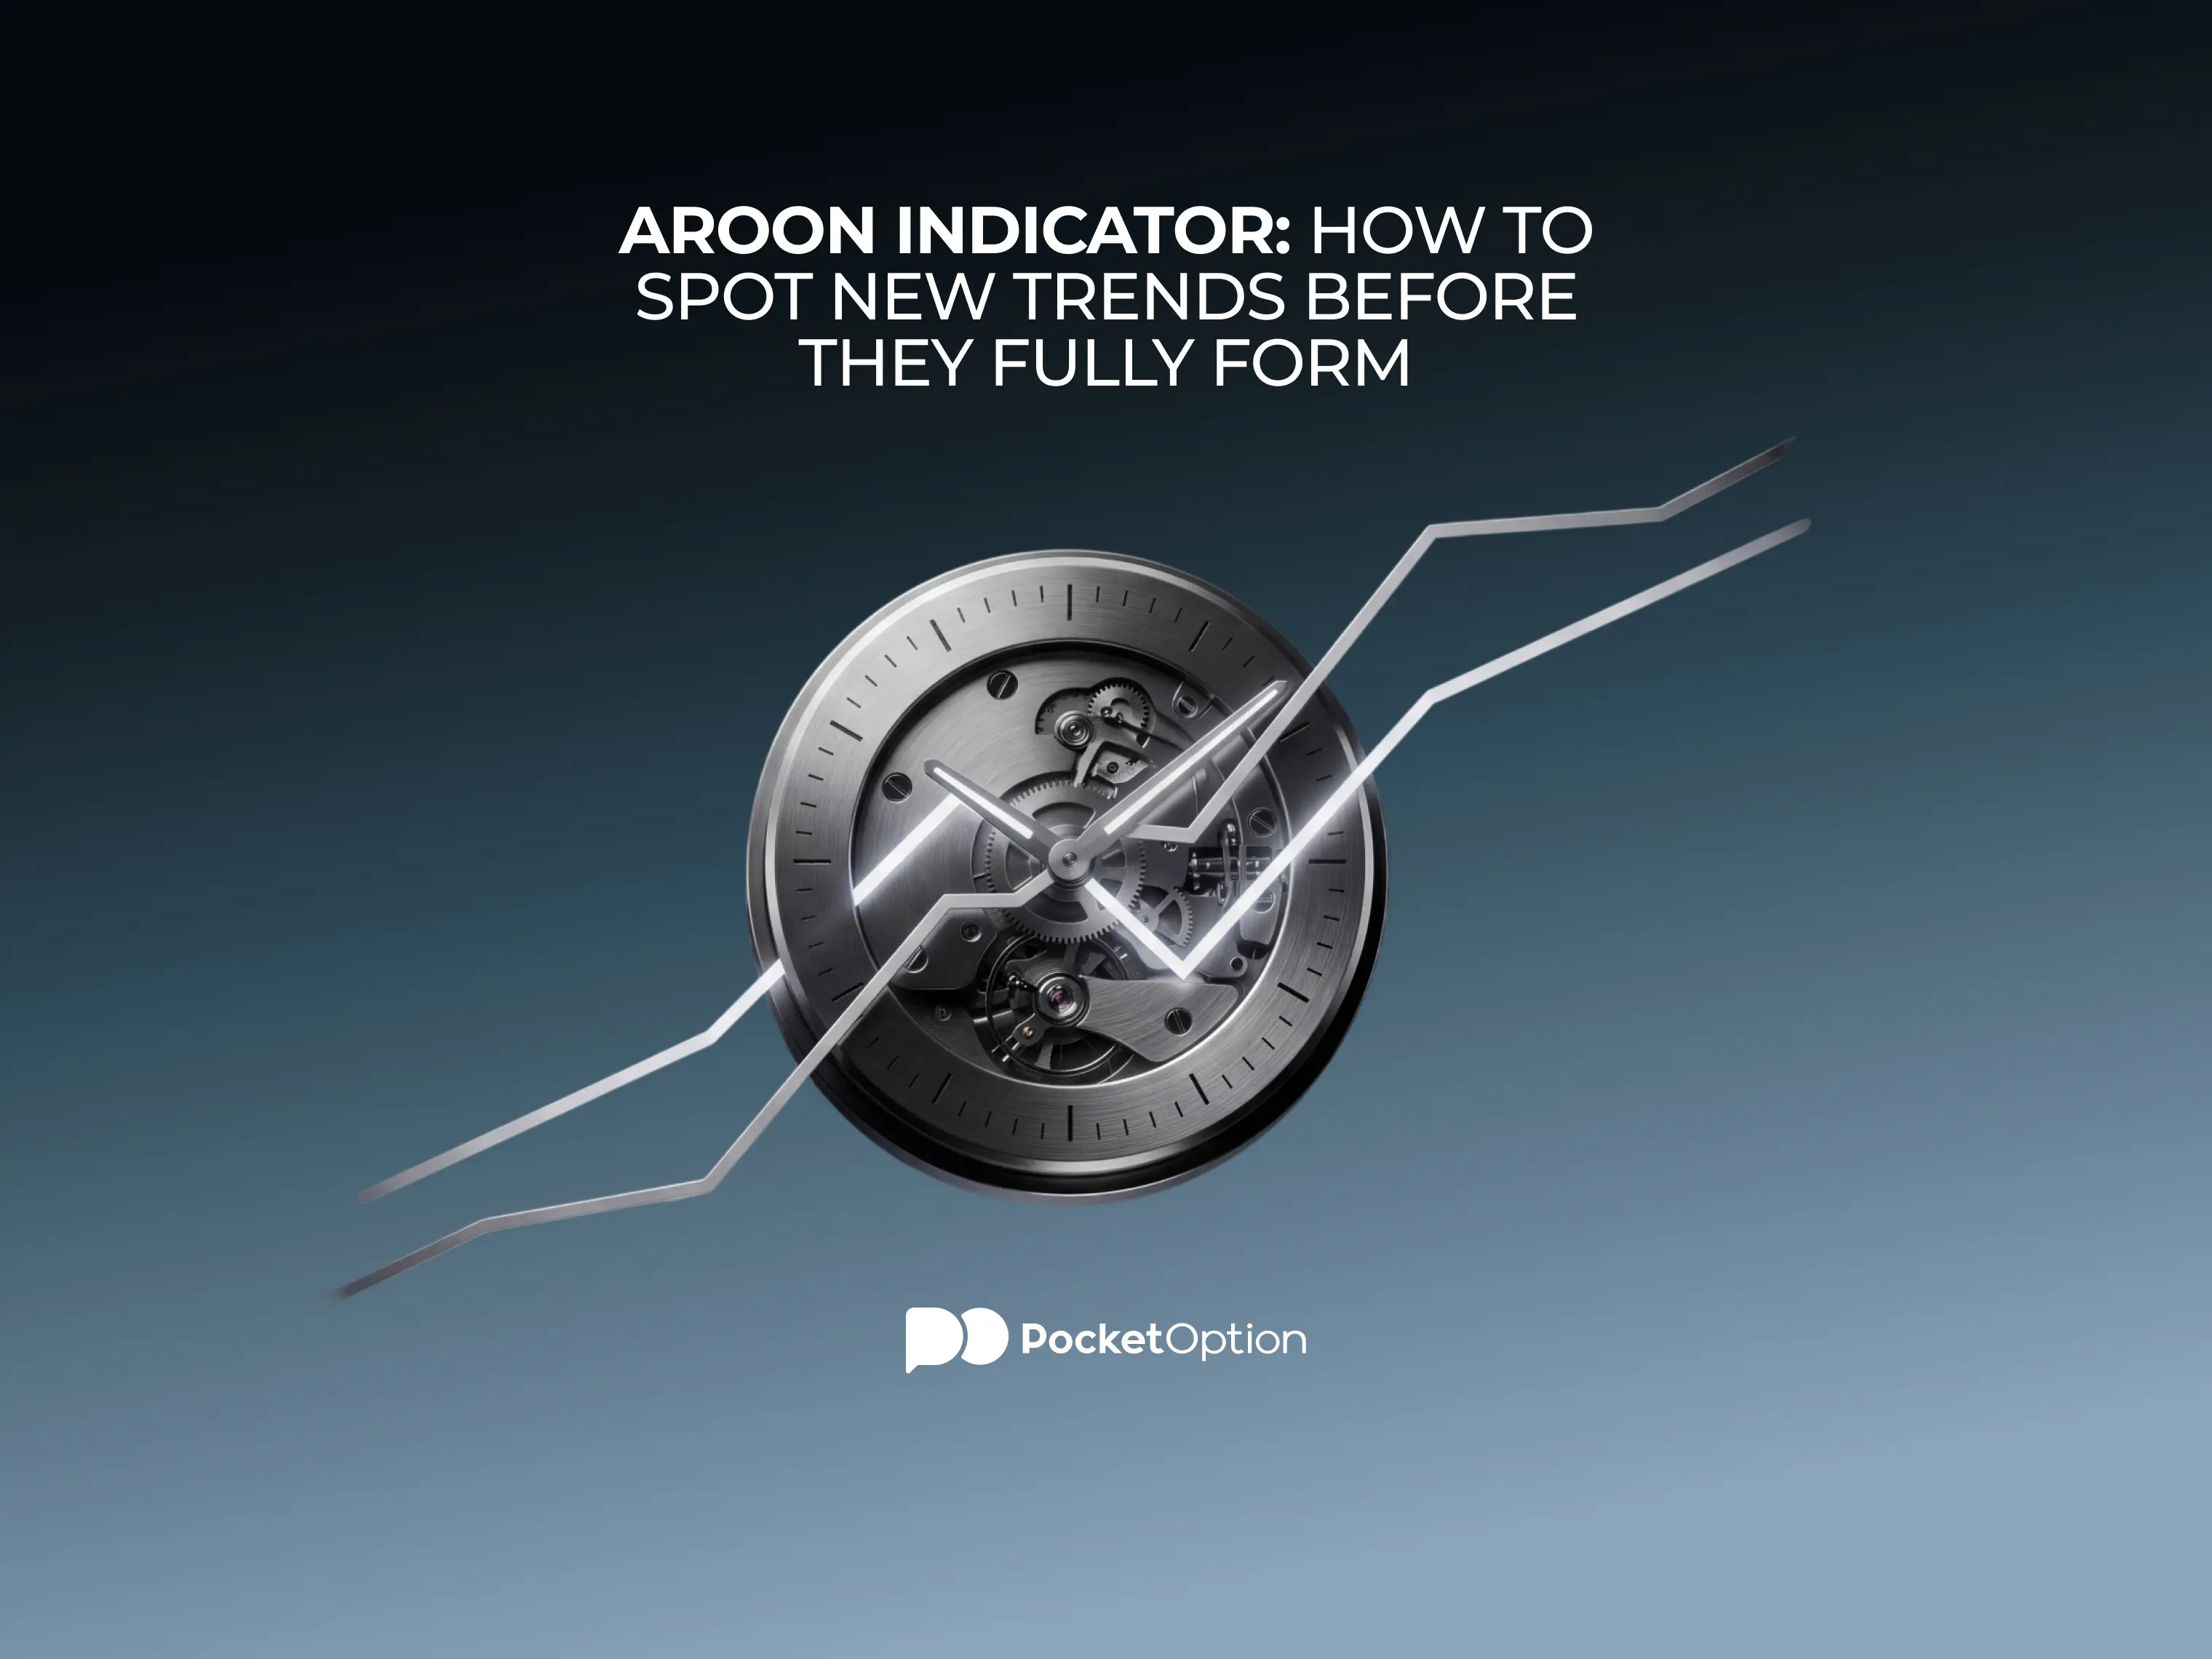
Aroon Indicator: How to Spot New Trends Before They Fully Form

The Aroon indicator counts time elapsed since the formation of the last market high or low. Thus, it can signal a new trend before it fully forms. Typically, it appears in the form of a simple crossover.
August 3120
Isolated margin allocating collateral to a single trading position
Albert RobertsonBearish
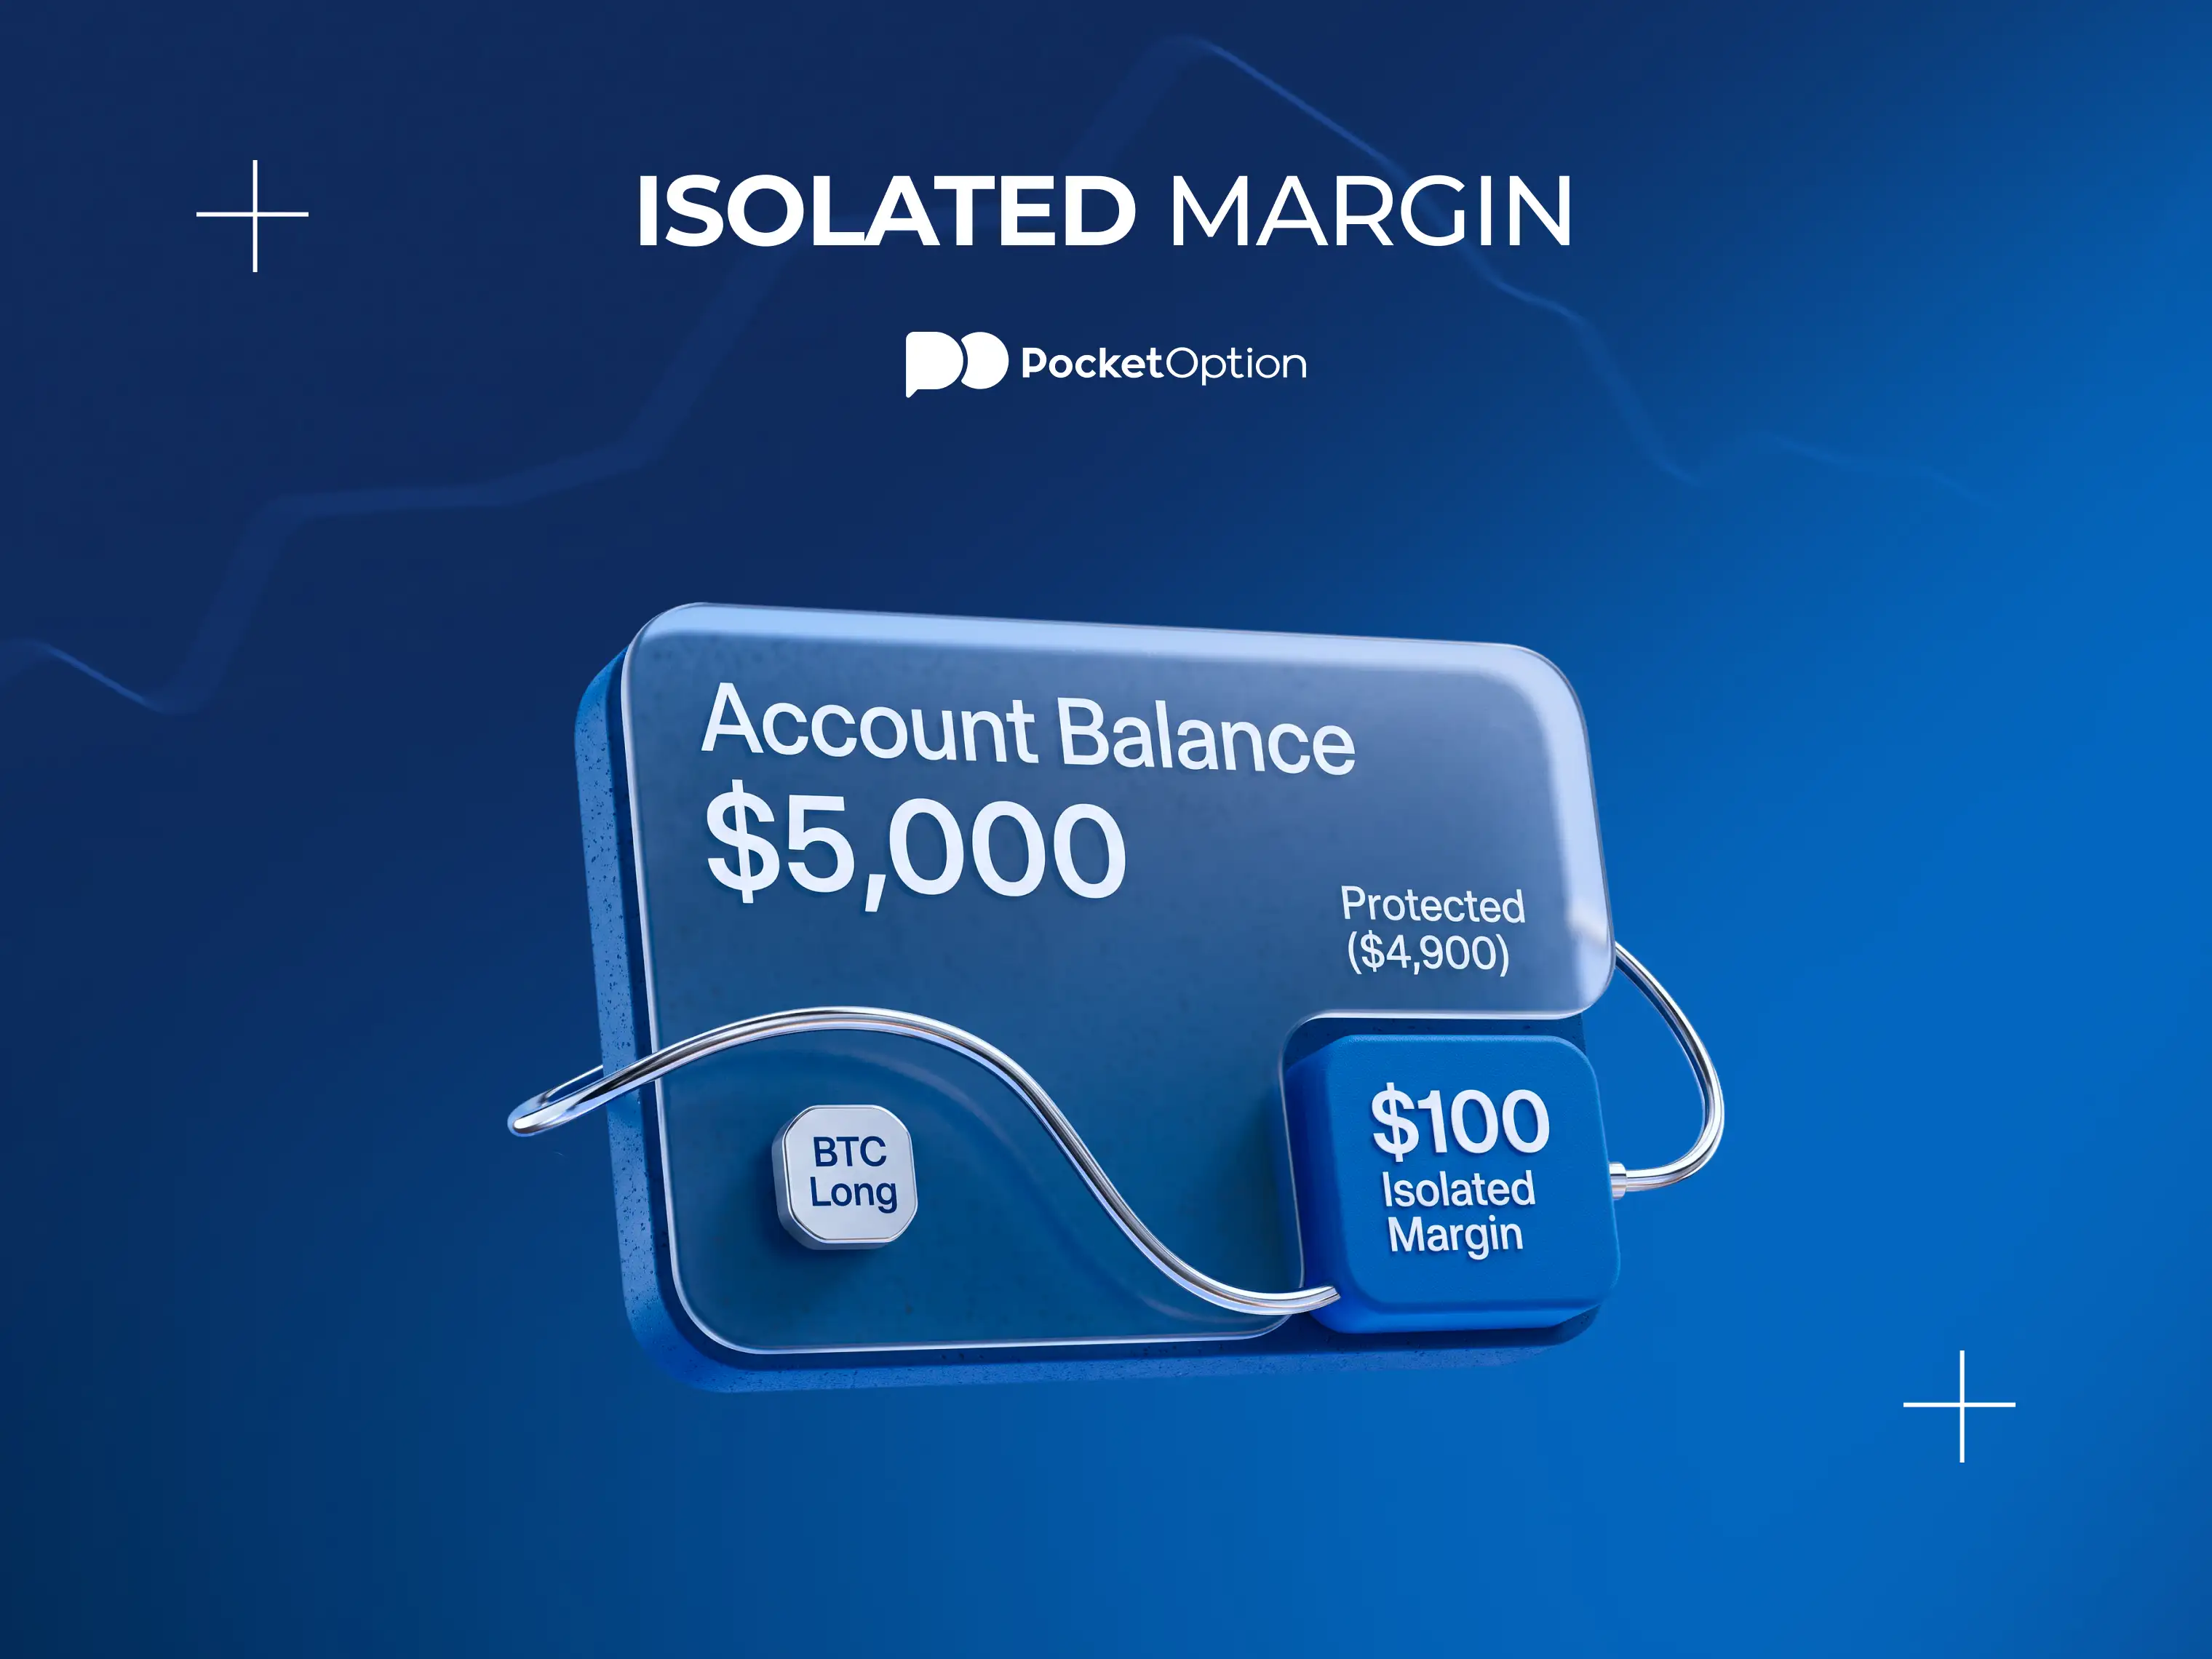
Isolated Margin: How It Limits Risk to a Single Position

Leveraged trading amplifies gains and losses alike. Isolated margin caps the damage: it assigns a fixed amount of collateral to one position, so a liquidation costs only that margin rather than the full account. This entry explains the mechanics, walks through an example, and compares isolated margin to cross margin.
August 3110
Value at risk formula displayed on a trading risk dashboard
Albert RobertsonBearish
Value at Risk (VaR): How Traders Estimate Potential Portfolio Loss

One number can capture just how much of its capital a portfolio stands to lose in an exceptionally bad day. This number is Value at Risk (or VaR) and is widely used by banks, investment funds, and even individual investors as a measure for assessing their risk exposure.
August 3110
SuperTrend indicator plotted on a price chart
Albert RobertsonBearish
SuperTrend Indicator: How to Trade Trend Reversals with One Simple Signal

The SuperTrend indicator plots a single line above or below price and flips color when the trend reverses. Because the signal is read directly from that color change, it removes much of the guesswork involved in interpreting other trend tools.

August 3120
Sidechain connected to a main blockchain through a two-way peg
Albert RobertsonBearish
What Is a Sidechain and How Do Sidechains Connect to Main Blockchains?

A blockchain sidechain is a separate network that runs alongside a main blockchain and allows assets to move between the two. Understanding what is sidechain architecture helps traders and developers evaluate the trade-offs between speed, cost, and security when interacting with different networks.
August 3110
Ichimoku Cloud chart with Kumo, Tenkan-sen, and Kijun-sen
Albert RobertsonBearish
Ichimoku Cloud Trading Strategy: Reading Kumo Signals on Pocket Option Charts

The objective of this guide is to enable you to learn how to use the Ichimoku Cloud to analyze the trend, momentum, and confirmation using the Ichimoku cloud breakout strategy on the Pocket Option trading platform.
August 3130
Elliott wave corrective patterns compared on a price chart
Elliott Wave Corrective Patterns: Zigzag, Flat and Triangle ExplainedAugust 31
top REITs comparison
Top REITs: Real Estate Investment Trusts and Trading Related Stocks on Pocket OptionAugust 31
Rounding bottom pattern chart example
Rounding Top and Rounding Bottom Patterns: How to Trade Slow, Curved ReversalsAugust 31
Penny stock risks: liquidity, volatility and pump-and-dump schemes
Penny Stock Risks: Liquidity, Volatility and Pump-and-Dump SchemesAugust 31
Types of financial instruments used in global markets
What Are Financial Instruments and How Are They Used in Markets?August 31
Short term trading strategies
Short Term Trading: How to Work with Quick MovesAugust 31
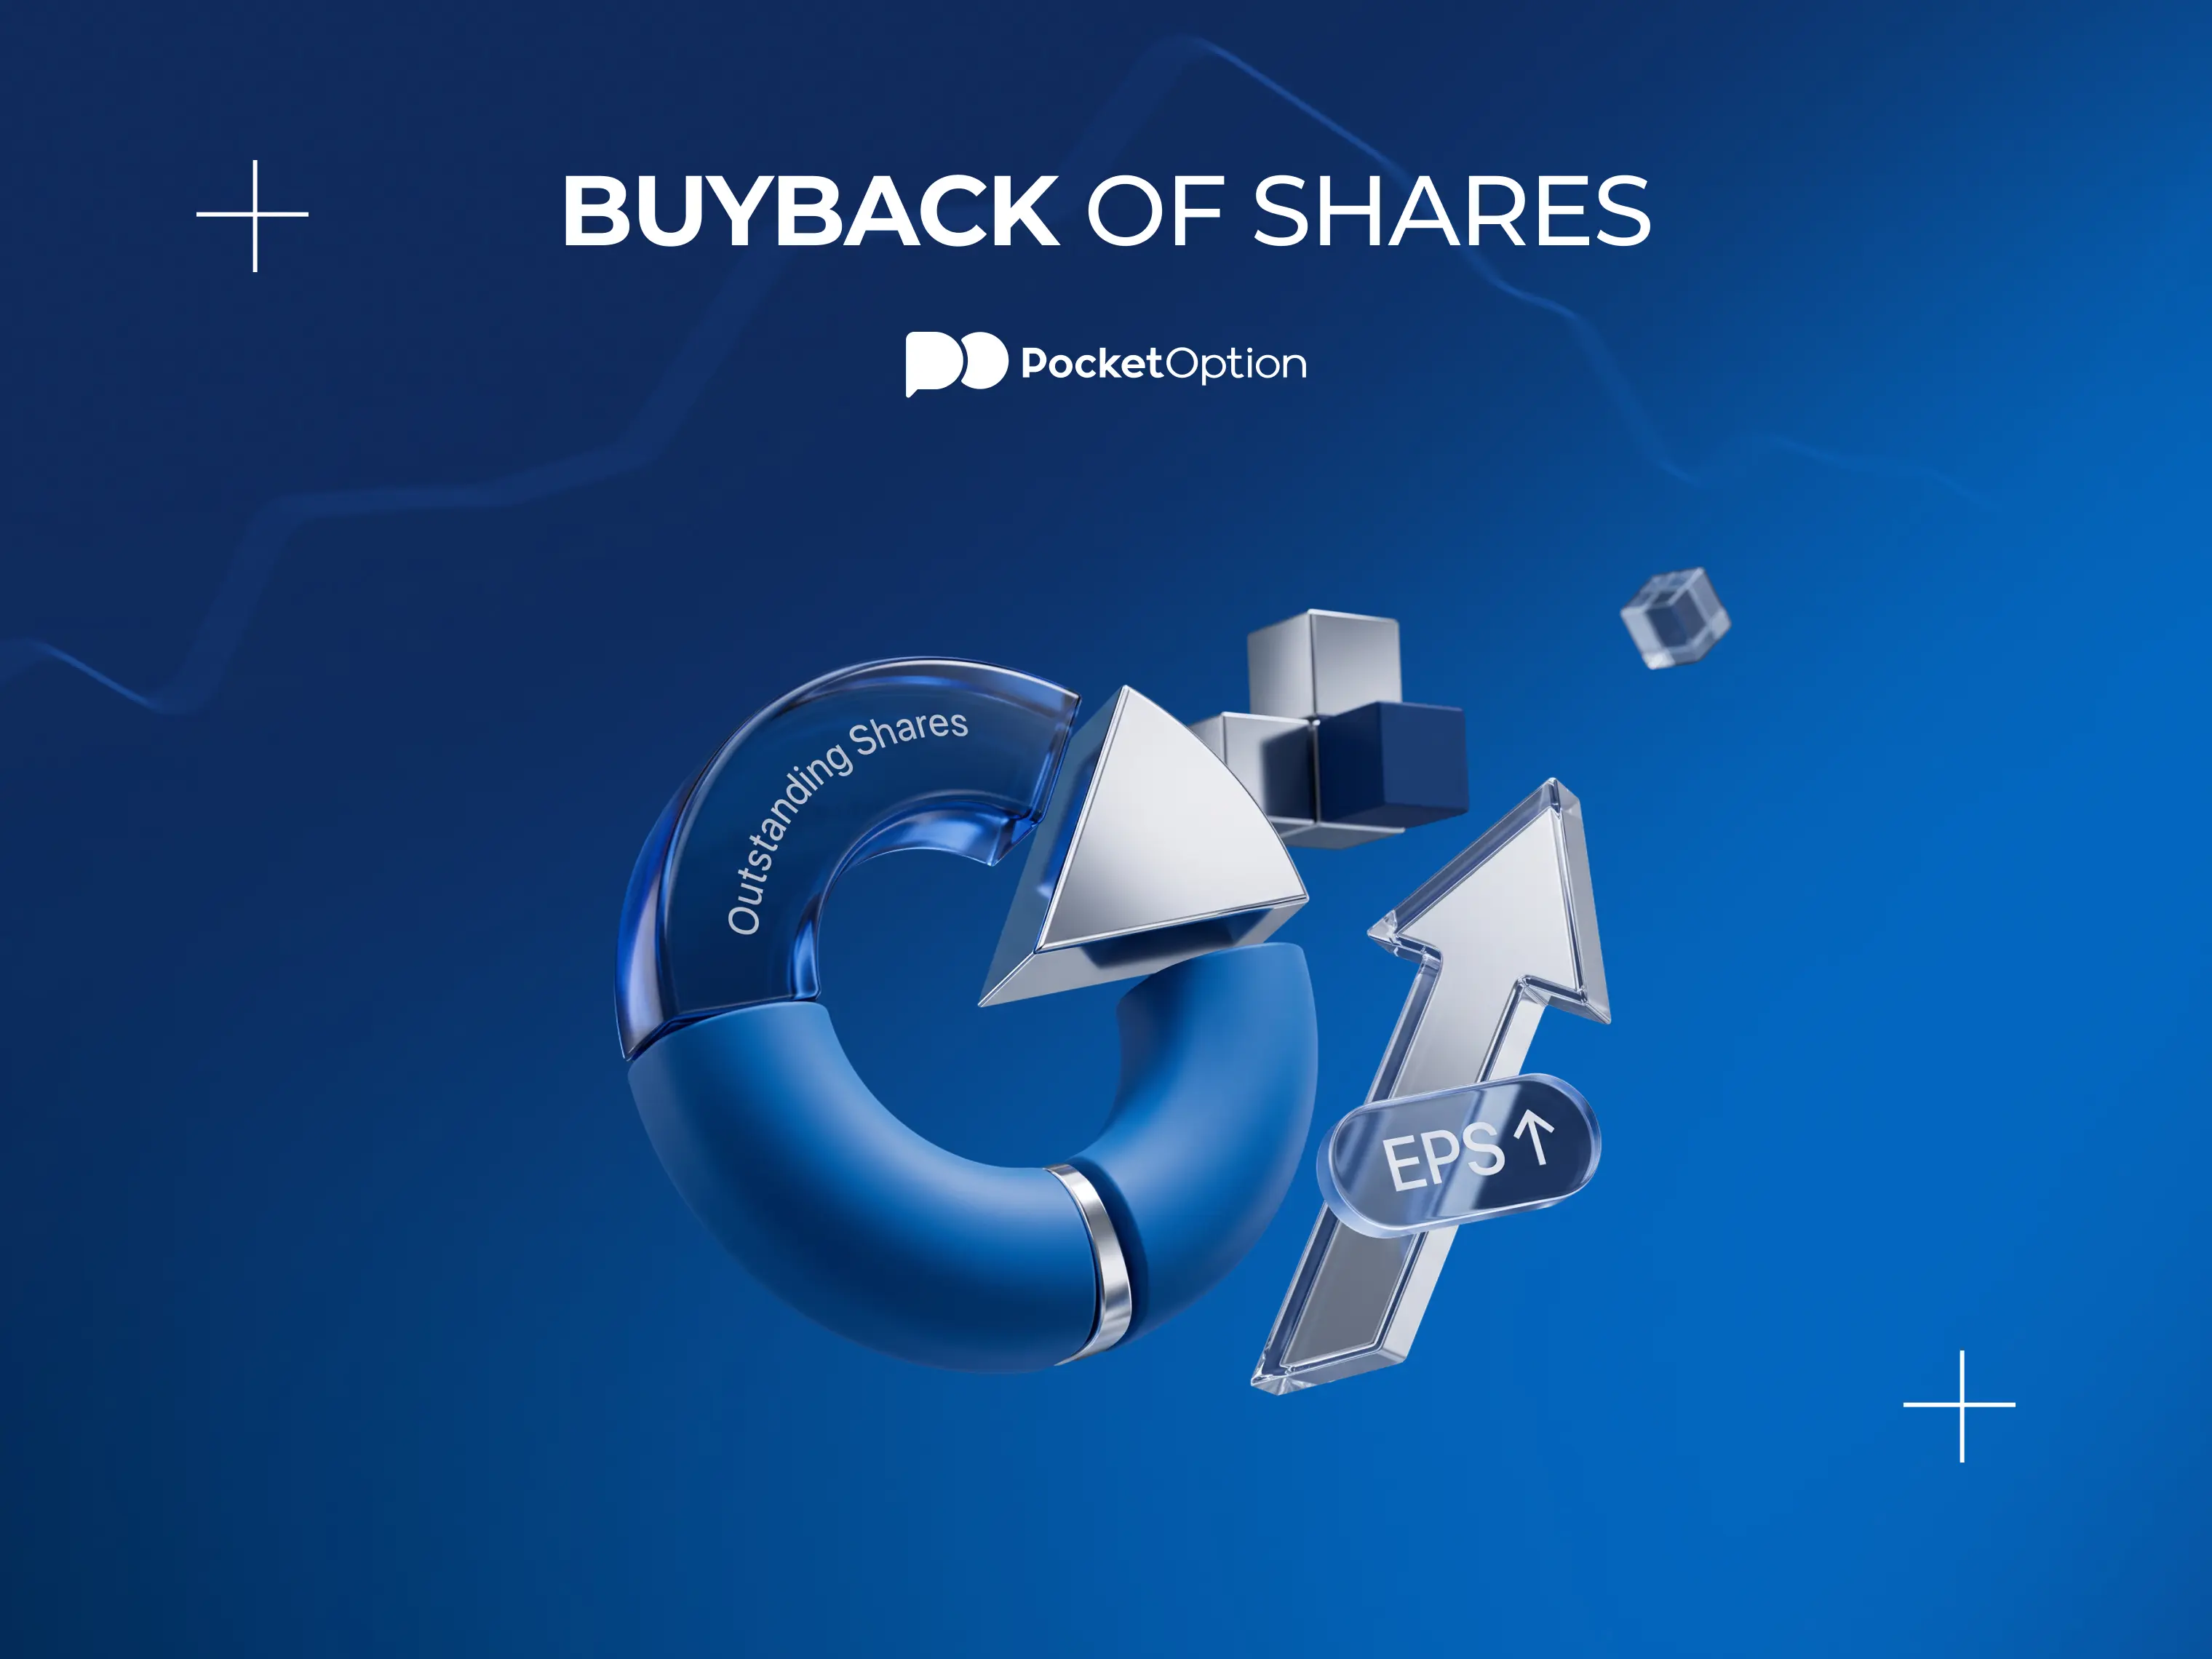
Buyback of shares reducing outstanding stock and boosting EPS
Albert RobertsonBearish
What Is Buyback of Shares and How Do Companies Repurchase Stock?

When a company uses its own cash to purchase its shares from the open market, the total number of shares outstanding falls. That single action ripples through earnings per share, ownership concentration, and stock price. This glossary entry explains what a buyback of shares is, the methods companies use, and how to judge whether it genuinely benefits shareholders.
August 3130
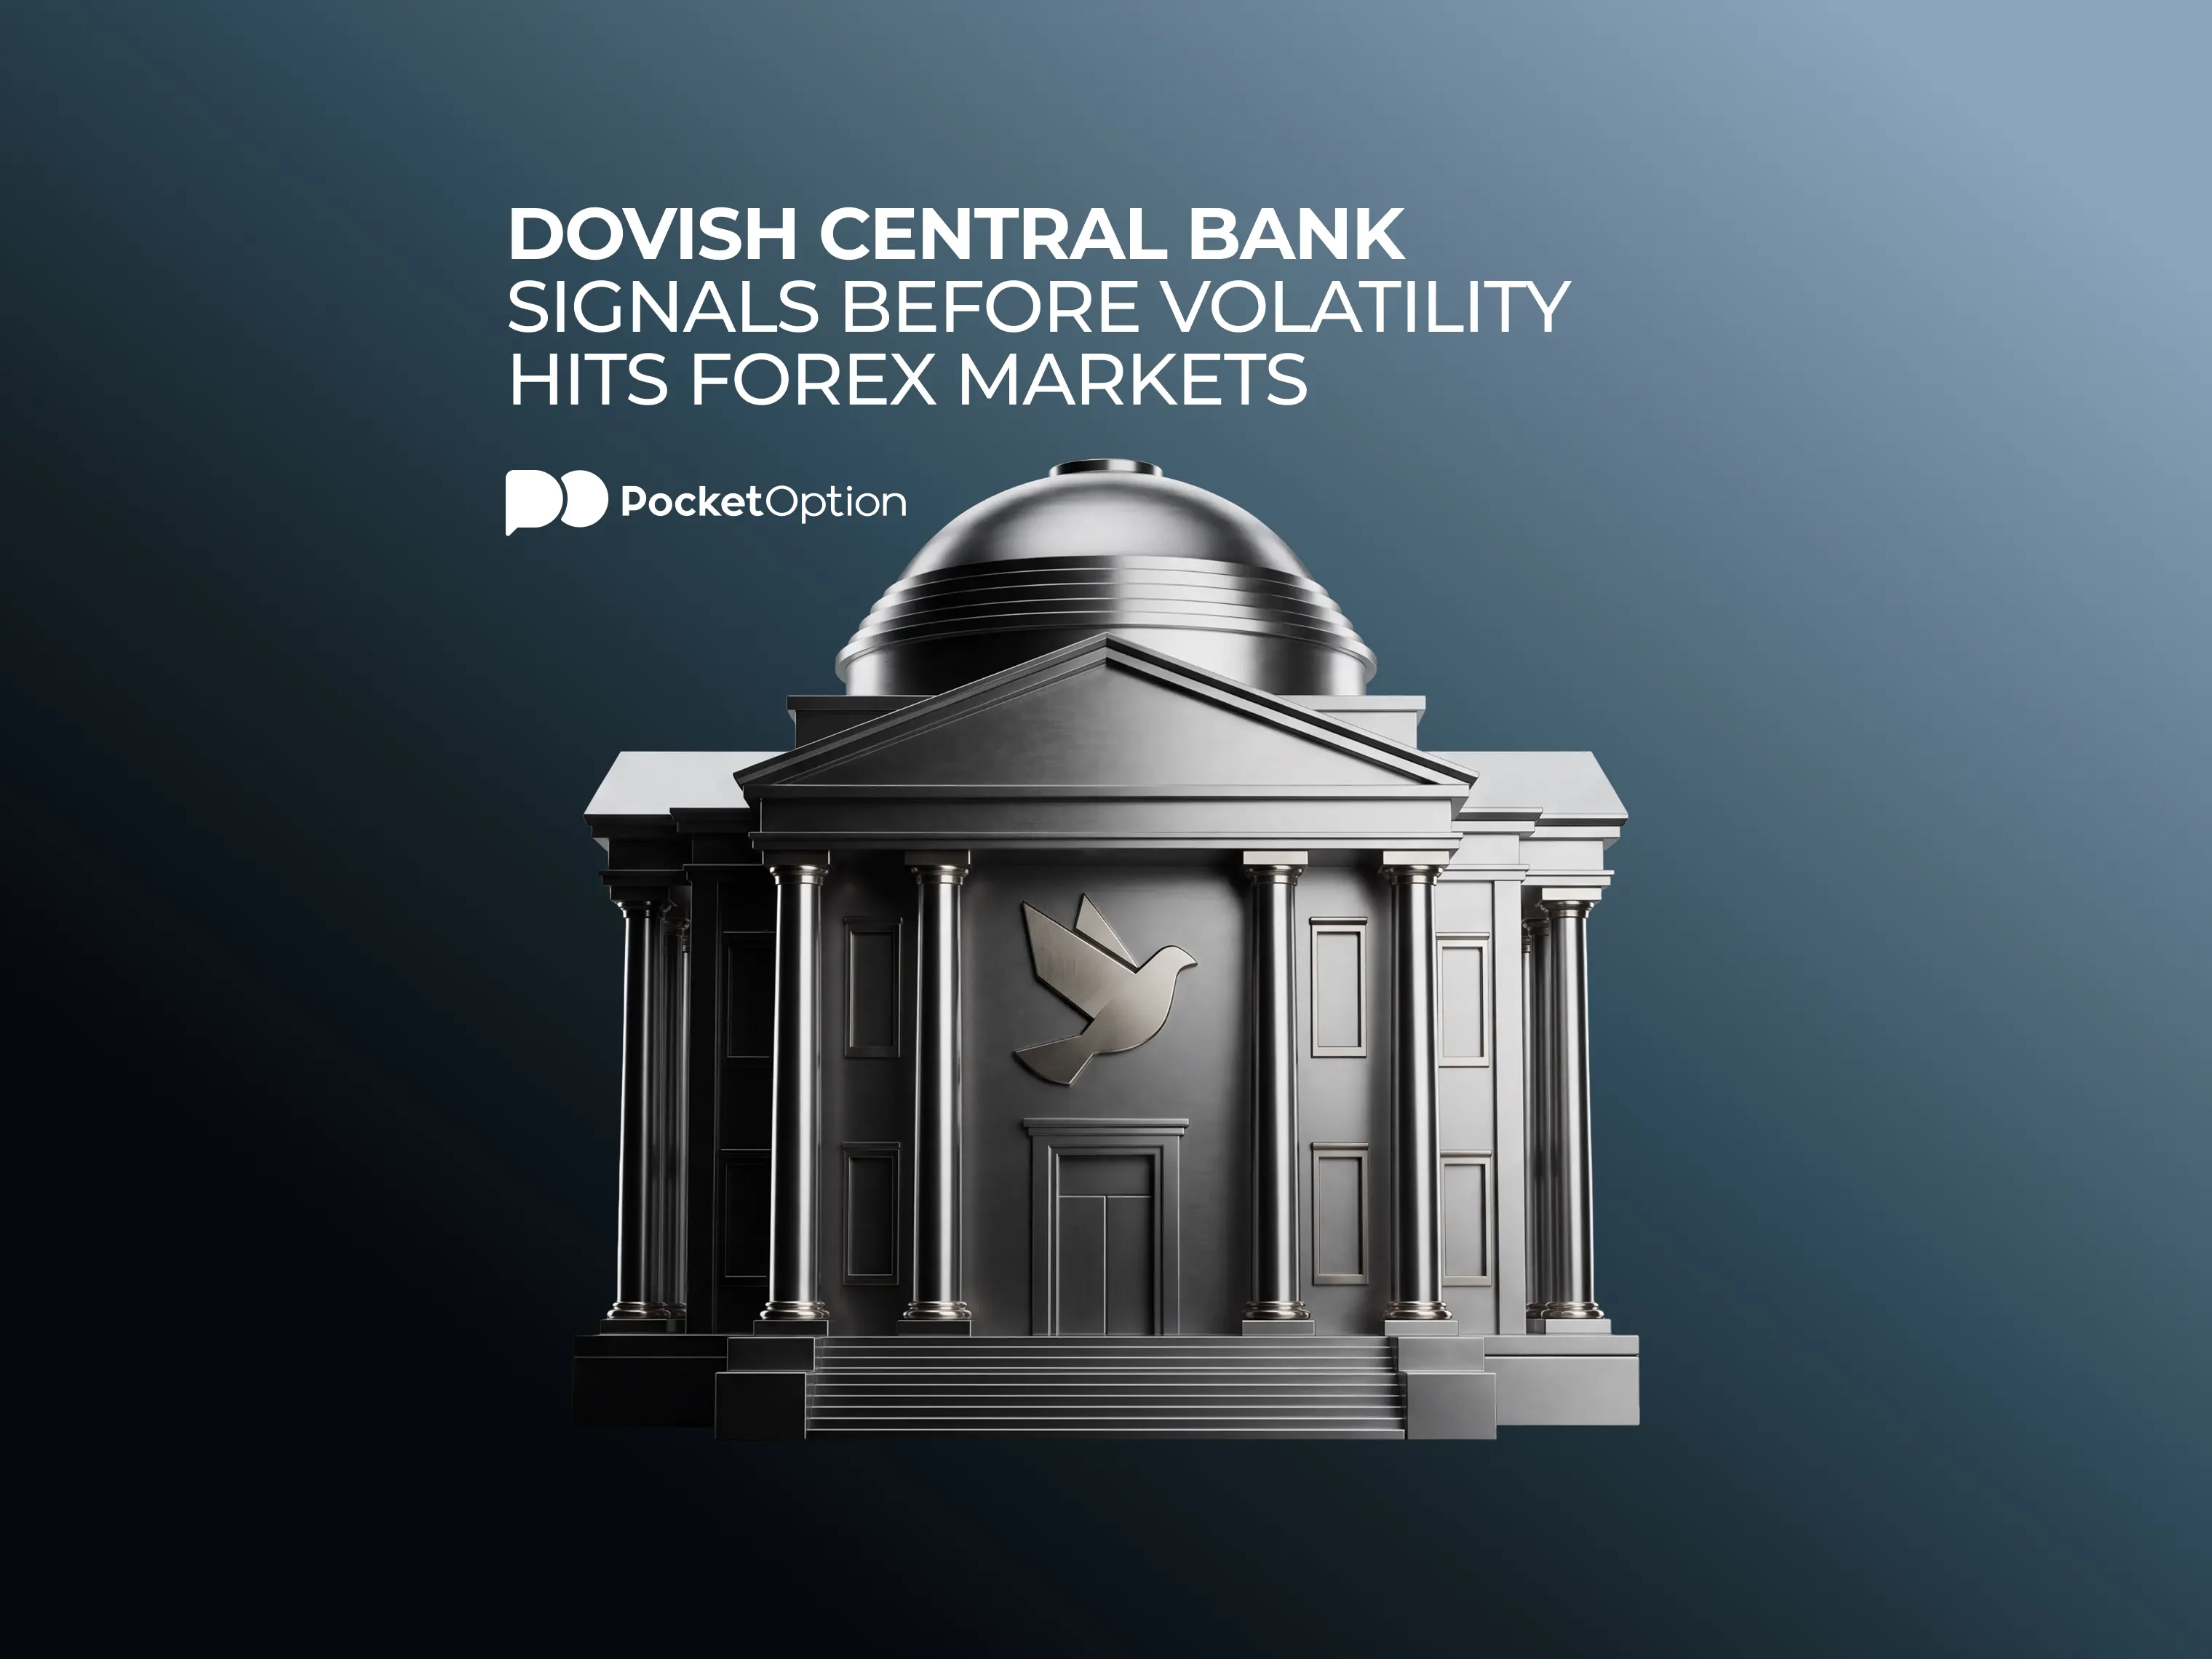
Dovish central bank signal moving forex currency pairs
Albert RobertsonBearish
Dovish Central Bank Signals Before Volatility Hits Forex Markets

Central bank language can move a currency pair further and faster than any data release. When policymakers shift toward a dovish tone, the signal often reaches forex markets before the rate decision. This entry explains what dovish means, how it contrasts with hawkish, and what traders watch for when a policy shift is forming.
August 3130
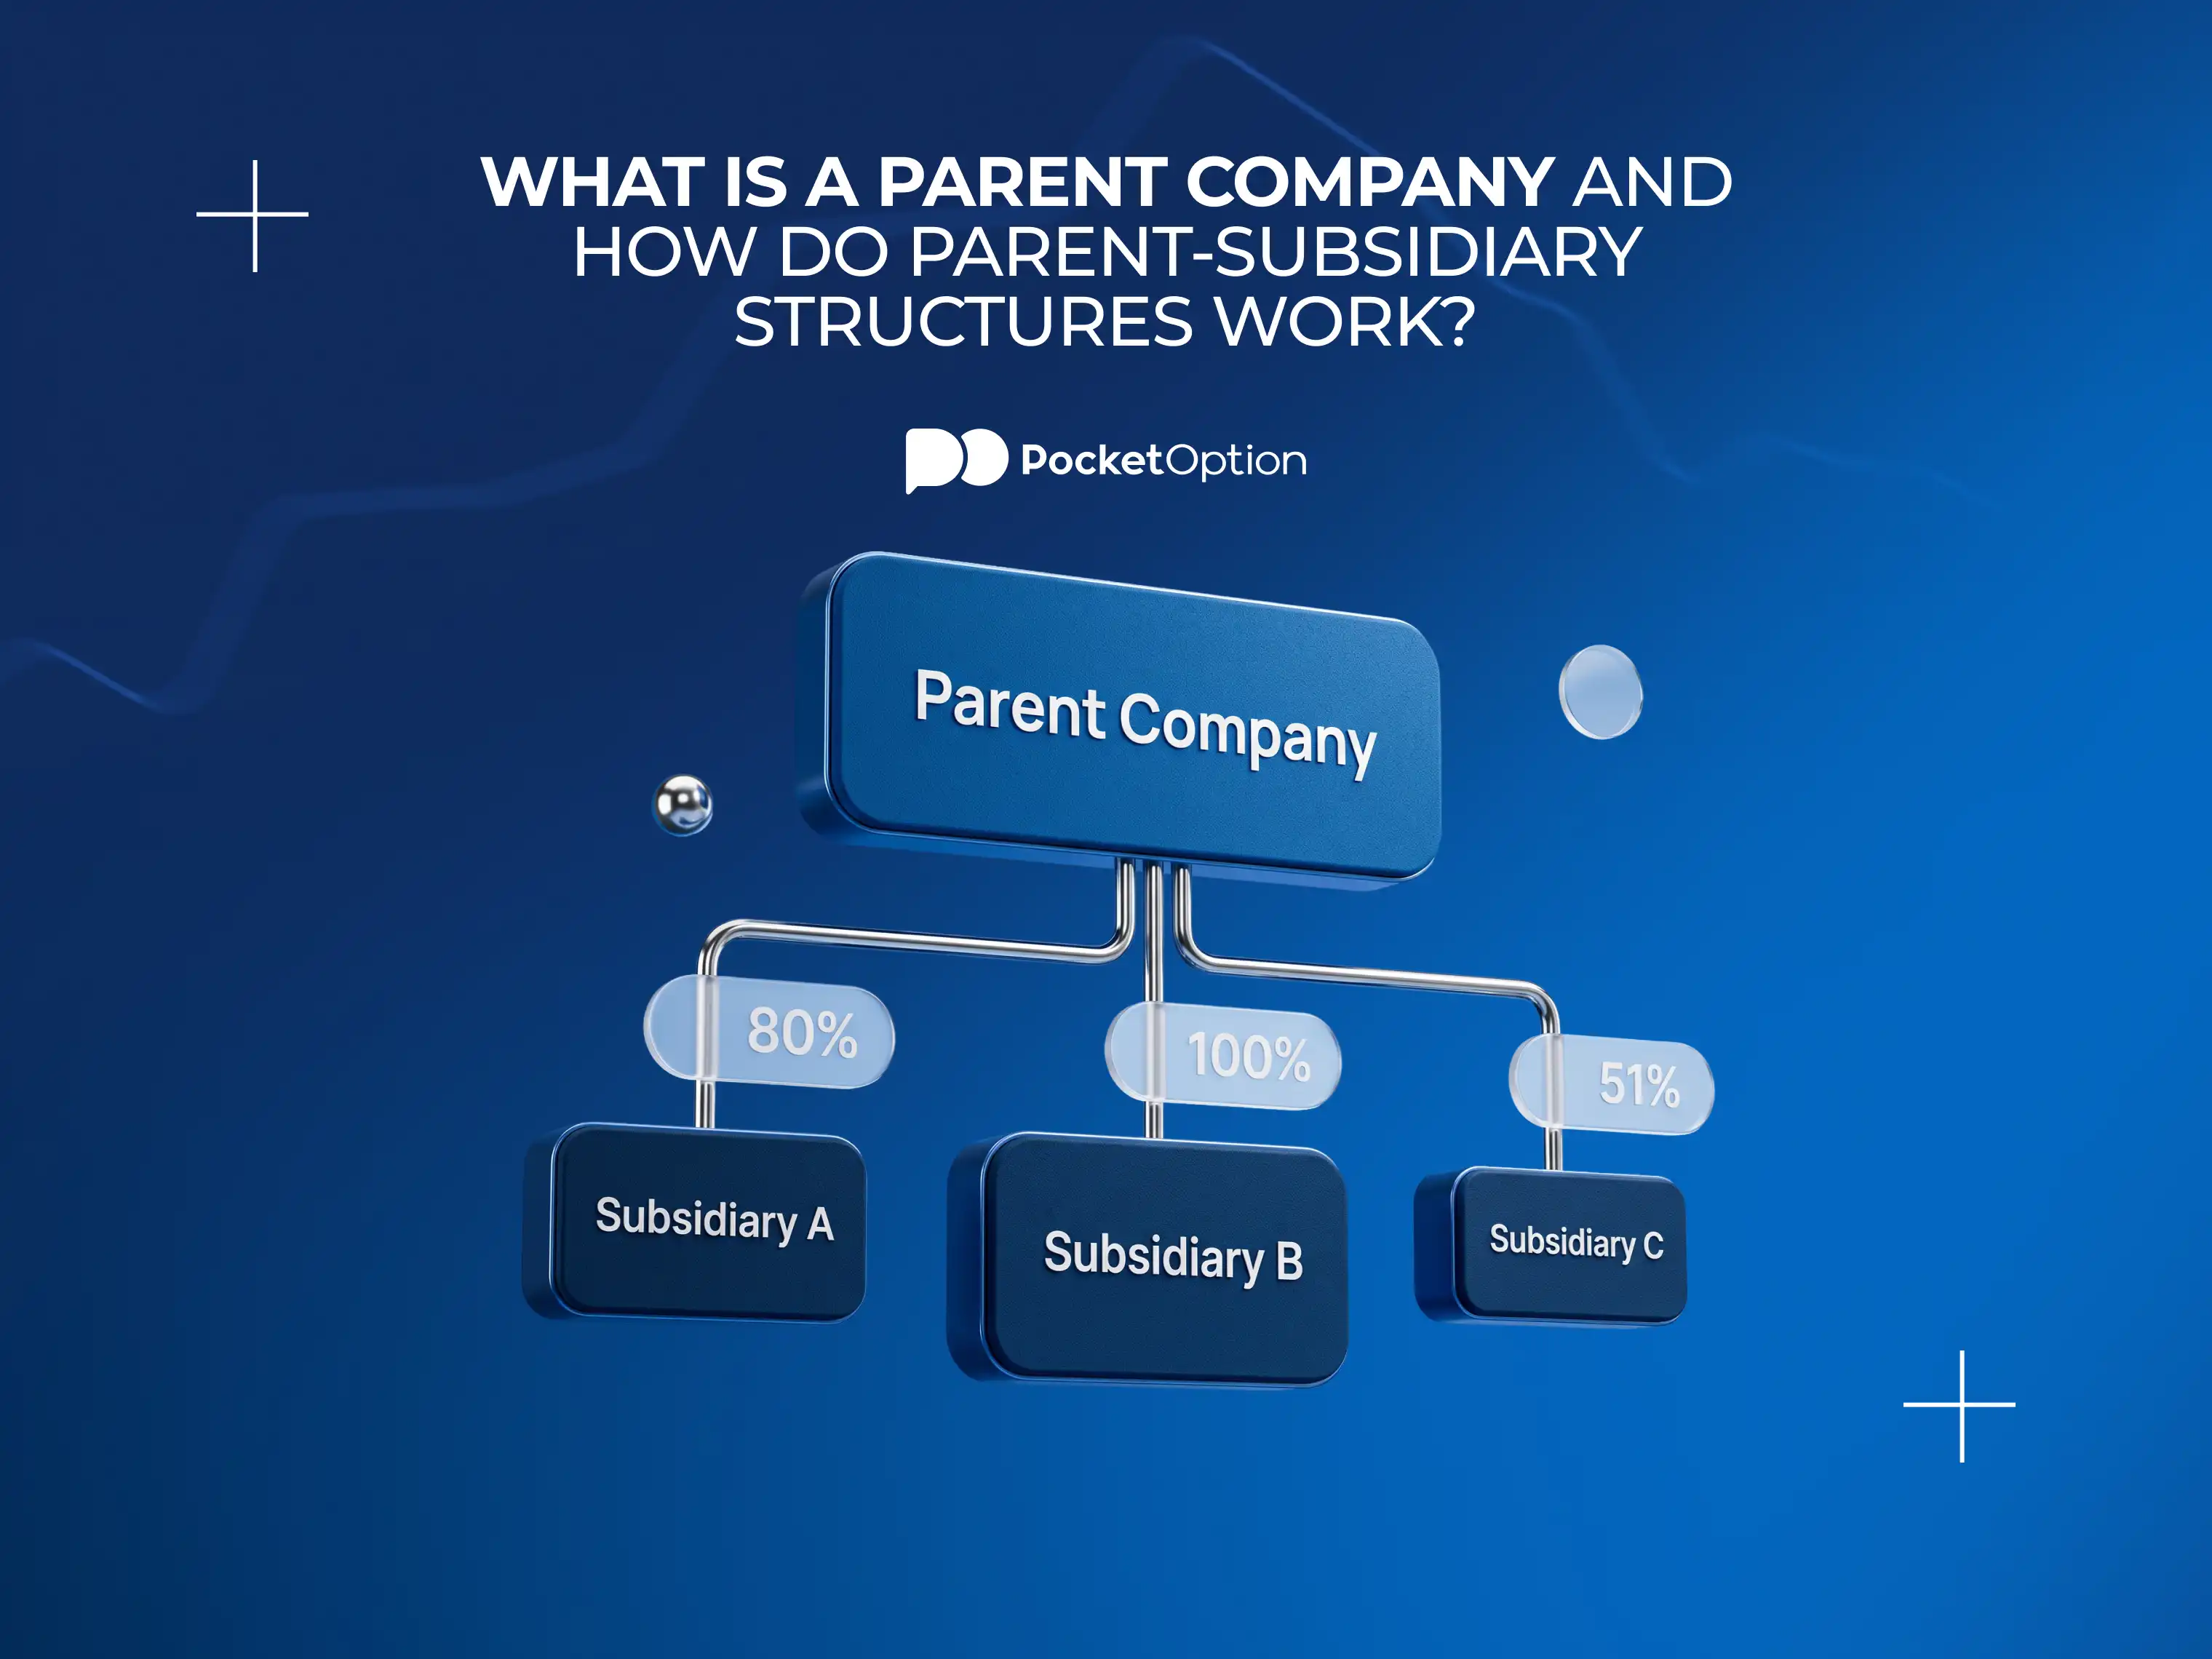
Parent company and subsidiary corporate structure
Albert RobertsonBearish
What Is a Parent Company and How Do Parent-Subsidiary Structures Work?

When a trader buys company stock on an exchange, the ticker typically represents the parent company, not any single business line underneath it. Understanding what a parent company is and how subsidiaries feed into consolidated results is essential for reading financial statements accurately.


August 3110
  • 1
  • …
  • 10
  • 11
  • …
  • 12
  • …
  • 467