Rounding Top and Rounding Bottom Patterns: How to Trade Slow, Curved Reversals
Formations of rounding top and rounding bottom shop that the market starts to reverse, gradually. This may help inform trading and investing decisions. But how does each shape take form, and how exactly to confirm this breakout (or breakdown) on the chart?

What Are Rounding Top and Rounding Bottom Patterns
Rounding top and rounding bottom patterns are part of stock chart patterns used to spot trend reversals in advance. They are built from a long series of small highs or lows, which slowly curve into a bowl or a dome. A rounding bottom pattern is often seen in major stocks and ETFs. It appears after an extended downtrend, as selling pressure subsides, and buyers slowly regain confidence in the asset again. The opposite shape, a rounding top, appears after an extended uptrend, and is commonly spotted in S&P500 and NASDAQ, after multi-months uptrend.
The curve is gradual, so a good amount of candle bars must establish it, before the pattern is formed. However, even though the pattern may take weeks or months to unfold, it can still be used to inform trading decisions. You can read our overview of chart pattern recognition to understand how to analyze it.
Rounding Top: Dome Shaped Bearish Reversal
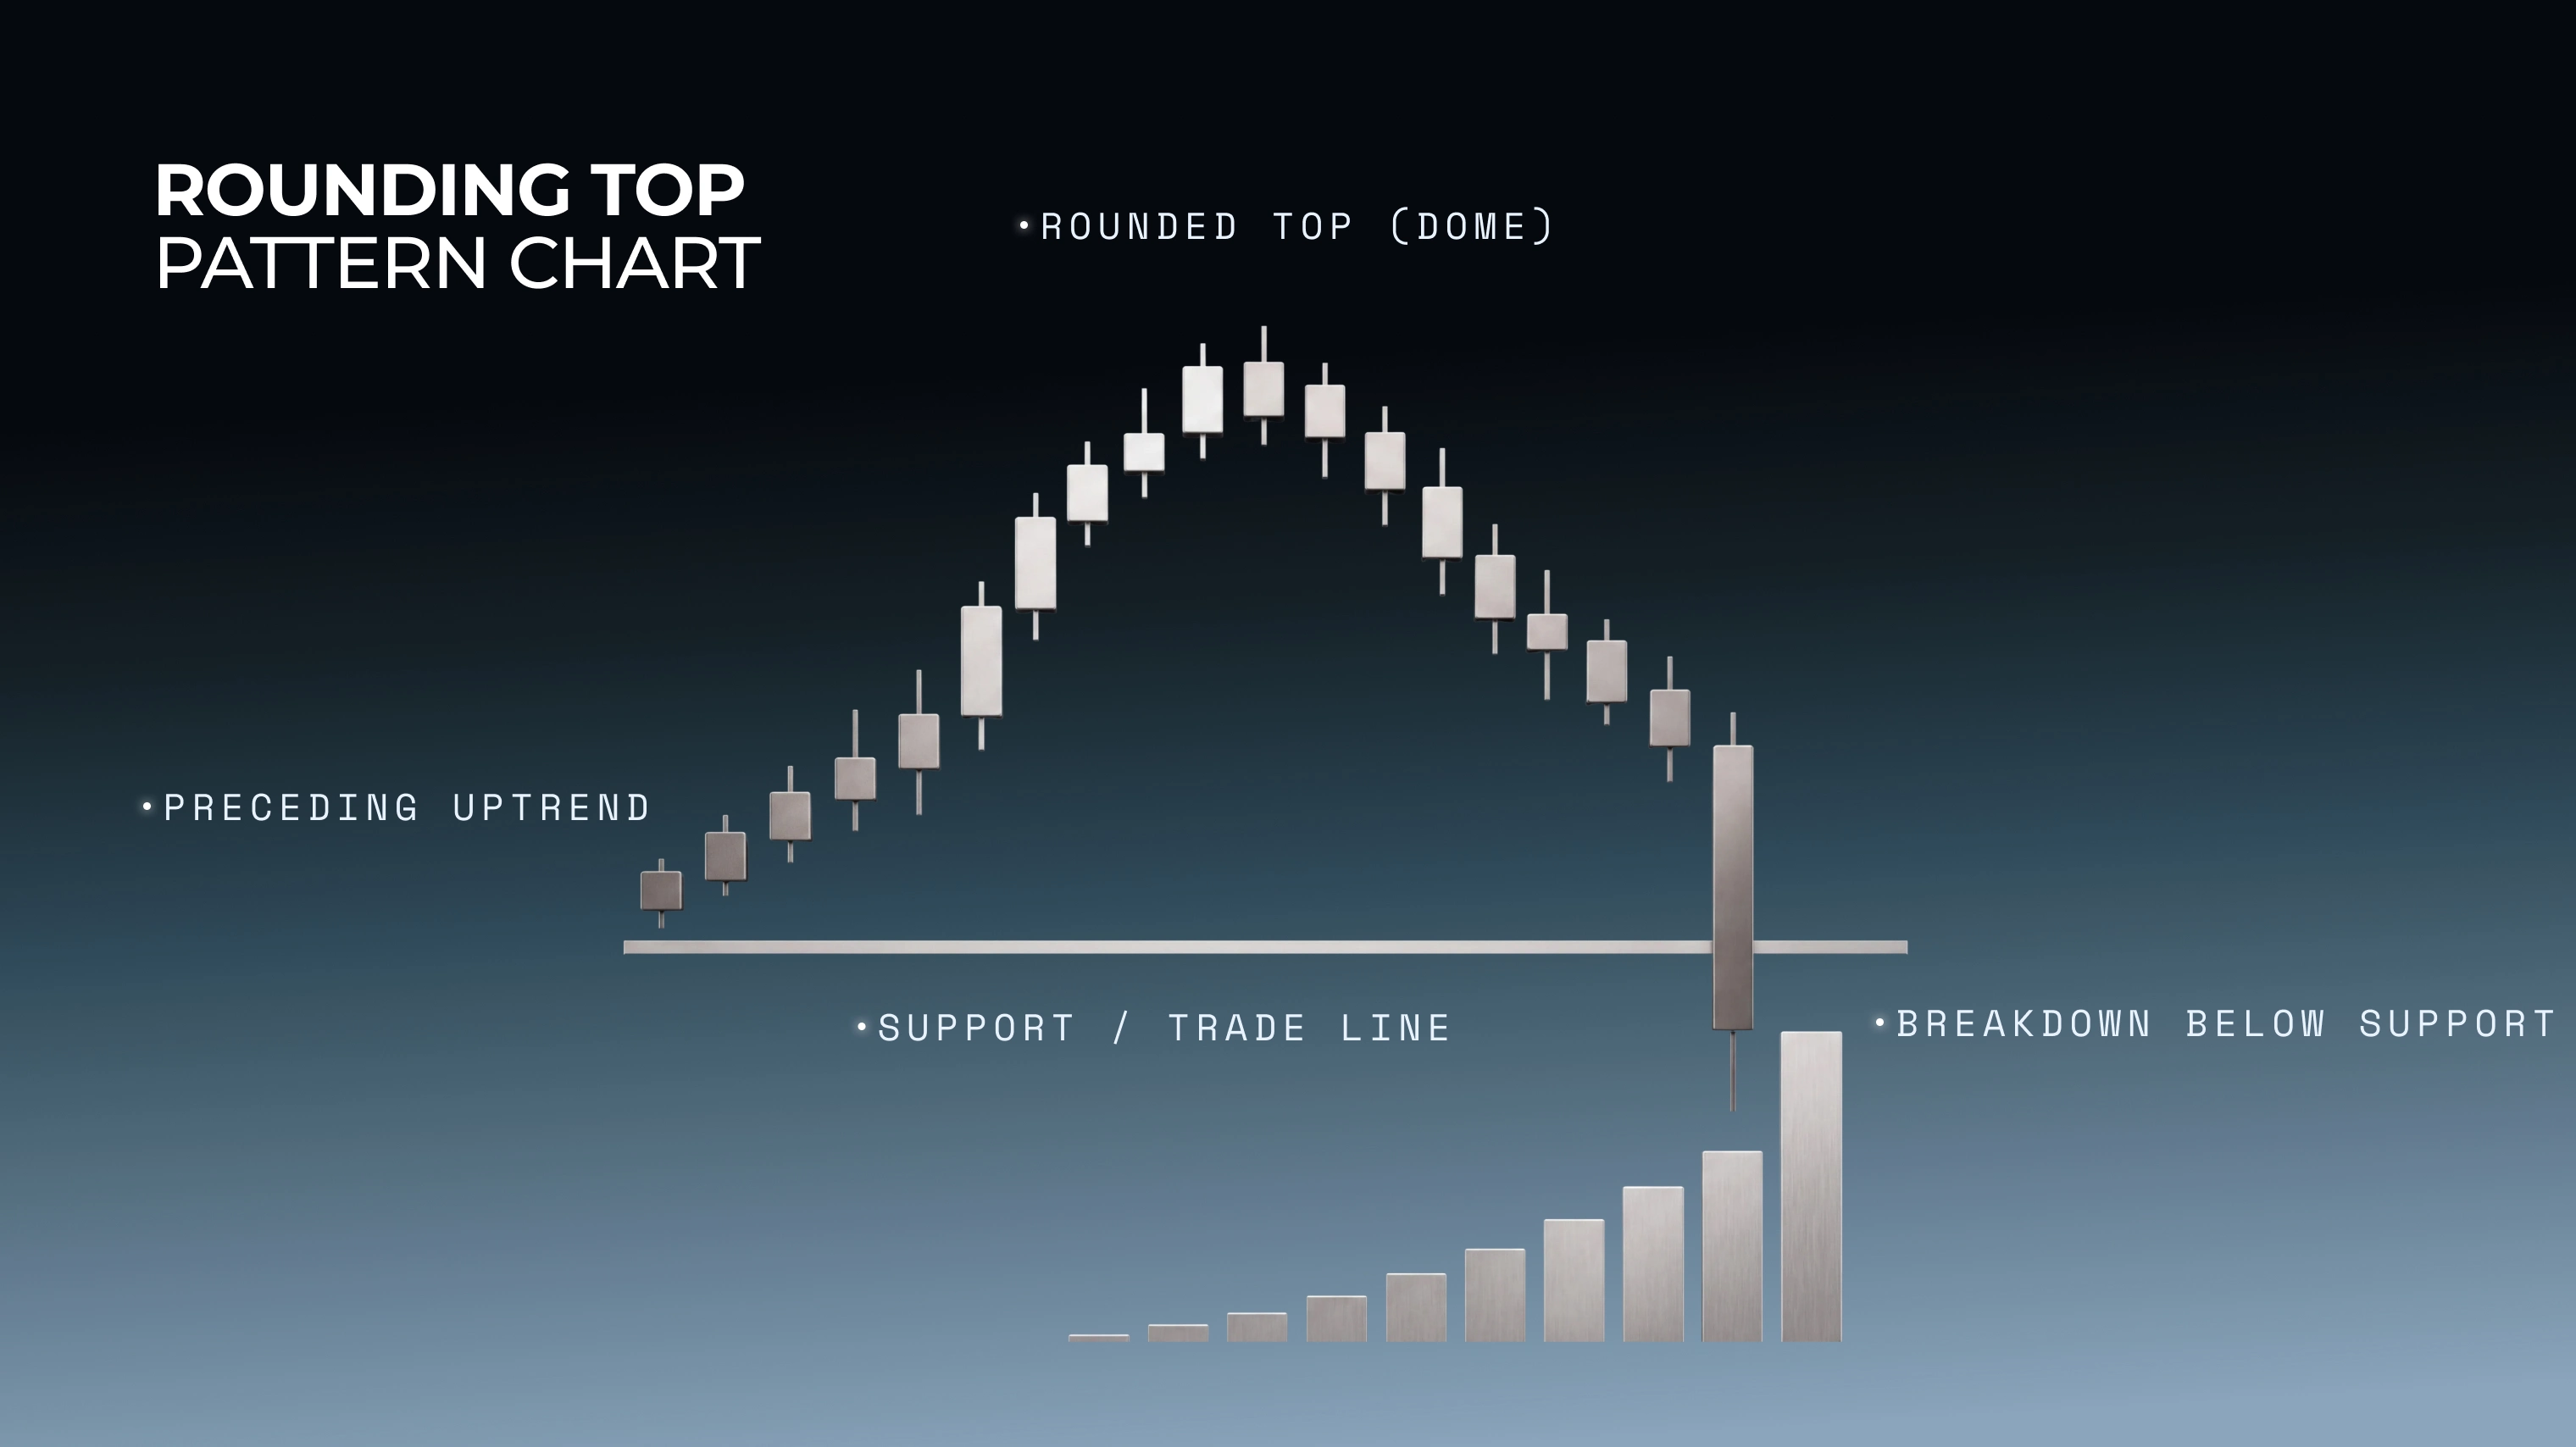
A rounding top forms on the chart when an uptrend starts to fade, and momentum is being lost. Then, if the asset is slow, instead of rapidly crashing, price traces a smooth arc, having a few highs at near the same point, rather than any sharp spikes up or down.
During this time, trading volume often declines, which can be seen on any volume indicators. Then, as the right side of the dome starts going downward (the 'breakdown'), the volume actually picks up, as some traders realize (too late) that the path of least resistance is now down.
The rounding top pattern is rather unreliable on a short timeframe, but is clearer on daily or weekly charts. The full reversal is considered complete once price closes below the level that marks the base of the curve. That is usually the level of support for the pattern, and a level where many take-profits are closed, because otherwise an asset might experience a sharp reversal in price.
Rounding Bottom: U Shaped Bullish Reversal
A round bottom is the mirror image of the dome shape. Price slowly tries pushing lower, but flattens out along the base, exhausted and with not many more sellers left. This bottom price starts to become a massive support, and when the market gains confidence in the fact that this price will not break, the chart slowly starts curling up. Demand returns, and asset gains bullish momentum.
Volume is lowest near the middle of the curve, marking it as the bottom price where the remaining selling pressure is weakest. Then, buyers slowly take over, and volume rises. This can take weeks or even months, like for Bitcoin in much of its bear markets. The round bottom pattern is named this way ('U-shaped') because it resembles a shallow bowl rather than a sharp V.
Why Rounding Patterns Form So Slowly
The reason is psychology. In a rounding top, optimism for the market slowly fades, bit by bit. Less buyers are willing to pay these prices, and slowly a distribution is happening underneath. In a round bottom, pessimism that the asset is 'going down forever' eases in the same way, slowly, as new lows don't form for weeks or months. This starts to reunite investing spirits, and a pool of buyers begins to materialize.
A sharp reversal is often triggered by just a single news piece, or a sudden rush to buy/sell. There's no underlying long-term shift in psychology there. That's why predicting sharp reversals is notoriously difficult. But rounding patterns appear slowly, and can be easily acted upon, in ample time, if recognized.
Rounding Patterns vs Head and Shoulders: Key Differences
Both rounding patterns and the head and shoulders (and reverse H&S) show slow reversal of a trend. But on the price chart they can behave quite differently. A H&S pattern has three distinct peaks (or troughs), and usually happens in a matter of days or a few weeks, because each shoulder forms a defined swing. It can also be more brutal and fast to resolve, and works on smaller timeframes, albeit less reliably.
Meanwhile, a rounding pattern has no distinct swings, and unfolds as one continuous curve, that can take months to resolve.
Feature | Rounding Pattern | Head and Shoulders |
|---|---|---|
Formation time | Several weeks to a few months | Days to a few weeks |
Structure | One long curve | Three peaks/troughs, with a neckline |
Reversal signal | Break of the trade line, ending the curve | Break of the neckline, which joins two troughs or peaks |
Confirmation | A break with above average volume | A break, often with a volume spike |
For a closer look at the three versions of the H&S on the charts, read our guide to the inverse head and shoulders pattern. It explains how the bullish and mirrored versions can be identified and traded.
Drawing the Trade Line (Neckline) to Track the Pattern
Unlike H&S, a rounding pattern is one of the stock chart patterns with no clear line of entry or exit. So instead, traders are forced to draw what is called a 'trade line' instead. This is the level where the expected breakout, or breakdown, should happen.
The line is usually drawn near a common support or resistance level (either from previous price points, or from Fibonacci levels). If you want to know in-depth how to identify those levels, you can read our guide to support and resistance, but generally, in this case, users:
Mark the lowest points on either side of a rounding top, which sit below the dome and act as a support level, or the highest points on either side of a U-shaped bottom, which sit above the curve and act as a resistance level.
Draw a horizontal line connecting those points. This forms a trade line.
They watch as price approaches this line again from above (rounding top) or below (round bottom). For a rounding bottom, the reversal is considered confirmed once price closes above this line, breaking through the resistance. For a rounding top, it's the reverse: the reversal is confirmed once price closes below this line, breaking through the support. Wait for a full candle close beyond the trade line, in the direction that matches the pattern, if you want to confirm the breakout.
Why Entering Too Early Is the Most Common Mistake
Entering too early, trying to guess 'the exact bottom price', and not waiting for confirmation is the most common mistake when trading distribution patterns. The shape here develops very gradually, so it can take weeks or months before the pattern completes, which takes impatient traders to their limits. If you want to trade this pattern, you need to make sure that you won't be impacted if the price continues chopping sideways for another 2-3 months. Capital tied up in a slow-moving trade for that long has an opportunity cost, and depending on the account and instrument, ongoing holding costs can add up as well.
Do not expose yourself to repeated false starts. Price often tests the line multiple times without closing beyond it and confirming the breakout. A disciplined approach is to take the trade after a breakout was confirmed. Earlier moves are treated as noise rather than a signal.
Confirming the Breakout with Volume
Volume adds an extra layer of confirmation. If price goes beyond the trade line, and the volume picks up, your confidence level in this specific trade should increase. A breakout on rising volume shows that market participants are helping this new direction, and are being increasingly confident in it. Breakouts on thin volume, in comparison, are much more likely to fail.
This matters most in the 1st or 2nd session after the line was broken. Subsequent candles are not as important. For a more in-depth explanation, consult our volume indicator guide, where we cover how that indicator can be applied on a live chart for maximum results.
Setting Entry, Stop-Loss, and Profit Targets
If breakout is confirmed, an entry is usually placed on the close of that specific breakout candle. With a stop-loss just below the trade line, inside of the curve. This is done so that a false breakout is exited with a small, defined loss.
A profit level is usually measured in pips, according to the depth of the curve. The deeper the curve (from lowest to highest point, up to the trend line), the bigger the potential breakout move can be. If an asset generally moves up in price, a risk-reward ratio for a rounding top is usually not as high as for rounding bottom, and so TP can be adjusted to be slightly wider.
Trading Rounding Patterns on Pocket Option Charts
Identifying a rounding bottom pattern starts with switching to a higher timeframe. Then, a horizontal line tool is used, to connect relevant highs or lows. It is afterwards adjusted to new highs or lows form during the later stages of the curve, to watch for a specific breakout.
Volume indicator is added, to confirm if stock chart patterns hold, and it's not a fake breakout. If a volume rises significantly, the confidence level for a trade is higher.
The pattern can be traded both in QT mode and in MT mode on Pocket Option. The stop-loss and profit-target approach described above applies specifically to MT mode (the CFD mode), where those order types are supported, since Quick Trading instead settles on a fixed expiry and payout rather than an adjustable stop-loss or take-profit. Given that the pattern also tends to suit longer timeframes better, MT mode is often preferred here, while shorter timeframes have other patterns that carry higher reliability.
one of the easiest platforms to learn!
Get StartedConclusion
Rounding bottom and rounding top patterns reward patience, not speed. Both take quite a while to complete, and the reversal is only meaningful once price closes beyond a trade line. Waiting for that confirmation, combined with a volume check, reduces the risk of entering a trade prematurely.
$50,000 in virtual funds to practice
Try DemoDisclaimer:Trading involves risks of capital loss. Previous patterns and entries do not guarantee future results. Use a stop loss and only trade with funds you can afford to lose.
Zobacz więcej:InterestingTrading Strategies