Value at Risk (VaR): How Traders Estimate Potential Portfolio Loss
One number can capture just how much of its capital a portfolio stands to lose in an exceptionally bad day. This number is Value at Risk (or VaR) and is widely used by banks, investment funds, and even individual investors as a measure for assessing their risk exposure.

What Value at Risk (VaR) Actually Measures
The question answered by Value at Risk is: How much can one lose from a position in terms of a specified level of confidence over a certain period of time? The relevance of this particular VaR definition lies in the fact that it makes an abstract concept of risk concrete and measurable in dollars or percentages.
The account of $10,000 with a one-day VaR of $330 at 95% confidence interval implies that on 19 out of 20 days, the loss is not expected to go beyond the mark of $330. It says nothing about the remaining day, when the loss can be worse than that by quite a wide margin.
The Three Components of VaR: Time Horizon, Confidence Level, Loss Threshold
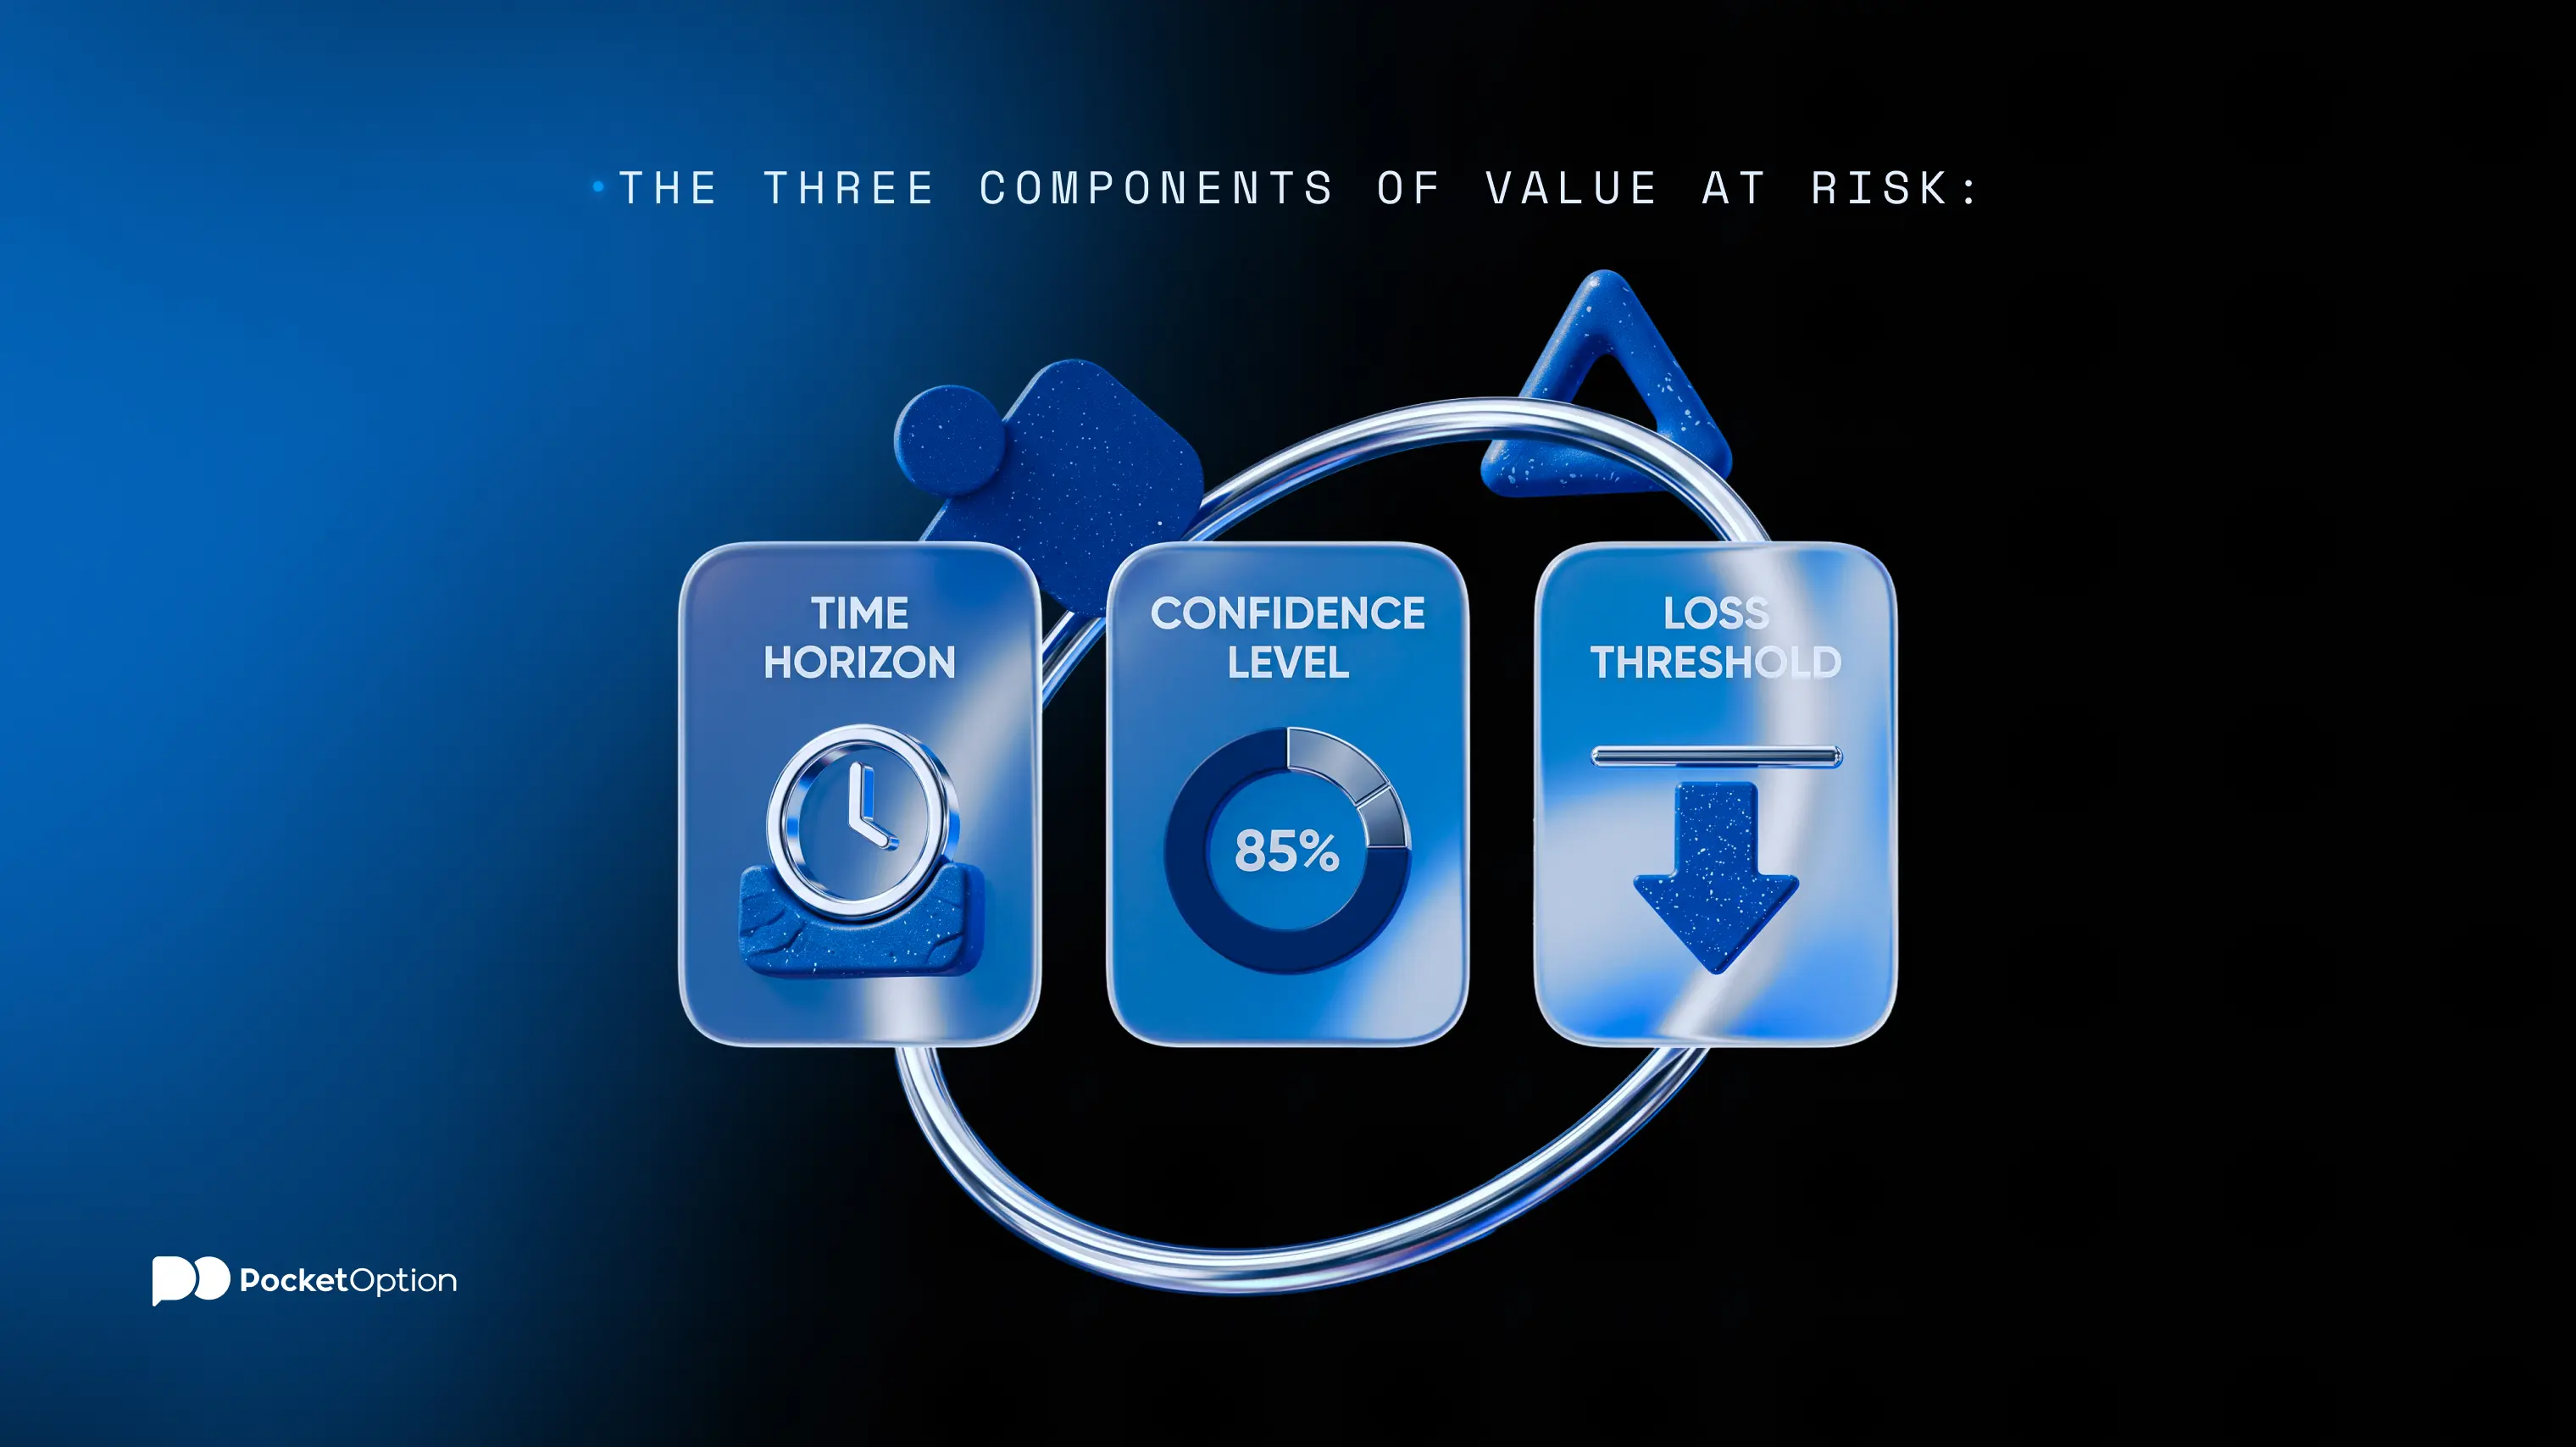
Each VaR figure depends on three parameters, and varying any of the three would lead to a variation in the resulting figure. First, there is the time horizon, which specifies the period for which the measurement applies; this usually ranges from one day for traders to ten days for institutions. Confidence level specifies the threshold of the statistical limit, and the most commonly applied levels are 95 percent and 99 percent. The Loss Threshold refers to the actual number derived from the process, which refers to the level of loss that should not be exceeded at a particular confidence level, although losses above this may still happen outside the confidence level.
Time horizon: the duration for calculating the possible loss, ranging from one trading day up to a few weeks.
Level of Confidence: The probability, usually set at 95% or 99%, that the loss will be smaller than the value of VaR. The level of confidence must be distinguished from the significance level, which equals 1 minus the level of confidence.
Loss threshold: the derived VaR amount in monetary terms or as a percentage of portfolio value – the amount that losses are not supposed to exceed at the selected confidence level, but not a ceiling on losses.
How VaR Is Typically Calculated
There are three popular techniques that can be applied in order to obtain the VaR number. The historical technique relies on looking at the historical returns and simply reading off the loss at a certain percentile, while making no assumption about the distribution of the returns. The parametric technique, which is also known as the variance-covariance technique, assumes that the returns are normally distributed and uses a value risk formula where the portfolio value is multiplied by the z-value corresponding to the selected confidence level, and by the standard deviation of returns. The Monte Carlo simulation technique involves simulating many price paths and measuring the span of outcomes. None of the techniques can predict the future, but they estimate an envelope based on the past performance of the portfolio.
unlimited funds for testing and backtesting
Try Demo AccountA Simplified Value at Risk Example
Imagine a value at risk example in which the amount invested is 10,000 dollars in a trading account with one security only. The standard deviation in daily returns for the security has been determined from its historical prices to be 2%, while 95% is considered as the confidence level.
Input | Value |
Account size | $10,000 |
Daily standard deviation of returns | 2% |
Confidence level | 95% (z = 1.65) |
One-day VaR | approx. $330 |
The value for the parametric approach equals the product of the size of the portfolio, z-score, and standard deviation and this resulting in the one-day VaR of around $330. In practical terms: on 95% of trading days, the amount lost from this position is not expected to exceed $330. The loss on the remaining 5% of days can be higher, but VaR does not specify by how much.
What Factors Increase or Decrease VaR
There are several factors that can move a VaR figure upward or downward. Higher levels of volatility in the asset being analyzed will increase VaR, since bigger swings in the price level will expand the range of possible outcomes. An increased time frame also results in a higher VaR.
Increasing the confidence level from 95% to 99% would also increase the number, as the computation would then have to take a larger range into account. Leverage has an equally straightforward impact on the number, in that any trade made using borrowed money would magnify both the profits and losses. This margin calculator shows how a given leverage ratio changes the capital actually at risk on a position, which is useful context before increasing size.
Do You Need to Be a Fund Manager to Use VaR?
The VaR concept originated in institutional trading floors. The fully modeled form that includes covariance matrices with dozens of portfolios is too complex for most personal accounts. But this should not make the concept unapproachable.
When any trader calculates a stop loss or a position size, he is essentially doing something similar to the VaR calculation because in both cases the price action is quantified to give an amount of money in dollar terms. It should be noted that stop loss or position size do not represent VaR calculations because VaR represents a quantile of losses. The reasoning behind this position sizing calculator guide, which starts from the dollar loss that is allowed and leads to the appropriate position sizing, there is something in common with VaR, although it is not a statistical loss quantile like in VaR models.
How Individual Traders Can Apply VaR-Style Thinking
Using the VaR approach does not involve any modeling software. This involves asking oneself, prior to making the trade, how much of the money in the trading account is one prepared to lose in case the position goes against expectations, and treating this number as a non-negotiable figure.
The trader can use this method to calculate a VaR that is tailored to his needs by calculating the historical volatility of the financial instrument, using the calculated volatility in proportion to the position size, and then comparing the obtained value to a certain percentage of the equity of the trading account, which usually varies between 1% and 2%.
unlimited funds for testing and backtesting
Try Demo AccountLimitations of VaR You Should Know
There are certain restrictions associated with VaR and any investor who uses it must be aware of these. First of all, VaR does not tell us anything about the magnitude of losses beyond the confidence level, which is referred to as tail risk and becomes especially important during periods of market turbulence.
Moreover, the calculation of VaR also relies to a great extent on the data and the assumptions that go into it. A parametric model which assumes that returns are normally distributed would underestimate market risk, because markets are susceptible to sudden and sharp moves that a normal distribution does not capture well. The Value at Risk is essentially a measure of the past applied to the future.
Using VaR Alongside Other Risk Tools
A VaR model is most effective when used as a component of a larger portfolio risk management strategy, but it can never be a substitute for this strategy. A stop loss intends to cap the losses incurred in a certain trade without taking into account the predictions made by the mathematical model; however, the execution price is not guaranteed and can be different from the stop price due to market volatility. Position sizing makes sure that no single trade is a substantial percentage of total account equity. Portfolio diversification across uncorrelated assets means that losses across several positions are less likely to be triggered by the same underlying factor at the same time. Several such risk management techniques are discussed in this overview. Pairing them with a VaR estimate gives a more complete picture than any single metric on its own.
Conclusion
Value at Risk transforms the general feeling of being exposed into a measurable number. It cannot predict what the next loss would be and can tell very little about the severity of the loss in case market action goes beyond the expected. In tandem with stop-losses, position sizing, and diversification, it offers traders an approach for setting positions and limits prior to any loss occurring.
use Pocket Option
Create AccountDisclaimer: There is considerable risk involved with trading, and it may not suit everyone. Value at Risk is an estimate that has been derived using some assumptions. It cannot provide any guarantee and it is possible for the actual loss to be greater than the estimated amount especially in times when the market is extremely volatile. Prior performance cannot predict future outcomes. Think about your risk profile before trading.
See more:Education