Elliott Wave Corrective Patterns: Zigzag, Flat and Triangle Explained
Every trend sooner or later comes to a halt, and this is exactly when traders can gauge how far the break may still have to run. This guide, which compares the three Elliott Wave corrective patterns that traders use most frequently to forecast market moves, namely zigzag, flat, and triangle, shows how they can be identified and why each one resolves in its own way.

Motive vs Corrective Waves: Quick Refresher
As stated by the Elliott Wave theory, there are two major classes of waves. Motive waves follow the prevailing trend and consist of five subwaves 1 through 5. In turn, corrective waves are going against the trend and interrupt it before the new motive wave starts.
While correction doesn't mean noise only, the internal structure of the process itself, i.e., the amount of subwaves and their lengths, is usually represented by three main types: zigzag, flat, or triangle. All of them are described below.
The Three Major Corrective Structures
Let us take a look at an overview table showing the main features of the three patterns described above before we proceed to describing the features.
Pattern | Wave Count | Sub-wave Structure | Typical Wave B Depth |
Zigzag | 3 | 5-3-5 | 38.2% to 61.8% of wave A |
Flat | 3 | 3-3-5 | 90% to over 100% of wave A |
Triangle | 5 | 3-3-3-3-3 | Not applicable |
The following sections explain how each shape is unique in its nature, the average Fibonacci lengths, and the chart indicators used for determining the structure during live wave analysis.
Zigzag Correction (5-3-5)
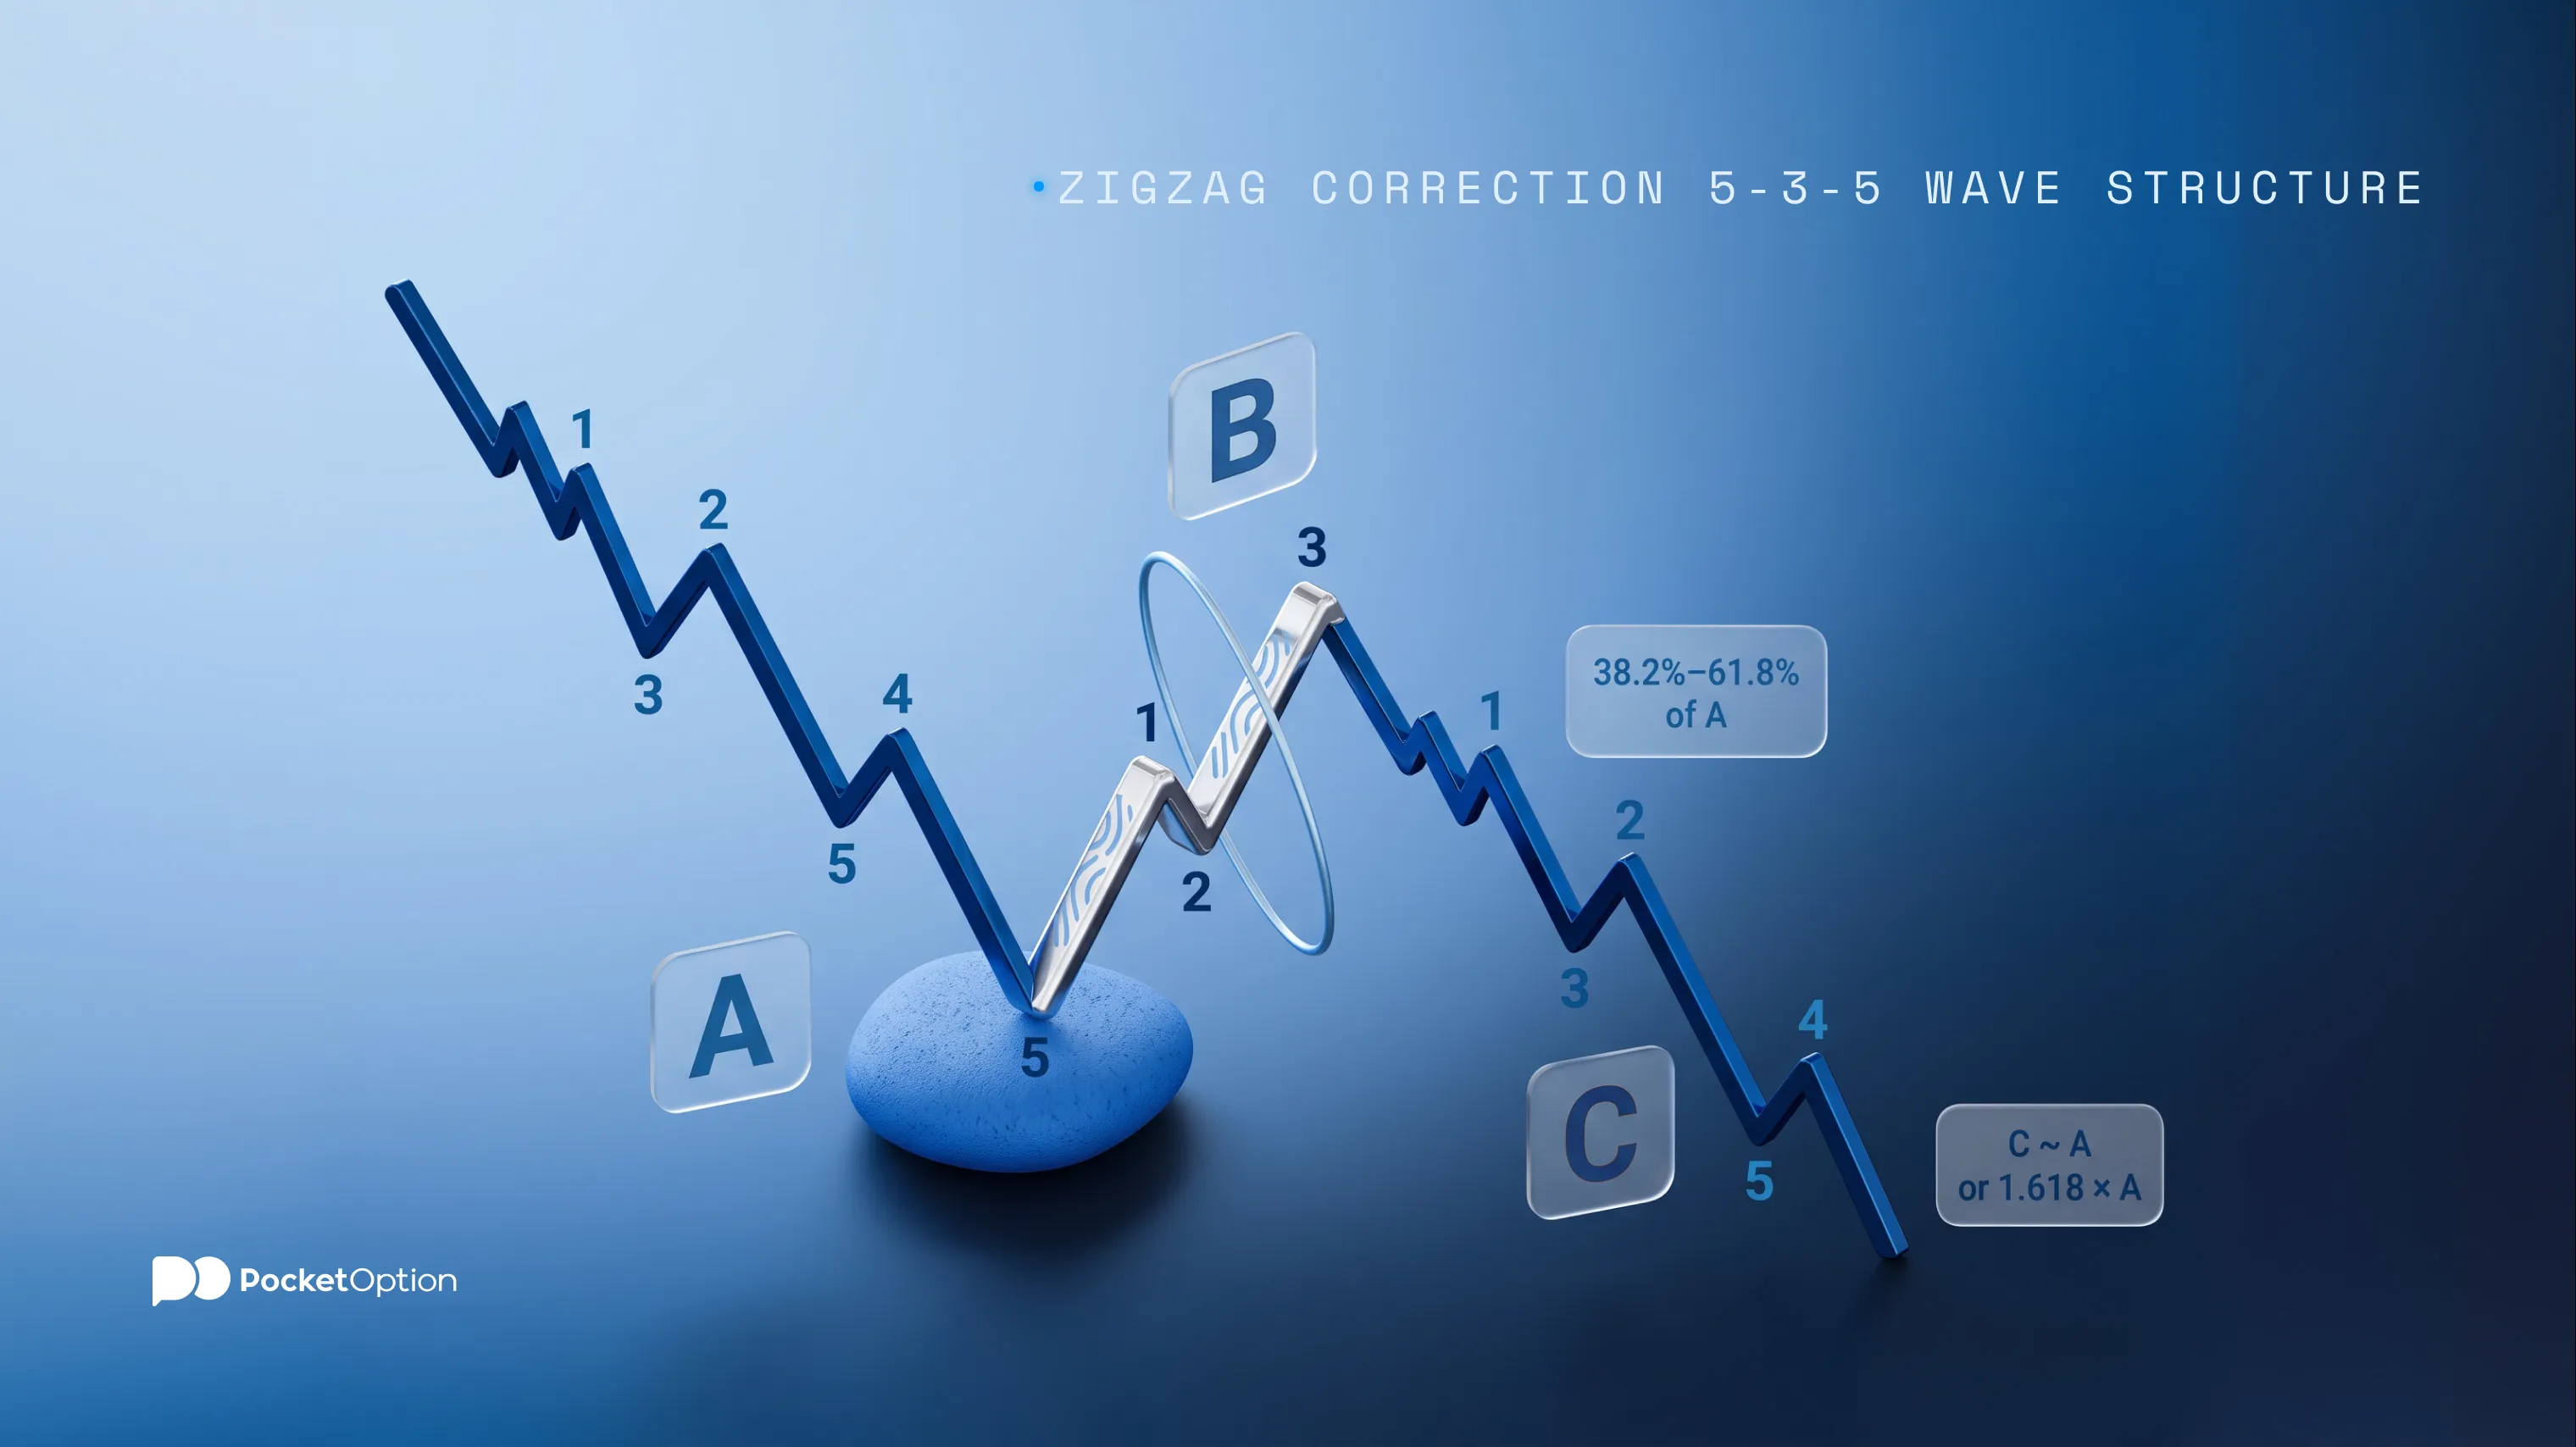
The zigzag correction is the sharpest and most common of all the three shapes discussed here. The zigzag correction consists of three waves, namely waves A, B, and C, where A and C consist of five waves while wave B consists of three waves, which forms the 5-3-5 shape popularly known as the ABC correction and it is the easiest shape because the wave B is shorter and the structure moves against the trend direction.
Generally, Wave A begins the correction with the counter-trend move. Wave B retraces Wave A, which normally ranges from 38.2% to 61.8%. Wave C finally finishes the structure at the same length with Wave A or 1.618 times the length of Wave A.
Flat Correction (3-3-5)
The pattern has three waves: A, B and C. The difference of the pattern from the zigzag one lies in its composition of subwaves: waves A and B consist of 3 subwaves each while wave C consists of five subwaves. Because of the approximate equality of the lengths of the waves B and A, most of the flat corrections take horizontal rather than slanted form. Wave B always begins where wave A ends, and what separates the three types of flat is where wave B finishes relative to the start of wave A, and how far wave C travels afterwards.
Regular flat correction: wave B ends at or near the starting point of wave A, retracing roughly 90% or more of it, and wave C then finishes slightly beyond the end of wave A.
Expanded flat correction: wave B ends beyond the start of wave A, commonly around 123.6% to 138.2% of it, and wave C travels further still, typically reaching a 1.272 to 1.618 extension of wave A.
It is a series of ratios that are based on the Fibonacci theory. The running flat correction is the rarest one and means that wave B also ends beyond the start of wave A, but wave C falls short and finishes before reaching the end of wave A.
Direction depends on which trend is being corrected. In a flat interrupting an uptrend, wave A moves down, wave B moves up, and wave C moves down past the end of wave A. In a flat interrupting a downtrend, every leg reverses. Wave C finishes beyond the termination of wave A in the direction of the correction, so describing it as moving above wave A holds in only one of the two cases.
Triangle Correction (3-3-3-3-3)
This is the only correction that has five legs. The name convention used for labeling the waves is A, B, C, D, and E. All five waves have three sub-waves each, making the 3-3-3-3-3 structure. As all five legs are simple 3 wave structures, triangle corrections often look like a set of nested zigzags, narrowing in width.
Elliott Wave theory recognises four triangle types, classified by how the two boundary lines behave.
Contracting triangle is the most common type, where both boundaries slope towards each other.
Barrier triangle has waves B and D ending at roughly the same level, so one boundary runs close to horizontal while the other converges towards it.
Running triangle occurs when wave B ends beyond the start of wave A, pushing the structure in the direction of the preceding trend.
Expanding triangle is the rarest type. It is also known as reverse triangle because it has widening boundaries.
Ascending triangles and descending triangles fall into the realm of conventional chart patterns and not Elliott Wave. In this context, they do not have any positive or negative connotation at all. The Elliott triangle is a correctional formation, meaning its final direction is based on the prevailing trend being disrupted by the triangle. Although one of the boundaries may look flat, if the trend is down, the triangle will resolve itself downward.
Triangles are continuation patterns together with flags, and the contraction feature is typical for both of them. One can easily recognize them by using a volume indicator. In contracting and barrier triangles, the volume decreases step-by-step from wave A to wave D, and increases after wave E as the price breaks the boundaries. It is the opposite for the expanding triangle, because the volume increases along with widening boundaries.
How Do You Distinguish Between the Three Patterns on the Chart
One way of classifying the three types of patterns on the charts is through the wave count method. This is used together with the shape and the volume for more context.
Wave count: three waves are indicative of a zigzag or a flat, five waves imply triangle formation.
Shape and symmetry: zigzag makes an aggressive move against the trend, flat moves mostly sideways, and a triangle is narrowing or widening between two converging or diverging lines.
Depth of wave B: shallow in case of zigzag, close to or even over 100% in flat correction, and no relevance in triangle.
Volume pattern: typically increases into wave C in zigzag, remains constant during flat and contracts consistently in a normal triangle.
Estimating Where a Correction Is Likely to End
Fibonacci lengths ratios can give an approximate forecast of the probable endpoint of each of these patterns. For example:
In the case of a zigzag, wave C ends up near 100% or 161.8% of wave A.
In flat correction, wave C ends up near 100%, 123.6%, or 138.2% of wave A depending on if it is a regular or an expanded flat.
In the case of a triangle, wave E is usually the shortest one and tends to remain within the price range of waves A-D rather than extending outside of them.
This kind of retracement and extensions helps estimate where wave C or wave E will end, which implies the end of the corrective structure. A completed structure is confirmed by breaking through the trendline which contains the correction, and it is the moment that signals traders to consider the correction to be over and trend resumption trade to be available. This projection forms the core of Elliott Wave forecast but always has to be combined with the stop loss as a single wave count may be proven incorrect.
Common Pitfalls When Identifying Corrective Waves
Imposing a wave count on the structure based on one’s own bias rather than following what the structure says.
Confusing a running flat with a zigzag, which leads to a trend-resumption trade too soon.
Overlooking the alternation rule which states that if one correction within a sequence is simple, the next one would probably be a complex one.
Not waiting for the confirmation at all, which means trading trend-resumption without confirming price breakthrough.
All of the above mistakes can be detected and avoided in careful wave analysis.
Always Look for Confirmation
Open a Free AccountApplying This on Pocket Option Charts
In order to trade this concept on a live chart, one needs to choose an adequate timeframe depending on their trading style. The same correction looks quite differently when viewed on a five minute time frame and on a daily one.
One needs to make marks at swing highs and lows, then build a tentative wave count and fit it into either 5-3-5, 3-3-5, or 3-3-3-3-3 pattern that fits best. Allowing for the structure to be completed and a trendline breakout to confirm it helps to get entries near the beginning of the next impulsive movement instead of being mid-correction.
Conclusion
Zigzag, Flat, and Triangle corrections represent the lion's share of all practical patterns. Wave count is the primary and most certain filter: three waves mean either Zigzag or a Flat, in case of five, it’s a Triangle. After that, depth of wave B and volume around it allows distinguishing a Zigzag from a Flat, while the geometry of two boundaries helps to see if a Triangle is normal or a rare expanding one.
Of course, nothing can substitute for a stop loss and any other risk management, but knowing what type of Elliott Wave corrective patterns one is dealing with simplifies estimating its completion degree.
Disclaimer: This article should not be taken as individual investment advice and traders need to evaluate their personal financial condition and consult an independent expert if necessary.
Ver más:InterestingTrading Strategies