
Aroon Indicator: How to Spot New Trends Before They Fully Form
The Aroon indicator counts time elapsed since the formation of the last market high or low. Thus, it can signal a new trend before it fully forms. Typically, it appears in the form of a simple crossover.

What Makes the Aroon Indicator Different: Time, Not Price
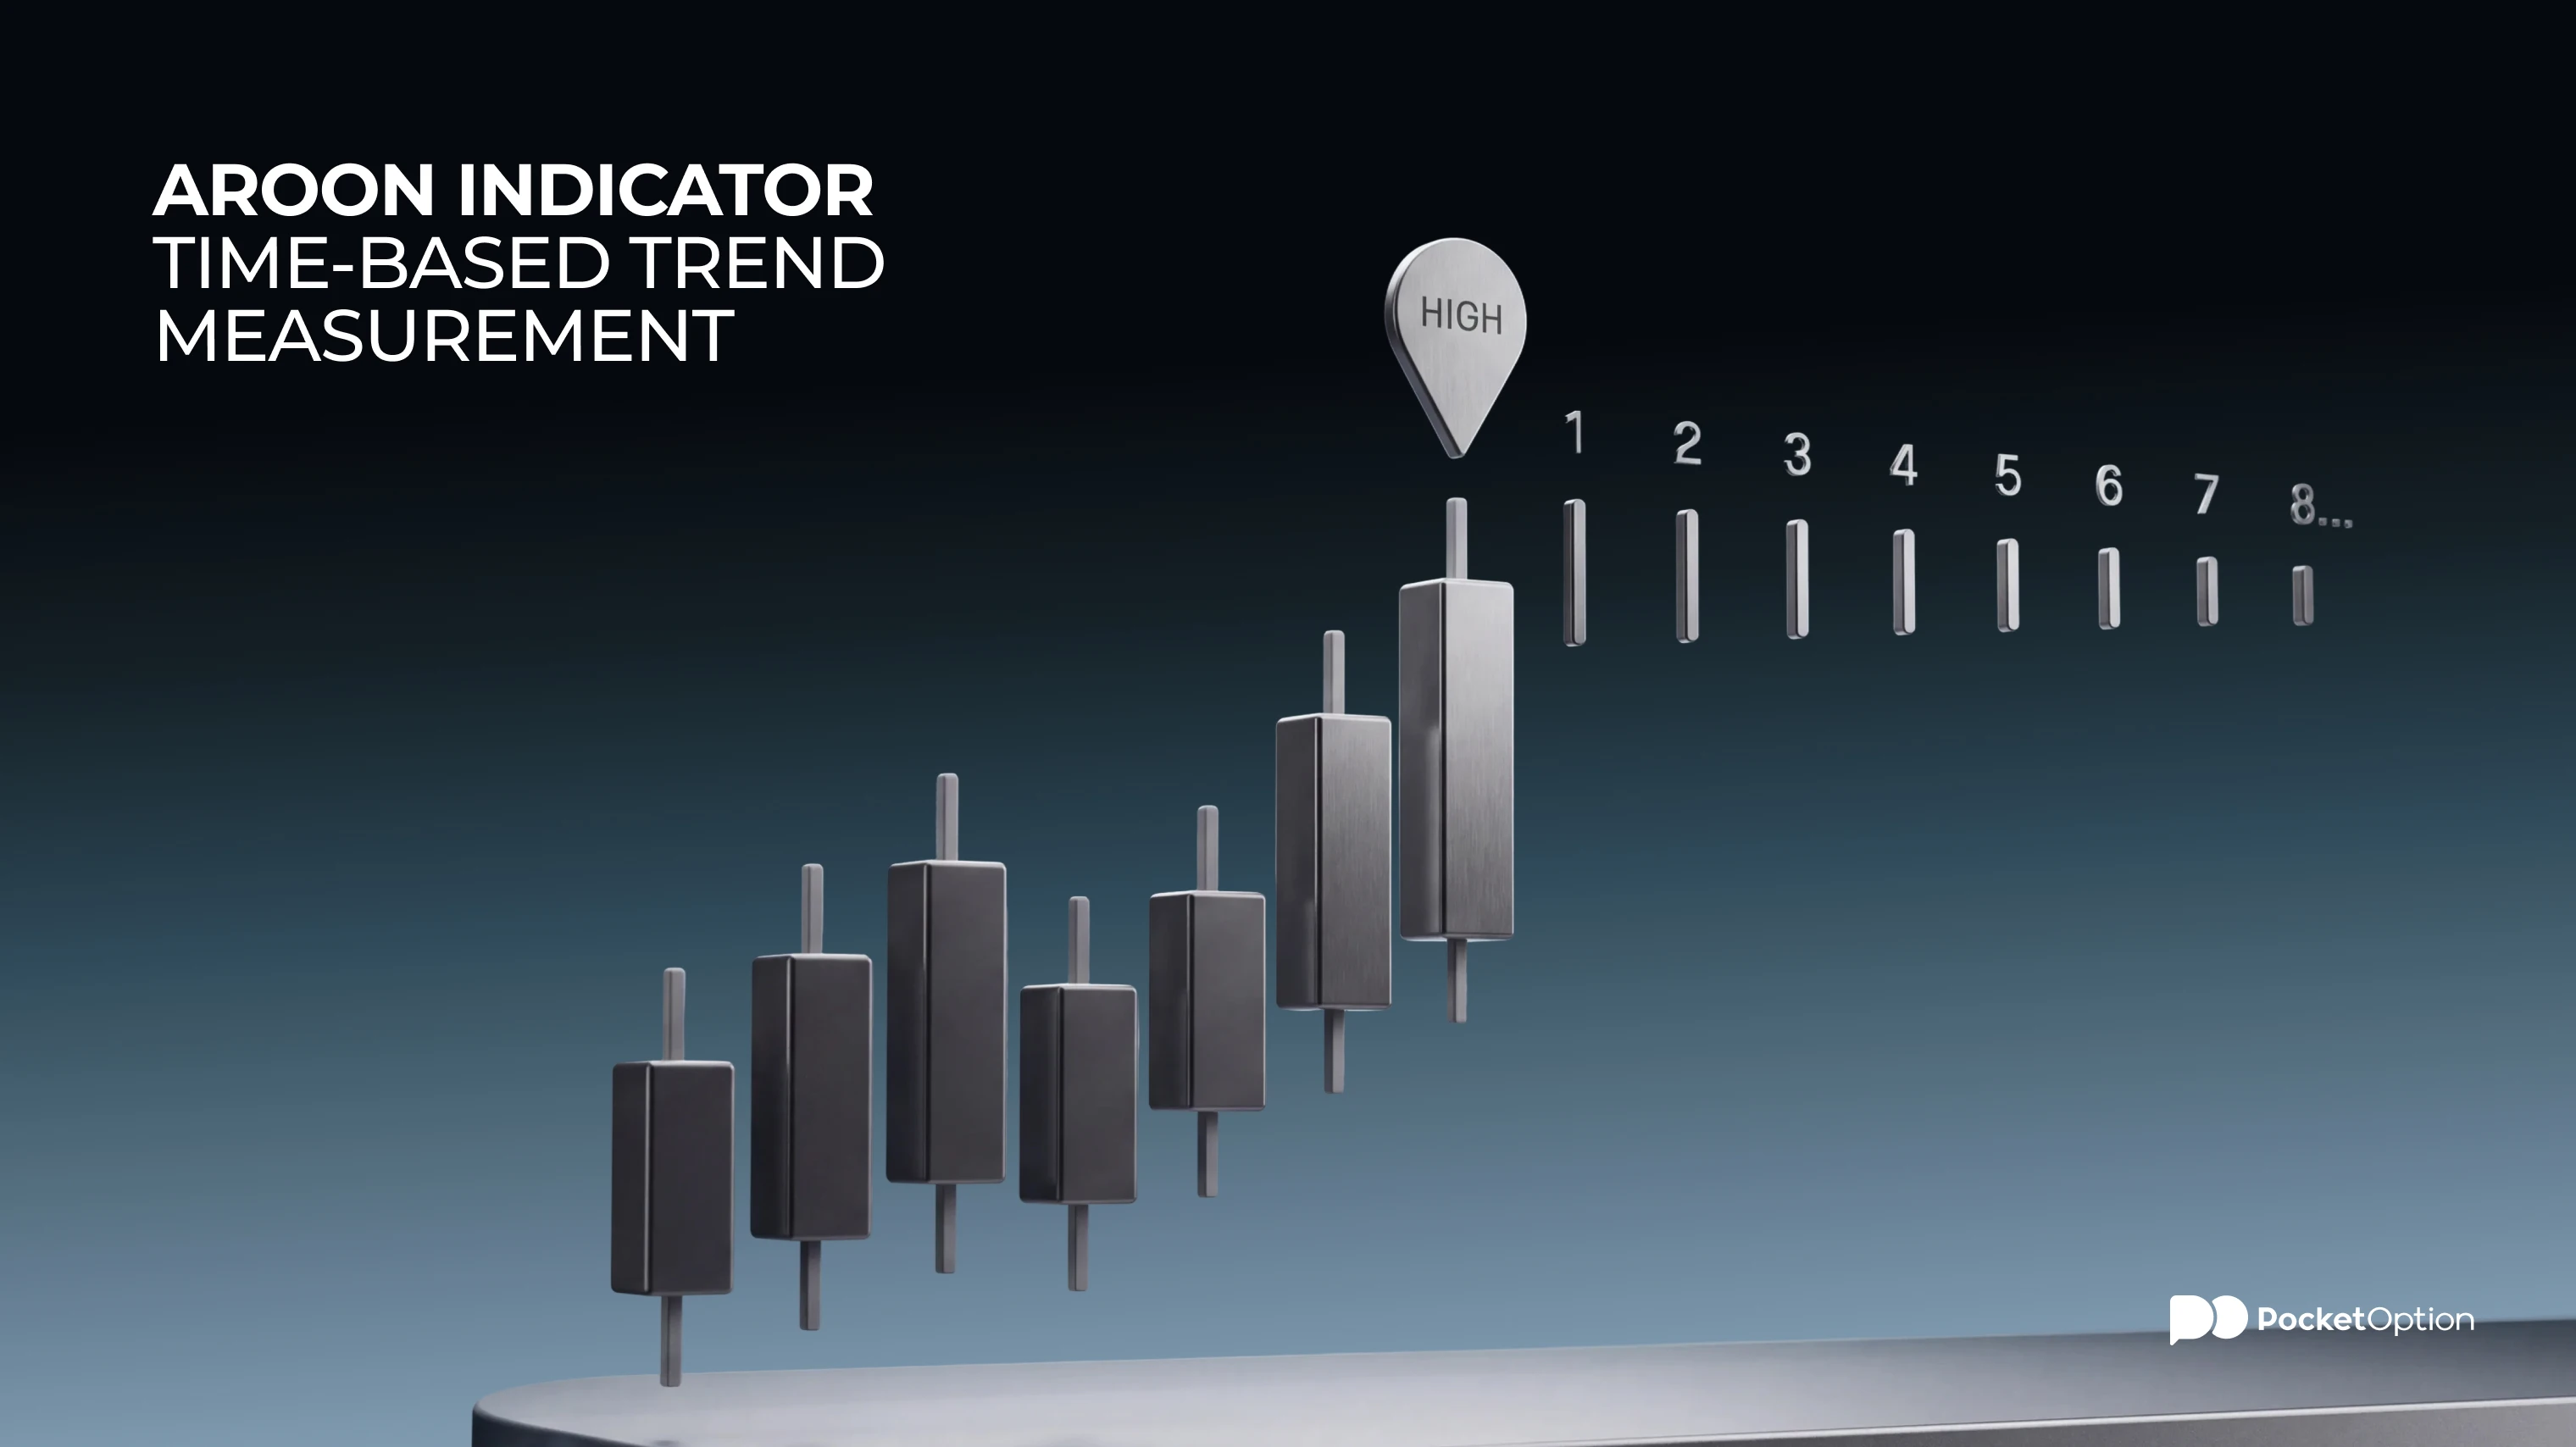
Most trend indicators, including moving averages and the gaps between them, are built on price. Unlike them, the Aroon indicator measures only time, or to be precise: periods. It counts how many periods have passed since the most recent high and, separately, how many have passed since the most recent low, both measured within a lookback window set in the indicator's settings.
This way it can register a change in market character before it becomes obvious on the price chart. A steady run of new highs points to continued buying activity regardless of how large each individual move is.
Just run both of them on the same graph and see the difference yourself. The 20 period moving average will be updated every time there’s a closing candle because every new price will be counted in the calculation of the moving average. As for the Aroon Up line, it will change its value only at the moment when a new high appears in the lookback period. Between such highs, the indicator takes one step down, which means that at every bar the indicator changes its value. If you set up your settings to 25 periods, then every new bar without a new high will make it lose 4 points.
The Aroon Formula: Aroon Up and Aroon Down
The Aroon indicator includes two independent lines: Aroon Up and Aroon Down, that vary between zero and 100 for a set lookback period (e.g. 14 or 25 bars).
Aroon Up = 100 x (lookback period - number of bars since the highest high) / lookback period.
Aroon Down =100 x (lookback period - number of bars since the lowest low) / lookback period.
High lines indicate that the latest extreme high or low is not too old. Low lines indicate that the latest extreme high or low is already quite old. These formulas provide the foundation for the Aroon indicator calculation, explaining the reason behind the lines' inability to replicate the movements of the price itself.
Additionally, there is the one-line version of the indicator called the Aroon oscillator that represents the difference between Aroon Up and Aroon Down. This option suits some traders better because of its simplicity, however, in this article we will consider the two-line version, as we want to understand both aspects of the market.
For example, let's take 25 periods and suppose that the highest high is 5 periods old. In this case, Aroon Up = 100 × (25 - 5) / 25 = 80. And if the lowest low is 20 periods old, Aroon Down = 100 × (25 - 20) / 25 = 20. Here, the buyers set the pace.
And if after another 5 periods there are no extremes, Aroon Up = 60 and Aroon Down = 0. Notice that the change in one line was not caused by price moves, the time passed and caused the change. Notice that there was no price movement behind the shift in one of the lines; it was the elapse of time, not the prices' movements.
How to Interpret Aroon Levels
The strong uptrend signal appears when the level of Aroon Up is above 70 and the level of Aroon Down is below 30. Conversely, the opposite combination of levels indicates a strong downtrend. When Aroon lines intersect each other, a crossover happens. This is often a signal for market conditions to change.
Finally, if both Aroon Up and Aroon Down levels are below 50 and are closer to each other, the market could be range-bound because the market lacks impulse to reach new highs or lows.
Keep an eye on the extreme values. Values of 100 mean that there is a high or a low of the value displayed on the latest bar. Values of 0 mean that there was nothing new over the entire lookback period. If Aroon Up has been showing 100 for several bars then it means that the buyers have been setting a new high each period. Consider 70 and 30 to be guidelines rather than strict values. Some people like to use 80 and 20 to cut down on false signals.
Aroon vs ADX: Direction vs Strength
Another popular technical tool to measure the strength of the trend is the Average Directional Index (ADX). Often it is compared to the Aroon Indicator because both measure trend strength. But ADX calculates only one parameter of the trend strength. As one parameter cannot signal a trend direction, it requires a complementary indicator to identify a direction.
Feature | Aroon | ADX |
|---|---|---|
What it measures | Direction and timing of the last high and low | Strength of the current trend |
Output | Two lines: Aroon Up and Aroon Down | One line, scaled 0 to 100 |
Best used for | Spotting a new trend early | Confirming a trend is strong enough to trade |
The advantage of the Aroon Indicator is that both Aroon Up and Aroon Down show market's recent activity, thus allowing to understand in which way the market reached the latest high or low. Combining ADX and Aroon allows getting both strength and direction of the trend.
Best Markets and Timeframes for Aroon
The Aroon Indicator works better with markets capable to sustain clear trends such as forex pairs during active hours.
In general all the strong trending assets can be suitable for it. However, it’s different with the timeframes. At short timeframes, price fluctuates around a certain level, generating a lot of crossovers and confusing trend identification. At medium timeframes (between 15 minutes and 4 hours), the balance can be achieved. The longer the timeframe, the better the trend signal is.
Session timing is as important as timeframe. When applying Aroon to EUR/USD in the Asian session, the currency pair remains in a tight range most of the time, and as a result, neither the green nor red line exceeds the level of 50. The situation changes completely when you apply the indicator at the start of the London session, as the range increases, and new highs appear one after another. Find out at which moment your asset starts moving. For indices, it's the cash opening. For currency pairs, it's the London/New York overlap.
Combining Aroon with MACD or RSI for Confirmation
A simple crossover is not a complete signal yet. When Aroon indicator is paired with additional indicators, it reduces the false signals and improves your performance. MACD and RSI, which give more information about the momentum, are excellent indicators to be combined with Aroon.
For instance, you can tune MACD settings to your timeframe and confirm the trend formation with it when a fresh Aroon crossover is happening.
You can also use RSI that serves the same purpose: directional crossover combined with RSI confirmation generates a more powerful signal.
Also, order does make a difference. Treat the Aroon crossover as the trigger and the momentum reading as the filter, not the other way round. Waiting for RSI to cross 50 before you look for an Aroon signal gives up the early entry that made Aroon worth using in the first place.
It is advised to exit the position if there is no confirmation by the third bar after the cross-over. A signal requiring six bars of waiting is obviously not an early signal.
Step-by-Step Entry Setup Using Aroon
The working strategy uses the Aroon Indicator combined with a momentum check, based on the RSI indicator with corresponding settings for day trading:
Apply the Aroon indicator with 14 or 25 bars lookback depending on the timeframe;
Wait for Aroon Up line to cross Aroon Down line (bullish setup), or vice versa (bearish setup);
Confirm with RSI or MACD crossover in the same direction;
Go long/short the asset according to the new trend direction on the candle of the crossover closure;
Mark the most recent swing high/low point as it will be useful later to place a stop-loss.
There are two conditions under which this approach will work. One is to wait until the candle closes to make a decision, as the Aroon lines change when the candle is being formed and what appears to be a crossover in the middle of the candle may not be there when the candle closes. The other one is that you should record your swing level in step five prior to entering a trade.
Setting Stop-Loss and Exit Rules
The most popular method for setting the stop-loss order when trading with levels is to put it just beyond the level. Same is here. Place a stop-loss just out of the swing point defined in your entrance to leave some room for the trend to develop but also to understand the risk you take.
Regarding the exit, the most reasonable exit strategy when trading with Aroon indicator is to close the position when the opposite crossover happens. For instance, an opposite crossover can be an exit signal before achieving the fixed profit target (Aroon Down crossing Aroon Up in case of long position).
Limitations: When Aroon Gives False Signals
Like all the other trend indicators, the Aroon Indicator is not reliable in ranging markets. It works well when the price trends, but once it starts fluctuating in a range, it creates frequent and mostly false crossovers.
This limitation is not reserved only to Aroon indicator, but to all other trend following tools. Identifying ranging market conditions through following price action or through additional indicators like ADX or RSI will prevent most of those false signals.
There is another failure point which does not receive much attention. When price grinds steadily higher without printing a fresh peak, Aroon Up decays even though the uptrend is intact. The line drifts toward 50, which looks like a trend losing steam, while price carries on climbing. Aroon reports how recently an extreme was set, not how strong the current move is. Read the price chart alongside the indicator before closing a position on the strength of a falling line.
Reading Aroon on Pocket Option Charts
This section describes how to use Aroon indicator on live chart. The implementation is easy. All you have to do is select the indicator from the list of chart indicators in the Trend group. Once implemented, the lines will be displayed in a panel underneath the price chart.
It would be wise to spend some time watching Aroon lines before making any decisions. Just load one asset, choose a period of 25, and run for some time without trading. Count how many crossovers happened and how many of them result in price move, against how many were false signals. Check your win rate. In case you are not satisfied with it, extend the 70 and 30 thresholds for this asset. Then try again with 14.
Free access, forever
Open Live ChartConclusion
The Aroon indicator is a technical tool that shows how recently the market last set a high and a low, measured in periods rather than in price. From that recency reading you can judge whether a trend is establishing itself, stalling or absent altogether. Applied alongside a momentum indicator and with an awareness of the wider market conditions, it works considerably better than it does as a standalone system.
test it with $50,000 of virtual funds
Try Demo AccountDisclaimer: CFDs, cryptocurrencies, and other leveraged financial instruments carry significant risk leading to the losses of invested money. This material is for general educational purposes only and is not trading advice. Independent research and risk management are recommended before any trading decision.
See more:InterestingTrading Strategies