SuperTrend Indicator: How to Trade Trend Reversals with One Simple Signal
The SuperTrend indicator plots a single line above or below price and flips color when the trend reverses. Because the signal is read directly from that color change, it removes much of the guesswork involved in interpreting other trend tools.

What Is the SuperTrend Indicator
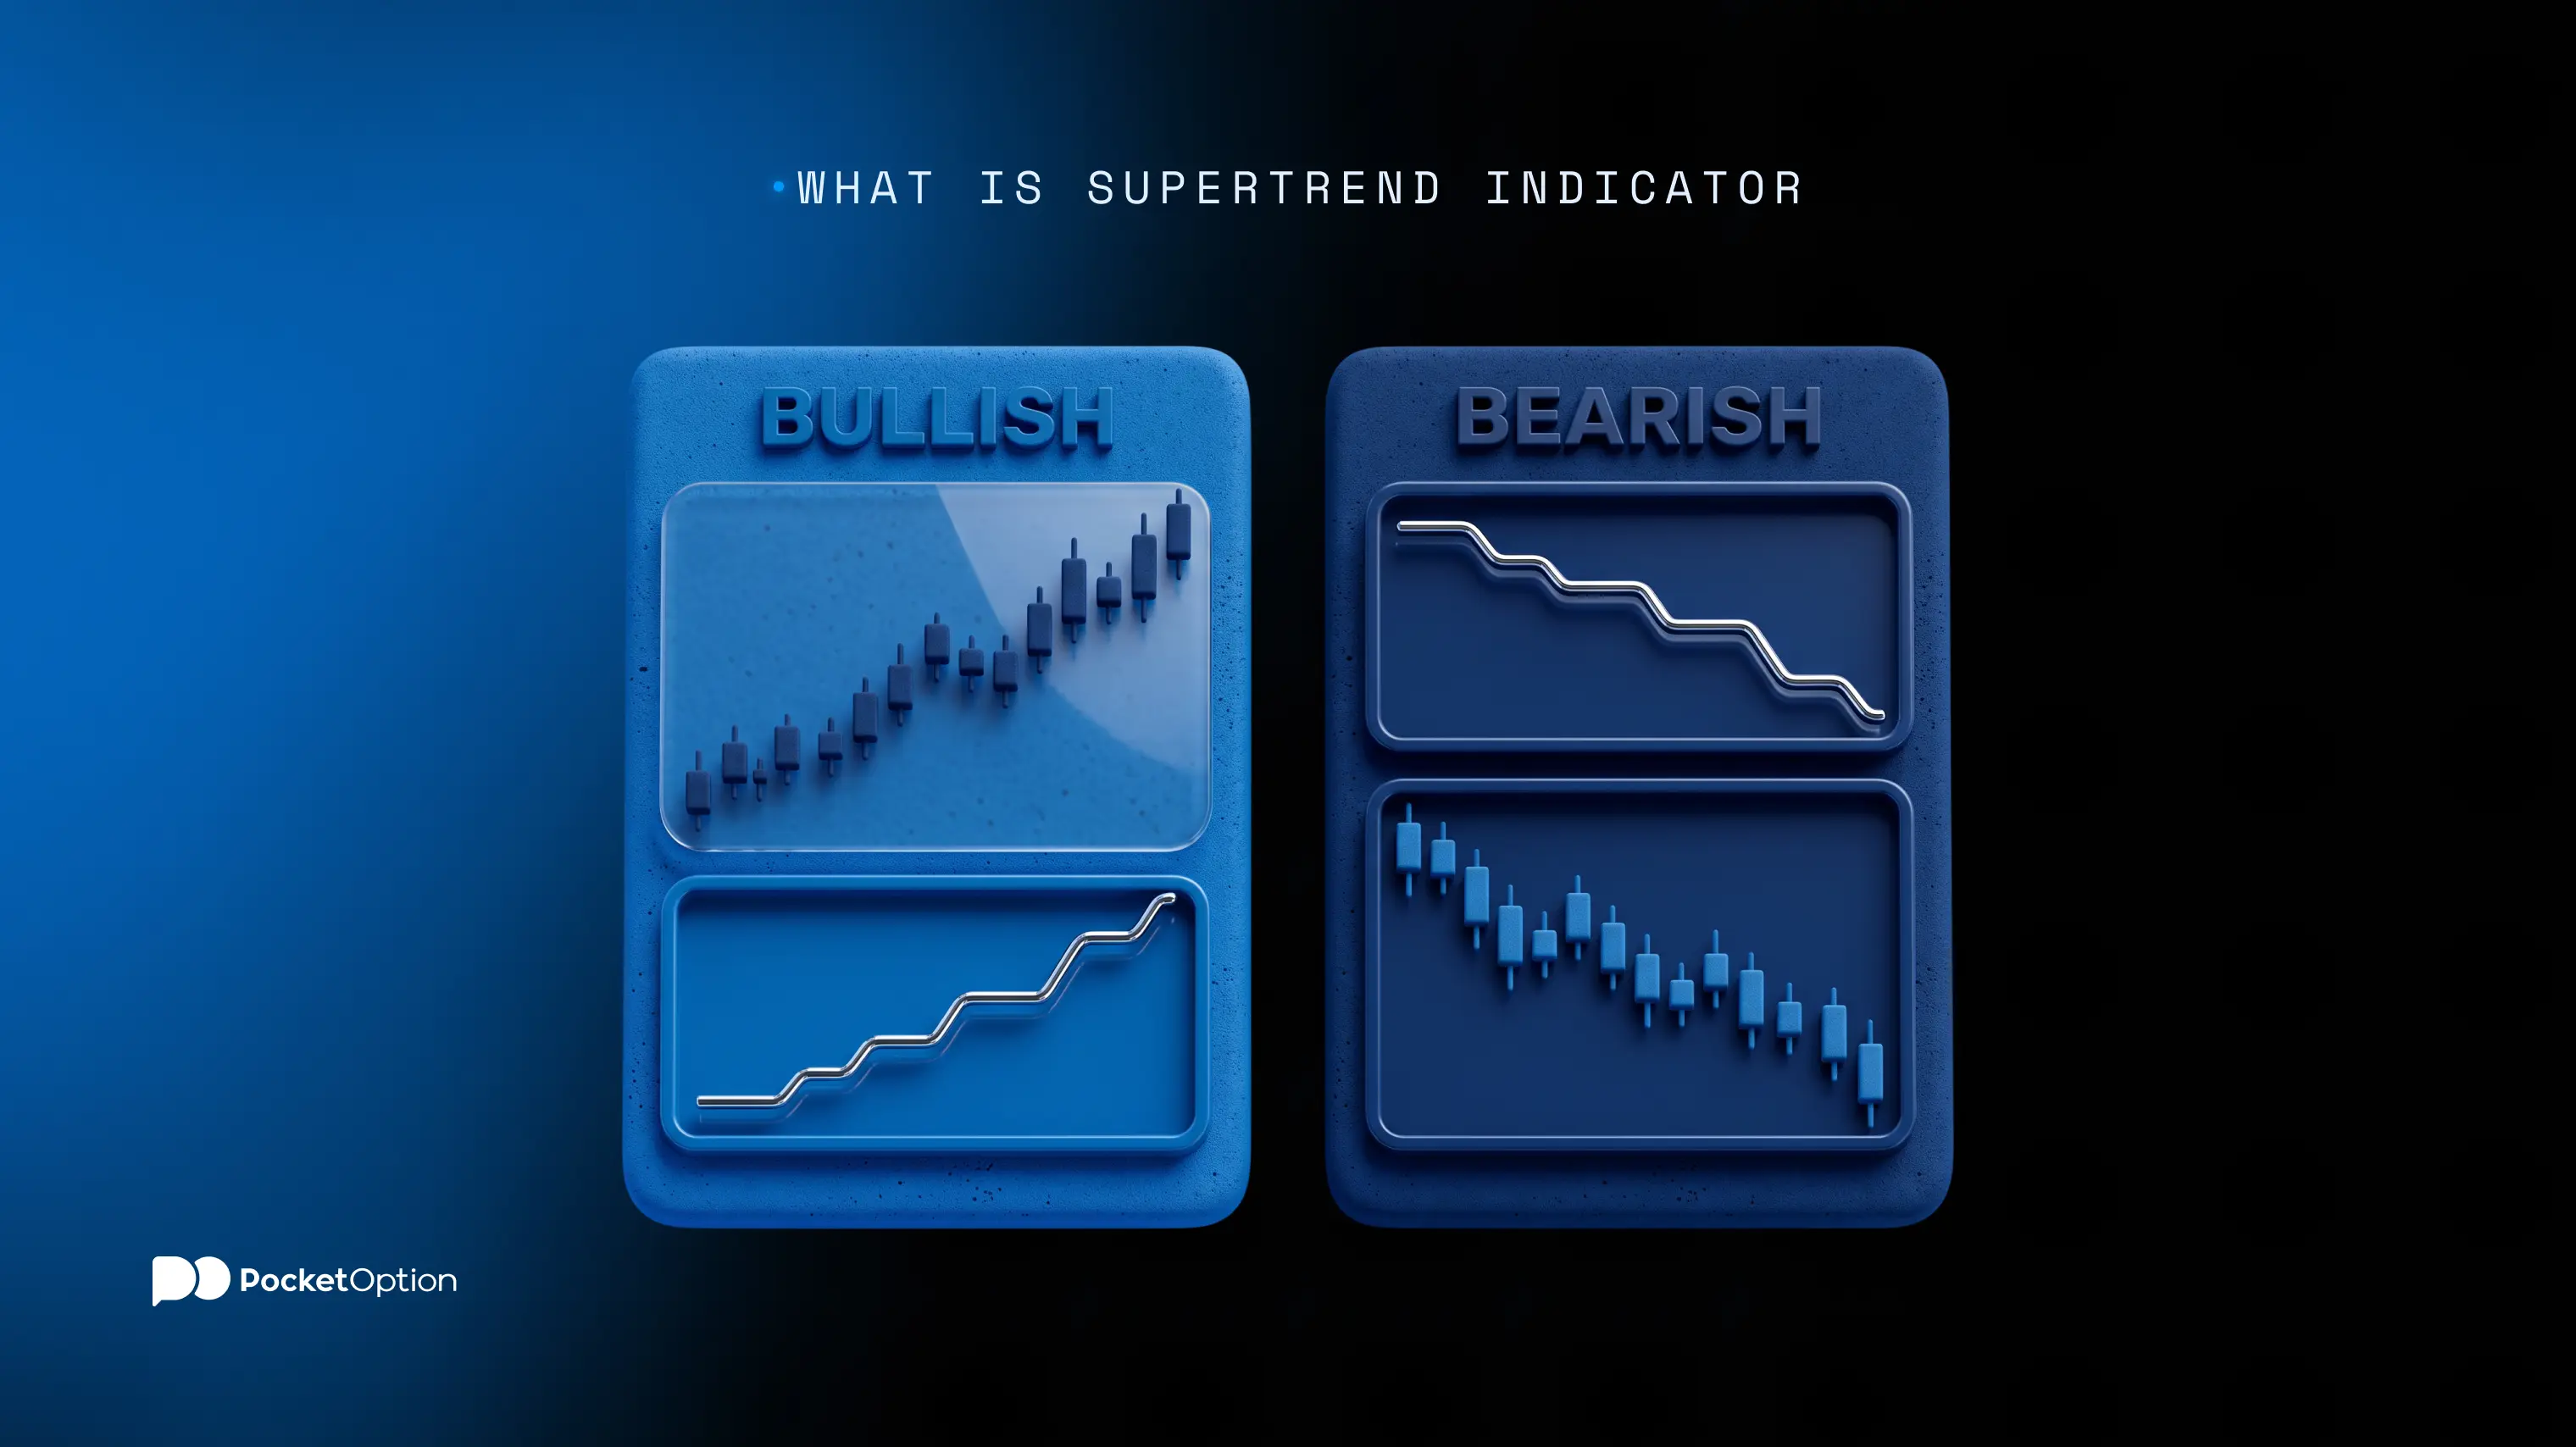
This segment will present you with the most basic description of what is SuperTrend indicator. Simply put, it’s a trend-following overlay indicator that draws one line either above or below the price candles. If the line is placed below the price, the trend is seen as bullish, and vice versa. The signal about the reversal of the trend becomes evident at the very moment when the line changes its position and color.
It is one of the pre-installed technical indicators of Pocket Option, along with such popular indicators as moving average, parabolic sar, and Ichimoku Kinko Hyo.
The SuperTrend Formula: Built on ATR
The SuperTrend indicator is made on the Average True Range, which measures how volatile the market conditions are for a particular asset. The SuperTrend indicator formula starts from the midpoint of each candle, calculated as the high plus the low divided by two, and places two basic bands around that midpoint. The upper basic band equals the midpoint plus ATR multiplied by the chosen factor. The lower basic band equals the midpoint minus ATR multiplied by the same factor. Because ATR sits inside the calculation, the bands widen when volatility rises and narrow when it falls.
Those basic bands are not the line you see on the chart. Each one is converted into a final band that also takes the previous bar into account. The final upper band keeps its previous value unless the new basic upper band is lower than it, or the previous close finished above it. The final lower band keeps its previous value unless the new basic lower band is higher than it, or the previous close finished below it. The effect is a ratchet: during a downtrend the upper band can tighten toward price but never loosen away from it, and during an uptrend the lower band behaves the same way in reverse.
The plotted line then follows one final band at a time. While the trend reads as bearish, the line sits on the final upper band and stays there for as long as the close remains below it. The moment a candle closes above that band, the line switches to the final lower band and the trend reading turns bullish. While the trend reads as bullish, the line sits on the final lower band until a close drops below it, at which point it switches back to the final upper band. This is why a closing price beyond the line produces the flip, rather than any touch during the bar.
Why the Signal Is a Color Change, Not an Interpretation
Most trend-based indicators require subjective judgment. A moving average crossover will depend on which moving averages you've decided to use, and the drawing of a trendline by hand allows for too many personal choices. With the SuperTrend indicator, most of the uncertainty is solved with just one line either located above the price or below it.
A shift of the line from the lower position to the upper position marks the beginning of a bearish trend. There is no middle position to be interpreted, nor is there a requirement to assess the angle and force of the movement. The binary nature of this color based signal is one of the reasons why traders prefer using it over an indicator that requires interpretation of the trend.
What ATR Period and Multiplier Control
There are two parameters that influence the behavior of the SuperTrend indicator. An ATR period determines how many bars are used for the calculation of volatility. The more candles included, the smoother the result will be, but also more lagging. The shorter the period, the faster the reaction to the recent changes will be.
Multiplier defines the distance of the band to the price. With a small multiplier, the line will stay close to the price, resulting in more frequent flips and thus more signals, which are likely to be false in a volatile environment. The higher multiplier leads to less frequent flips and allows price more breathing space before a reversal is confirmed. There is no universal right settings; both of them are dependent on your trading period and preferences regarding noise tolerance.
Recommended Settings by Timeframe
It is worth noting that the SuperTrend indicator best settings depend much on the time period and assets you trade, and those shown below can serve as default values only, not as strict recommendations. You need to test each setting using demo account first.
Trading Style | ATR Period | Multiplier |
Scalping (1 to 5 minute charts) | 7 to 10 | 1.5 to 2.0 |
Intraday (15 minute to 1 hour charts) | 10 to 14 | 2.0 to 3.0 |
Swing (4 hour to daily charts) | 14 to 21 | 3.0 to 4.0 |
Adding SuperTrend to Your Chart on Pocket Option
The indicator may be added via the chart's indicator menu where it is located in the trend-following category with other such indicators as moving average and Parabolic SAR. You will have access to all SuperTrend indicator settings in the panel, which will allow you to modify its parameters and see the changes on the chart right away.
In order to choose the optimal settings, it is recommended to try out the indicator on a demo account for several days with the asset's history data. This will help to make sure that the settings are appropriate for the market volatility and to avoid making real trades with inappropriate settings.
along with over 50 other indicators
Get StartedA Simple Trend-Following Entry Strategy
One simple SuperTrend strategy involves waiting for the line to flip and then checking whether the trend continues. The flipping line from above the price to below the price indicates a bullish trend and the possibility to enter long positions. The next candle should close above the line to confirm the signal and not to act on fake signals.
The opposite logic applies to a bearish signal. There the line has to flip from below the price to above it, which marks the change from an uptrend to a downtrend and opens the possibility of short positions. Waiting for one additional candle to close below the line after the switch helps filter out a false signal that would reverse within one or two bars, which happens more often in a noisy market.
Using the SuperTrend Level as a Trailing Stop-Loss
Since the indicator's line is at the fixed distance from the price according to the current volatility of the market, it may be used as a trailing stop loss level for the position rather than only as an entry indicator. In the case of the uptrend, the lower band of the indicator will automatically become a trailing stop, increasing its level along with the increase in price. This gives an easy way to define a trailing stop for a trending position without the need to manually adjust it after every new high.
When SuperTrend Doesn't Work: Ranging Markets
The SuperTrend is a trend-follower by design, and it will perform poorly when there are no trends to ride on the chart. With the price fluctuating between two levels in a range, the SuperTrend indicator will flash its color change very rapidly, with many flips being false signals without actual reversal.
This problem is inherent to any indicator based on following a trend, which is why it is recommended to verify that the market indeed has an underlying trend by means of some independent range recognition system, such as support and resistance lines, prior to considering a new trade signal. When the range is identified, it will work better to wait for a clear breakout of the range rather than trade each flip.
Common Mistakes with SuperTrend
A few avoidable mistakes cover most of the reasons why traders experience poor results while using this technical indicator. The combination of this tool with the separate momentum check, such as RSI confirmation, will help you avoid most of the pitfalls listed below.
Using the default settings on all timeframes, without adjusting the ATR period and multiplier to the specific asset and chart.
Following every flip on the ranging market, instead of waiting for the broader trend to be identified first.
Not taking into consideration the value of the latest ATR numbers to understand how much the market has become calmer or more volatile since the settings were checked.
Using the indicator alone as your trading strategy rather than as part of a bigger picture that includes the price action and momentum indicator.
Conclusion
The SuperTrend indicator is one of the very few technical indicators that provides the traders with an absolutely objective trading signal based on a volatility rather than some arbitrary distance, which is easy to read thanks to the color change. The main drawback is well-known, it performs poorly in ranging markets, but it can be easily addressed via additional filters and confirmations.
with Pocket Option demo account
Try DemoDisclaimer: Trading carries a high level of risk and can result in substantial losses. None of the materials provided herein are meant to be a substitute for professional financial advice. Please conduct your own risk assessment and consider consulting a financial advisor if necessary.
See more:InterestingTrading Strategies