Ichimoku Cloud Trading Strategy: Reading Kumo Signals on Pocket Option Charts
The objective of this guide is to enable you to learn how to use the Ichimoku Cloud to analyze the trend, momentum, and confirmation using the Ichimoku cloud breakout strategy on the Pocket Option trading platform.

What the Ichimoku Cloud Indicator Measures
The development of the Ichimoku Cloud came about from the need for an overlay which would measure trend direction, momentum and support or resistance all at once without needing multiple tools to be used together on one chart. Using one moving average tells you the direction of price action, which is discussed in this guide on moving averages for day trading, while the Ichimoku Cloud folds five components into one view.
Each of the five components is based on the high-low price levels over a certain period, and all five components are seen as one picture rather than five separate components. The end result is a chart that when understood takes less time to comprehend than several indicators.
Kumo (the Cloud): Reading Trend at a Glance
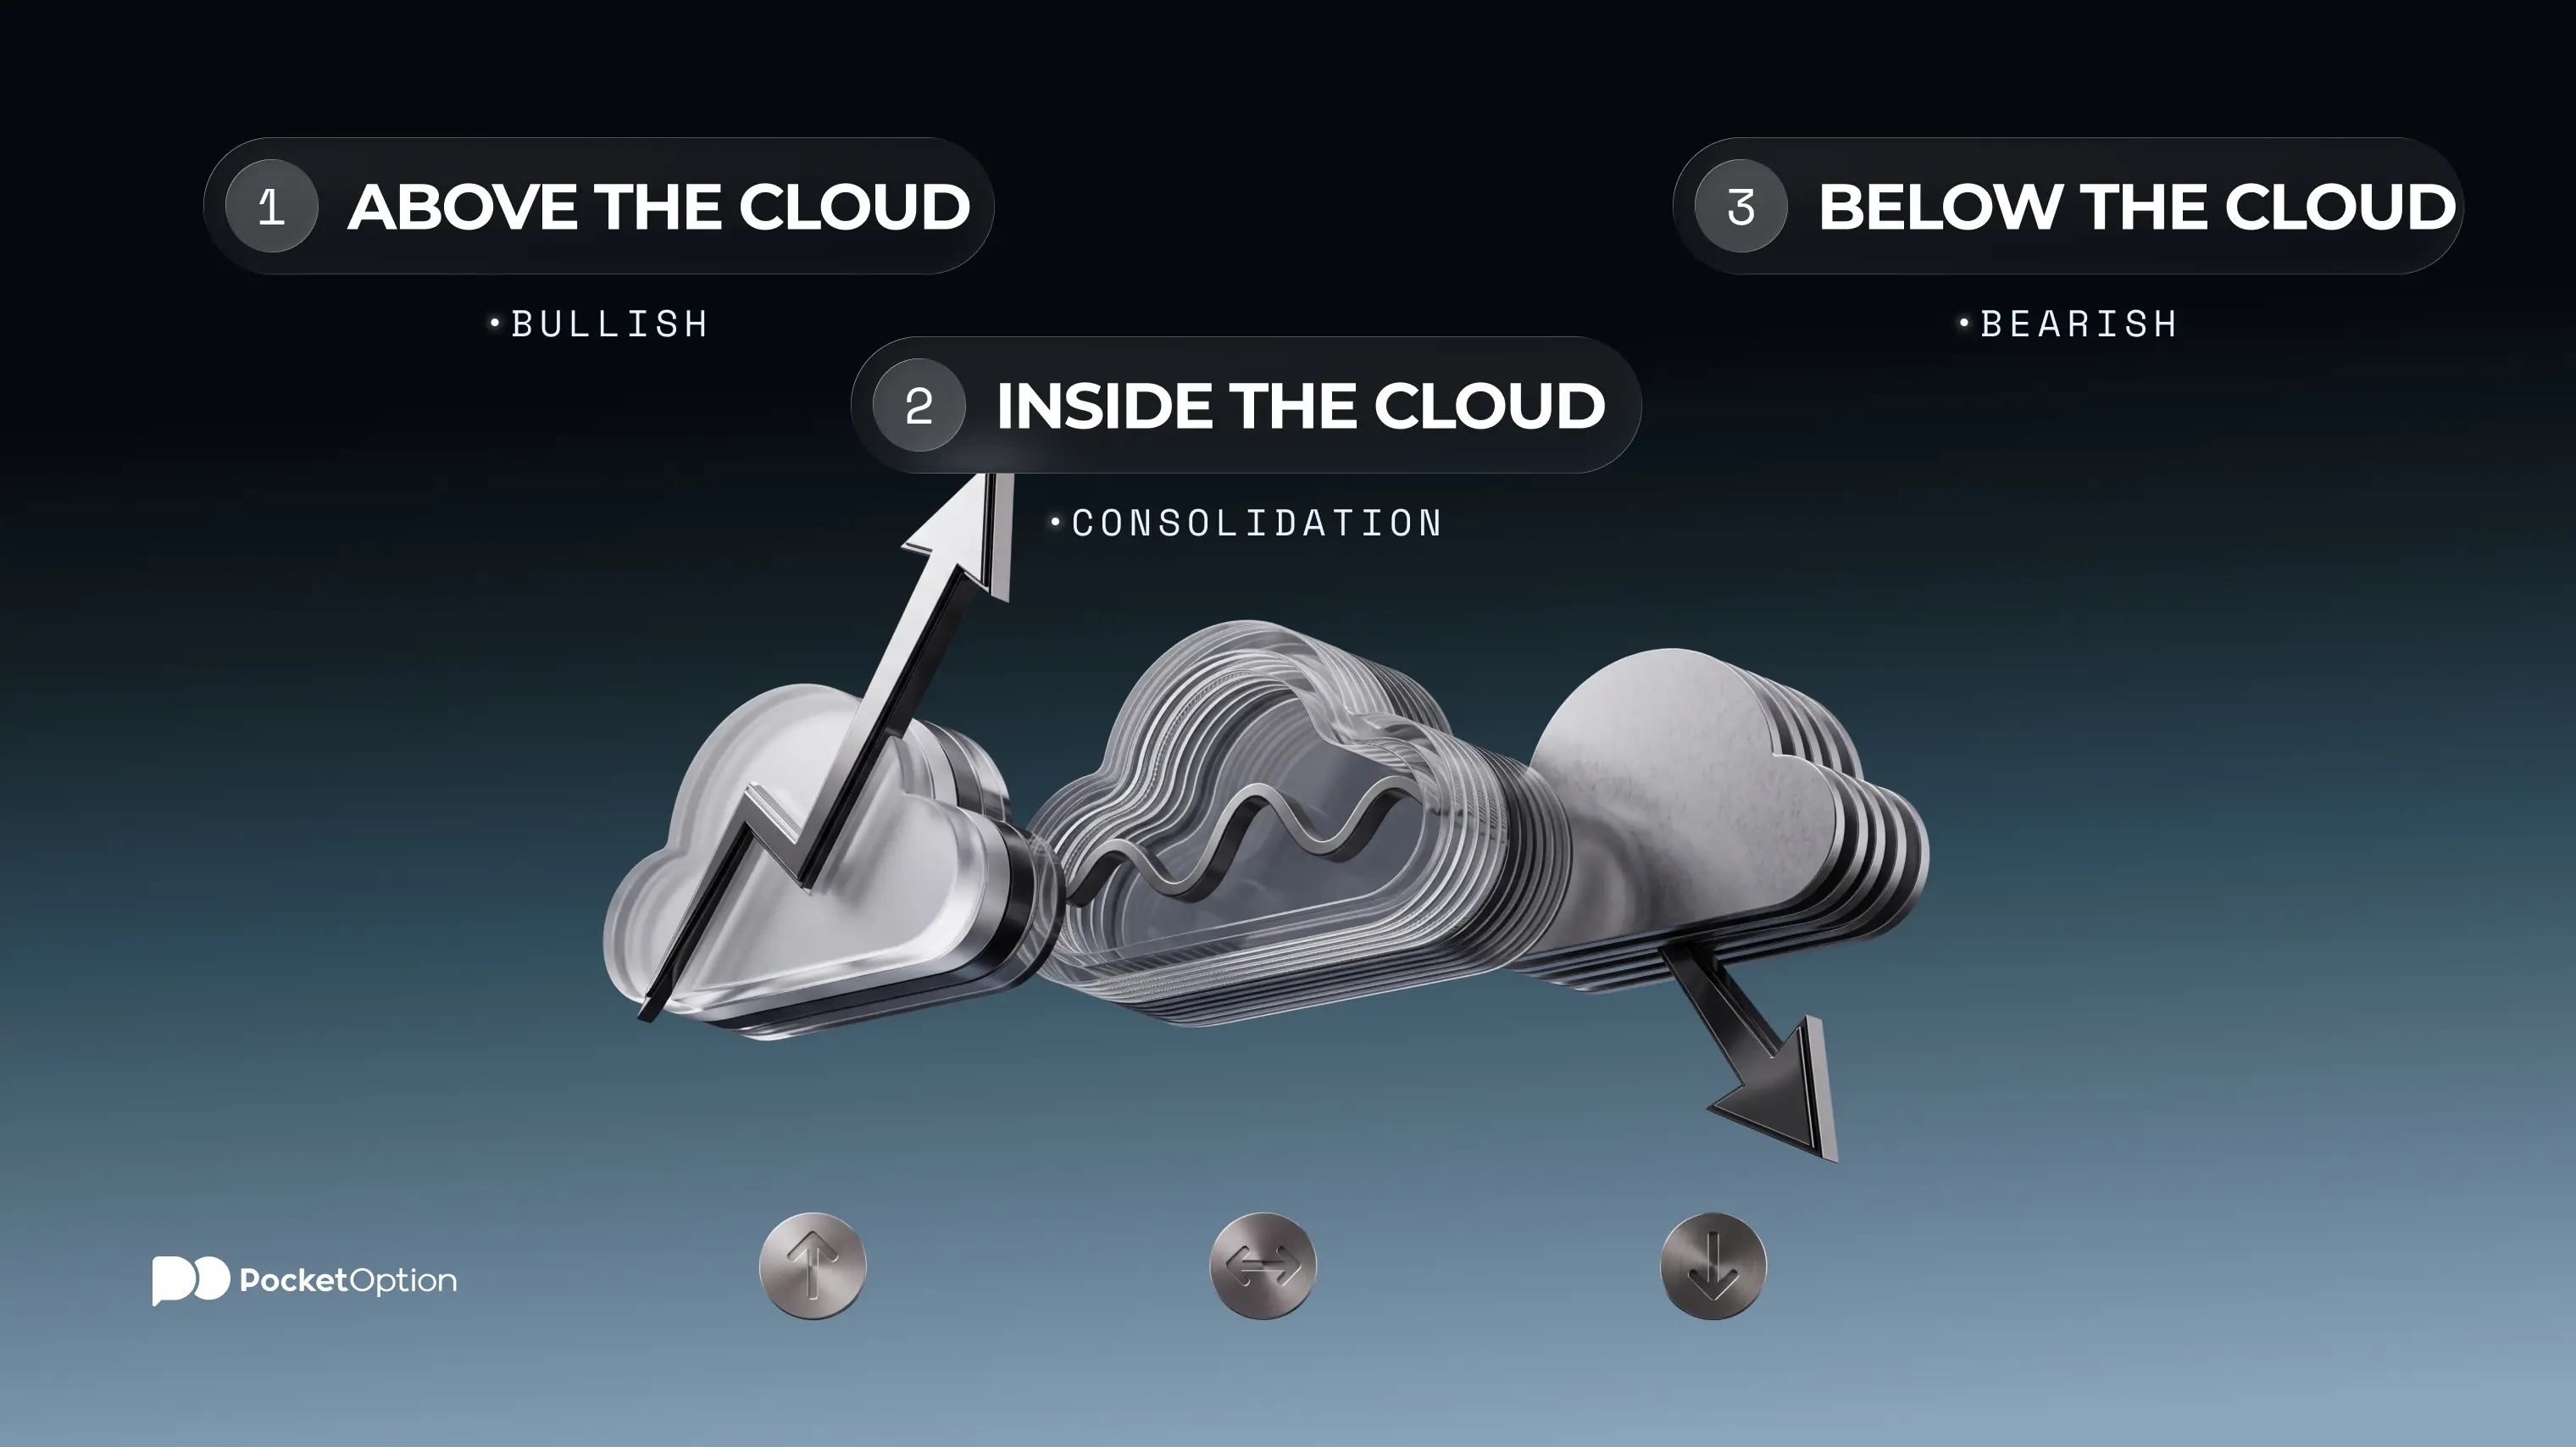
Kumo, which is translated as ‘cloud’ from Japanese, refers to the shaded area formed as a result of the difference between Senkou Span A and Senkou Span B. Kumo projection is indicated on the chart in the future direction and thus provides a prediction for future levels of support and resistance. It’s normally analyzed first before anything else on the chart.
Price above the cloud: the overall trend is usually considered bullish, and the cloud below price is considered as support.
Price inside the cloud: market is considered to be in a consolidation period, and signals from other indicators are generally given less weight until price moves out of the cloud.
Price below the cloud: the overall trend is usually considered bearish, and the cloud above price is considered as resistance.
It should be mentioned that cloud thickness is also important. In most cases, thick clouds provide stronger resistance and support, as the price should make a greater move to break them, while thin clouds provide weaker resistance and support, as they can be broken easier.
Tenkan-sen and Kijun-sen: Trigger and Base Lines
The Tenkan-sen, otherwise referred to as the conversion line, is the middle point between the highest high and lowest low during the past nine periods. It is highly responsive to prices and is usually regarded as the faster trigger line.
The Kijun-sen, the base line, employs the same method of midpoint calculations for a total of twenty-six periods, and so it is less volatile, and hence is usually considered a medium-term trendline and a level of support or resistance. A crossing of the Tenkan-sen over and under the Kijun-sen is usually interpreted as it would be for a fast and slow moving averages crossover, although in the context of the whole Ichimoku system it is just one piece of the puzzle.
Chikou Span: The Lagging Confirmation Line
The lagging span - Chikou Span - is nothing but the current closing price plotted back twenty-six bars on the graph. The indicator lags behind and is considered when there was a price level 26 periods before, similarly to how you analyze the momentum when there is an already formed candle pattern, an approach covered in more detail in this guide on how to read candlestick charts.
If Chikou Span appears above the price of 26 periods ago, it is regarded as a bullish signal. If Chikou Span appears below the price of 26 periods ago, it is regarded as a bearish signal. However, if Chikou Span is near the price of 26 periods ago, it is not regarded as a clear signal.
How to Read All Five Components
Any Ichimoku trader will eventually find that he or she requires an easy way to decipher all five indicators without making his or her charts look messy. Essentially, there are just three basic things to consider. What is the relationship between price and the cloud? Is Tenkan-sen above or below Kijun-sen?Is the Chikou Span independent of the prior price?
Component | What It Shows | Quick Read |
|---|---|---|
Tenkan-sen | Midpoint of the 9-period high and low | Short-term direction, the faster half of the crossover |
Kijun-sen | Midpoint of the 26-period high and low | Trend of medium term and dynamic support or resistance level |
Senkou Span A | Projection ahead of midpoints of Tenkan-sen and Kijun | One boundary of the cloud; whether it's the near or far edge relative to price depends on current trend direction |
Senkou Span B | Midpoint of the 52-period high and low, projected forward | The slower-moving of the two cloud boundaries; its position relative to Senkou Span A (near or far edge) depends on current trend direction |
Chikou Span | Present close, charted back 26 time frames | Checks whether the price in history supports the signal |
When one gets familiar with the three of them, there isn’t much about the information contained in the chart which isn’t clear from merely looking at it without using anything else.
Chikou Span, Tenkan-sen, Kijun-sen
Open Live AccountA Ready-Made Ichimoku Cloud Breakout Strategy
This trading system, in particular, entails the intersection of the breakout formation, the intersection of Tenkan-sen and Kijun-sen and the confirmation of the Chikou Span, and hence each signal in itself is not used separately for trading. The strategy is best for trend market conditions rather than ranging market conditions owing to the nature of the cloud in ranging market conditions.
It's actually very simple. The trend is based on price closing beyond the cloud, the timing of the Tenkan and Kijun crossover determines when to enter, while the Chikou Span comes into play as the final screen for entering a trade.
Entry and Exit Rules Using Tenkan/Kijun Crossovers
These rules will be considered one after the other, and in most cases, a trade is only made when all the three rules agree on the same direction.
Wait for a candle to completely close outside the cloud, either above or below the cloud depending on whether it is a long or short bias.
Tenkan-sen needs to be above Kijun-sen for a long entry and below Kijun-sen for a short entry.
Ensure that Chikou Span is clear of the price level from twenty-six periods ago, in the direction of your trade.
Decide on the level for the stop-loss beyond the nearest boundary of the cloud or swing point before placing the trade, depending on the amount of the position discussed in this guide on day trading risk management. Remember that Stop Loss is supported in MT4/MT5 and Shares Trading, while it’s not supported in Quick Trading.
It is recommended that one exits from the trade or executes stop loss when the Tenkan-sen line breaks through the Kijun-sen line, or even when the price action returns within the cloud region; this is a method that manages an open trade while trading on MT4/MT5 or in the Shares Trading mode, which supports stop loss.
The potential benefit associated with this system is not realized until it is compared to the risk outlined in the fourth step because a strategy without a stop is not really a strategy at all.
Confirming Signals with Chikou Span
Chikou Span test in step three is the distinguishing factor between a complete Ichimoku trading setup and an incomplete Ichimoku trading setup. Cloud breakout coupled with Tenkan and Kijun crossover may still happen in the middle of choppy price action; and it is the lagging span that will weed out a large number of such false breaks.
If there is a contradiction between Chikou Span and other indicators, such as Chikou Span being below the historical prices but the cloud and crossover both pointing upwards, the better trade setup is to consider the setup as invalid.
Reading Ichimoku Signals on Pocket Option Charts
In order to start reading Ichimoku signals using the charting software Pocket Option, one needs to place an Ichimoku Cloud on the chart in the same manner as with any other overlay indicator. To do this, it is required to select the Ichimoku indicator from the panel of indicators and use the default periods of nine, twenty-six, and fifty-two periods.
While some traders include just one additional oscillator to provide further confirmation, such an inclusion is discussed in this article on how to use the RSI indicator for day trading, the Ichimoku Cloud can be used alone once all five elements are comprehended, as it helps keep the chart clean.
Common Mistakes When Trading the Ichimoku Cloud
One such mistake that is frequently committed by traders is taking trades while price is within the cloud. The significance of the crossover or the Chikou Span reading while the price is within the cloud is much lower compared to the same signal outside the cloud.
Another prevalent error is to not use the Chikou span to confirm since that will save some time, thereby eliminating one of the three confirmations required by this trading technique. Another is the application of the indicator on short-term periods where there is no clear trend behind the lines that keep crossing each other in an erratic fashion due to high noise. The fourth is using multiple additional indicators along with Ichimoku.
$50,000 and unlimited refills for practicing any strategy
Try DemoConclusion
The Ichimoku Cloud provides all of these three elements (trend, momentum, and confirmation) within one indicator overlay. This indicator can be used based on the location of prices in relation to the cloud, the intersection of Tenkan-sen and Kijun-sen, and Chikou Span confirmation. The strategy provided above combines all of the three elements of checks for a full trading procedure.
In any other approach, it is impossible to bypass the necessity of risk management since profitability is always dependent on this.
Disclaimer: There is a risk associated with trading and not everyone can trade. The use of the Ichimoku Cloud, as well as other technical indicators, can be helpful in determining where to potentially enter and exit the market; however, it should be noted that none of the indicators is a sure guarantee of profitability, nor does a historical pattern on a chart imply future trends.
See more:InterestingTrading Strategies