What Is P/B Ratio? How to Tell If a Stock Is Cheap or Expensive Relative to Its Assets
Two companies can trade at the same share price, but actually be worth totally different things on paper. One fast way to notice that is to see the market value, and hold it to the assets that the business owns. This is the P/B ration, and it can show how much the business and the stock is worth underneath.

What Is the P/B Ratio: Definition
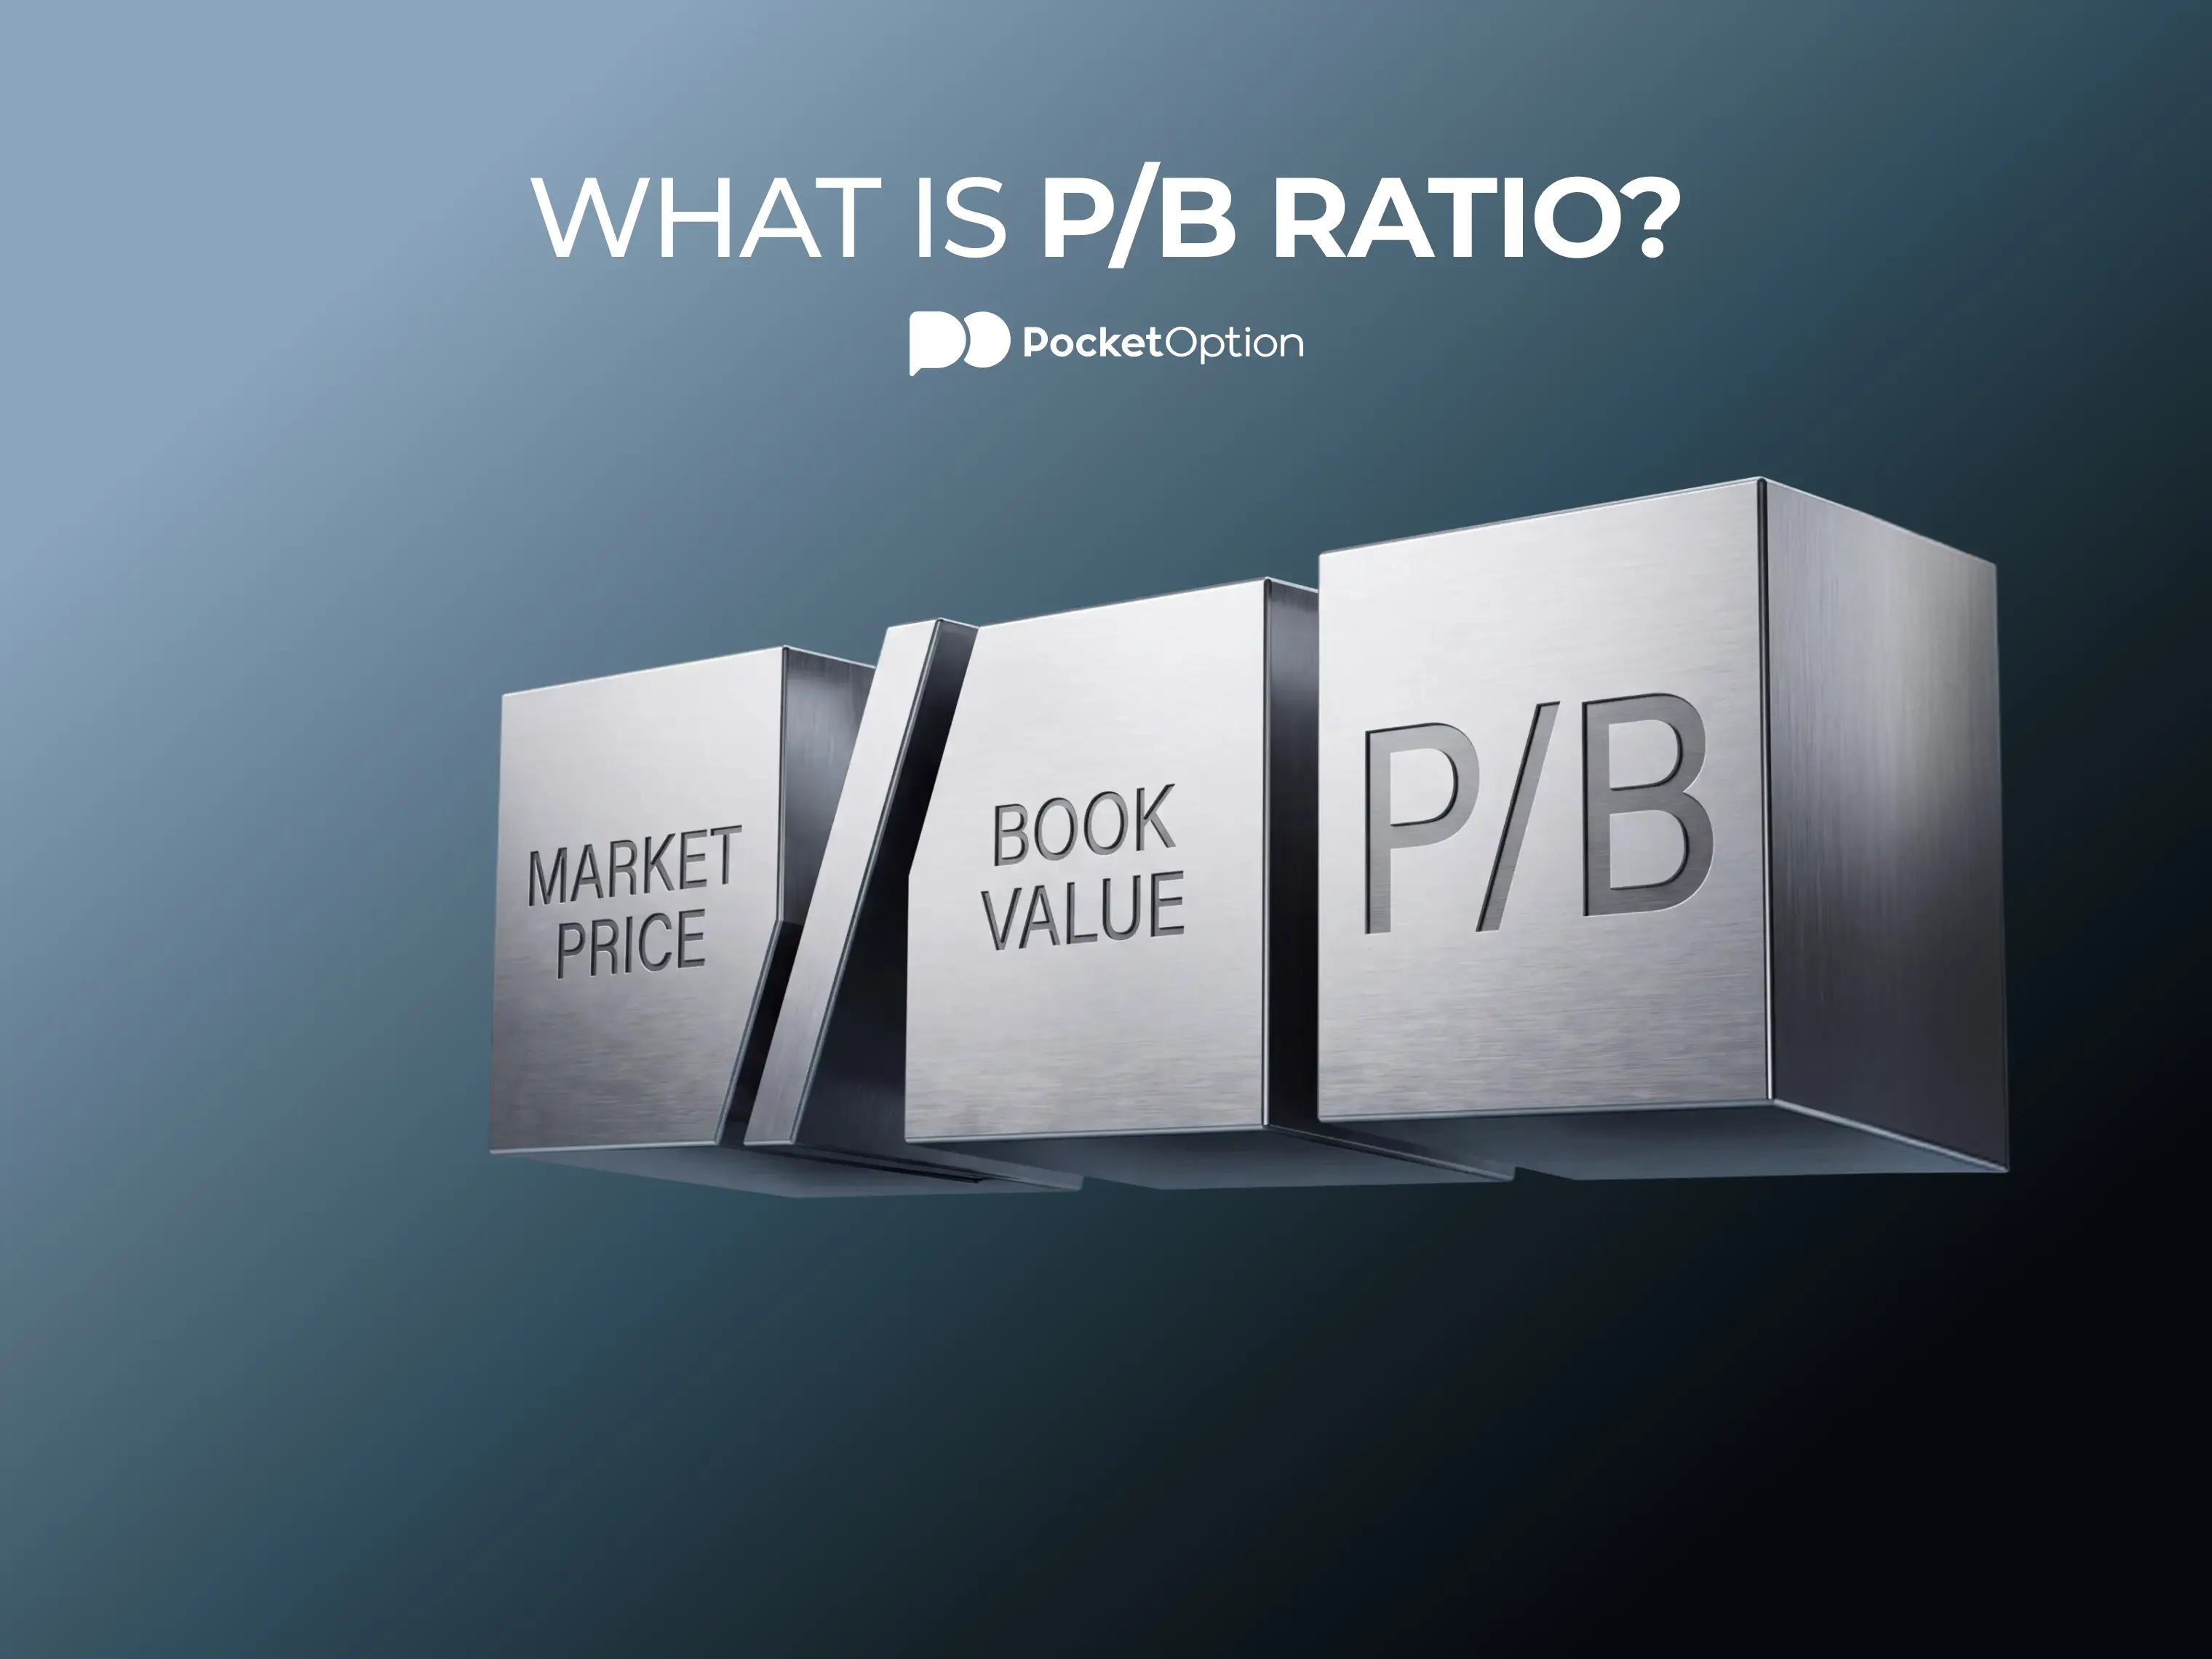
The P/B ratio compares what the market now pays for a company next to the value of that company as written down in its own books. ‘Book value’ is assets, minus what the company owes. So it ends up being roughly what would be left sitting there for shareholders if the entire company got sold at the numbers on the balance sheet, and every debt got settled. This is a rather useful metric to understand the ‘healthiness’ of the company underneath all the fluff. For example, a reading of 1.0 means the two match up exactly. Above that, and the market is seemingly paying premium over the accounting value. Under it, the market is now paying less than the books claim it can all be worth.
Most people start out with what is P/B ratio for the company, and jump straight down to the formula. But that skips the bit that matters. The number says most when it is sat next to another number. On its own it’s just a fact with nothing around it, like saying ‘a company has 4,000 employees’. Is it good or bad, is it an upside or a downside? It depends.
The short version of what is a P/B ratio goes like this: market price over accounting net worth. It comes out of the same family as the other multiples which we covered in this overview of how to value a company, it’s one of the metrics to do that. The value of P/B is that both of the numbers that you need are already published, and it’s easy to check and compare, for example with other companies in the same industry.
Comparing this metric is useful, but notice that you can also bump into the same measure wearing other names, on various platforms. The long way of mentioning this concept, by talking about the price to book ratio, is rather common. The metric stays the same, just the wording is different. Similarly, market to book ratio also shuffles the words around, but without touching the maths underneath.
A few screeners can also say PB stock at the top of the column, but it has the same P/B ratio meaning as all the previous phrases. The odd one out is just the book to market ratio, which flips the whole thing over and divides book value by market value. So it’s essentially an inverse of P/B (but is still being used in some places, pretty actively).
The P/B Ratio Formula
There are two ways to write down the P/B ratio formula:
At the company level: its market capitalisation, divided by book value of equity.
At the per share level: its share price, divided by book value per share. This is the version most people reach for.
‘Market capitalization’ equals price per share, times current shares outstanding. ‘Book value’ of equity means total assets, minus total liabilities. The only question remaining then is how to calculate book value per share. And it’s actually less work than what it can sound like. Just take the equity figure, knock preferred equity off (if there’s any), and then split that by the # of shares. If you want an even more careful answer, use the diluted share count. That’s it!
A warning about timing: remember that market cap moves every day, but the ‘book value’ on the company sheet gets updated only once a quarter. So a ratio built on an old balance sheet can be subtly wrong, because a lot has changed since last reporting. The company may have sold part of its assets, or something. But you wouldn’t know, if you’re looking at just the old data. Take that into account.
A Worked Example
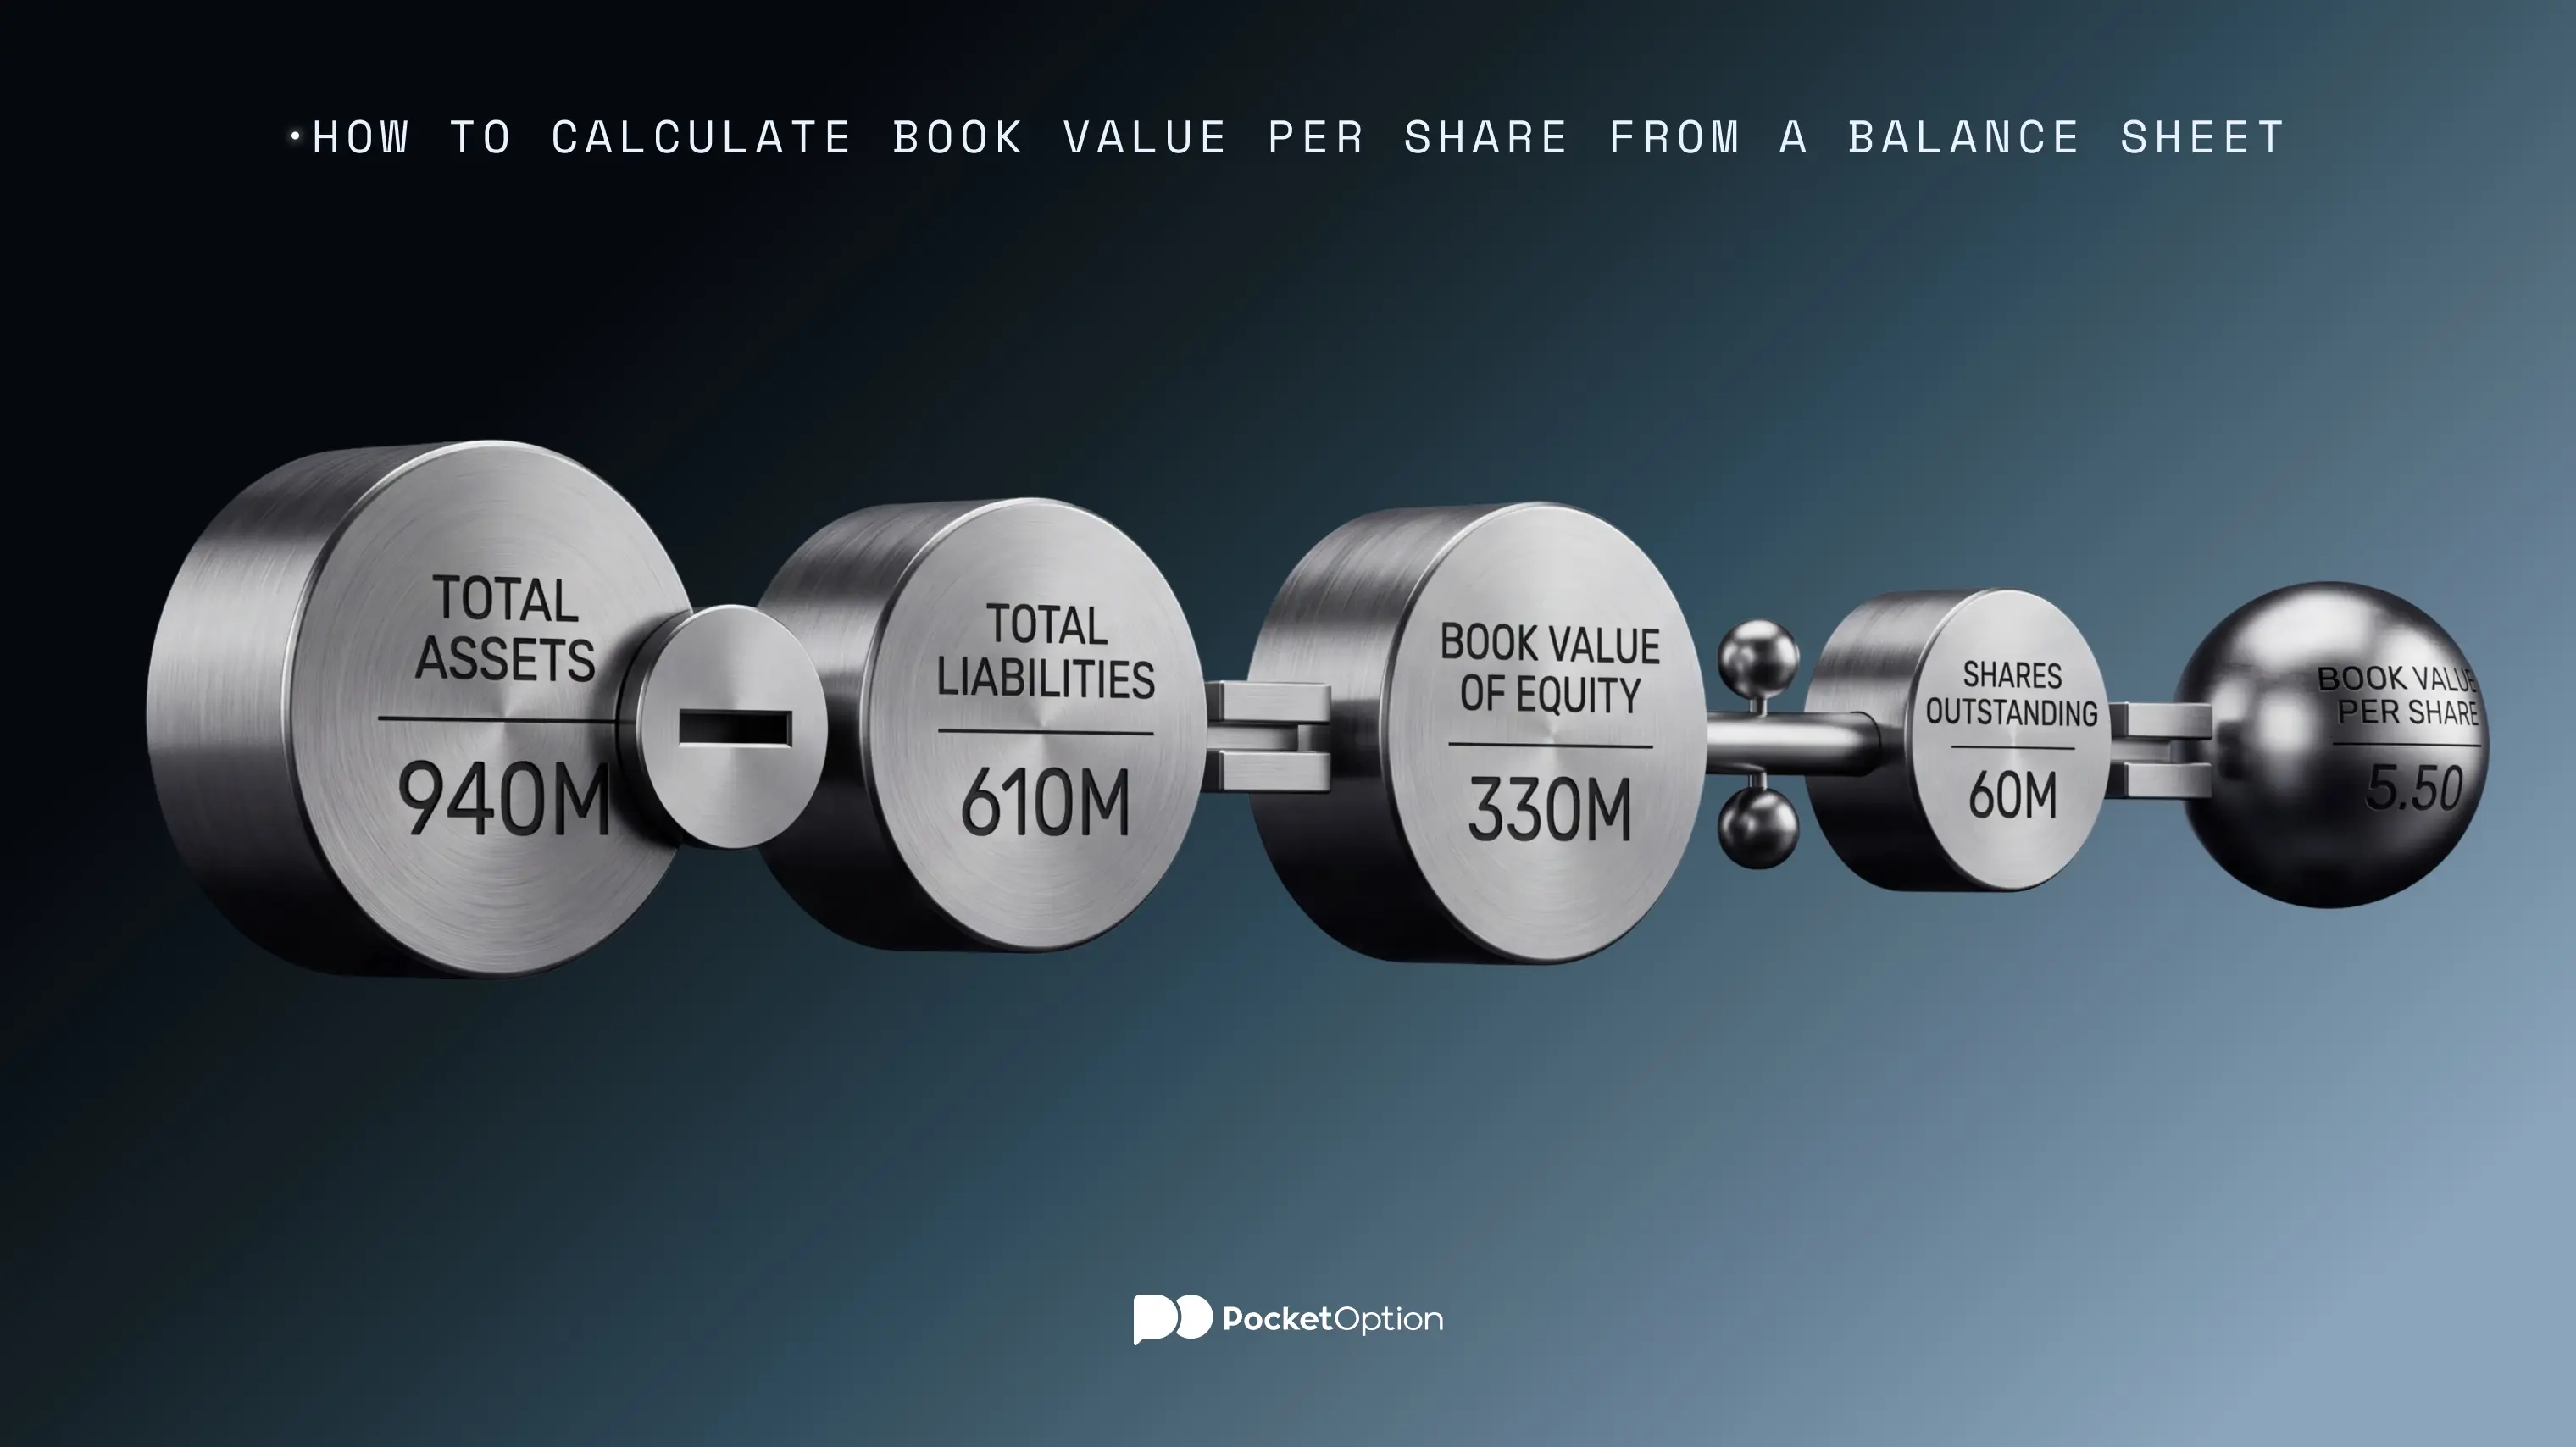
Let’s take this made up manufacturer. The figures below are invented, but they behave like the real ones would.
Line item | Figure |
|---|---|
Total assets | $940 million |
Total liabilities | $610 million |
Book value of equity | $330 million |
Shares outstanding | $60 million |
Share price | $8.25 |
Book value of equity: 940 minus 610 (liabilities). That leaves us $330 million.
Book value per share: $330 million is split by 60 million shares, so its $5,50 per share.
Share price over book value per share: 8.25 divided by 5.50, which gives 1.5. This is how much price is ‘inflated’ compared to the book value. Market is paying slight premium.
In this case, the market is essentially paying a $1,5 for every dollar of net assets that is sitting on the company’s books. So there’s likely some growth story baked in here, or maybe some expectations of future success. Whether that is realistic or not depends on what the company does, and what the outlook is.
What Is a Good P/B Ratio
There is no ‘one size’ answer to what is a good P/B ratio. Here, context does most of the lifting, and things depend on:
Sector. Banks, manufacturers, insurance companies can sit under 1.0 comfortably, but AI or IT growth companies rarely do.
Profitability. If a business is making strong returns YoY, it can have higher multiples of P/B, and fairly so.
Balance sheet quality. ‘Bad’ or ‘older’ assets might be worth less today.
The company's own past. Where has the P/B ratio been before.
As a rough working habit, a good P/B ratio is one that sits under comparable companies, while the business itself is in no worse shape than they are. That is a company that might be interesting to look at more in-depth.
Old value screens put the ‘line in the sand’ at around 1.0. That habit came out of a time when most listed companies owned factories and machines, and real physical objects sitting in a warehouse somewhere. But far fewer of them do now, so the old cutoff is no longer as relevant, and a P/B ratio can often be quite large, or quite small, without it being an explicit red or green flag.
Why a Low P/B Ratio Isn't Always a Bargain
A reading under 1.0 says that market values the company below its own stated net assets. That happens for reasons, though, and most of those are far from nice. For instance, assets might be marked too high in the books. Earnings might be sliding down. The company might be eating through its equity now, and that drags the book value down every quarter, making the ratio look cheaper.
Small, barely traded names are where this turns up the most. Why some volume and R/B reading you can’t really trust is covered in this guide to penny stock risks and pump and dump schemes. Note that a screen sorted only by price to book ratio is going to miss plenty of things that are important to check.
Write downs are the other ‘trap’. Book value assumes that balance sheet is right as of currently. If some big asset gets impaired next quarter, the equity figures drop, and the ratio you worked out turns out to have been measuring something that had already gone.
Set up and start analysing
Get StartedWhere the P/B Ratio Doesn't Work Well
The measure was built mainly for businesses whose value sits in physical stuff. Banks, insurers, property firms, heavy industries, etc. For those, book value works well as a stand in for what the business is ‘made of’.
But asset-light companies break this, somewhat. A software firm, a market agency, a research heavy pharma business, most of their worth can be brand, code, or patents. So direct accounting misses some important parts. Book value can come out relatively tiny, and the ratio may come out huge (showing that the company is ‘heavily overvalued’). This can tell you next to nothing, though. It’s worth remembering this when you are picking up how the stock market works and how to trade stocks, because apps and platforms may keep on ranking those companies as permanently dear, when this is not the case.
Buybacks also can bend the metric. For instance, a company actively purchasing its own stock above book value can shrink the current equity. This would push the P/B ratio up, even though nothing inside the business has improved or stabilized.
Conclusion
The P/B ratio answers one simple, and rather narrow question, but it answers it well. If you want to know how the market price stacks up against the accounting value of what the company owns, there’s nothing that beats the P/B. But remember to keep the comparisons inside a sector, and watch out for the balance sheet date, and how long ago it was. Also, treat anything under 1.0 as a question to go and dig into deeper, rather than an answer that you already got.
Test ideas before real money.
Try DemoDisclaimer: This article is made for informational purpose only, and does not constitute financial advice. Trading involves risks, and past performances do not guarantee future results.
See more:Education