6858
 Albert RobertsonBearish
A two-period lookback turns the classic RSI indicator into something absolutely different. In this case, the RSI can bounce off the walls from 0 to 100 in a few sessions, and it almost never stays in the middle ground. That's the purpose of it precisely. The 2 period RSI is not supposed to hunt for overbought areas. Its purpose is spotting a brief pullback inside a trend that continues. There is a difference between the purposes of such trading styles, hence between optimal lookbacks and exits. This guide introduces the basic principles of this method, two sample trades, reasons to ignore signals, and the effect of fees on ultra-frequent trading.
 Albert RobertsonBearish
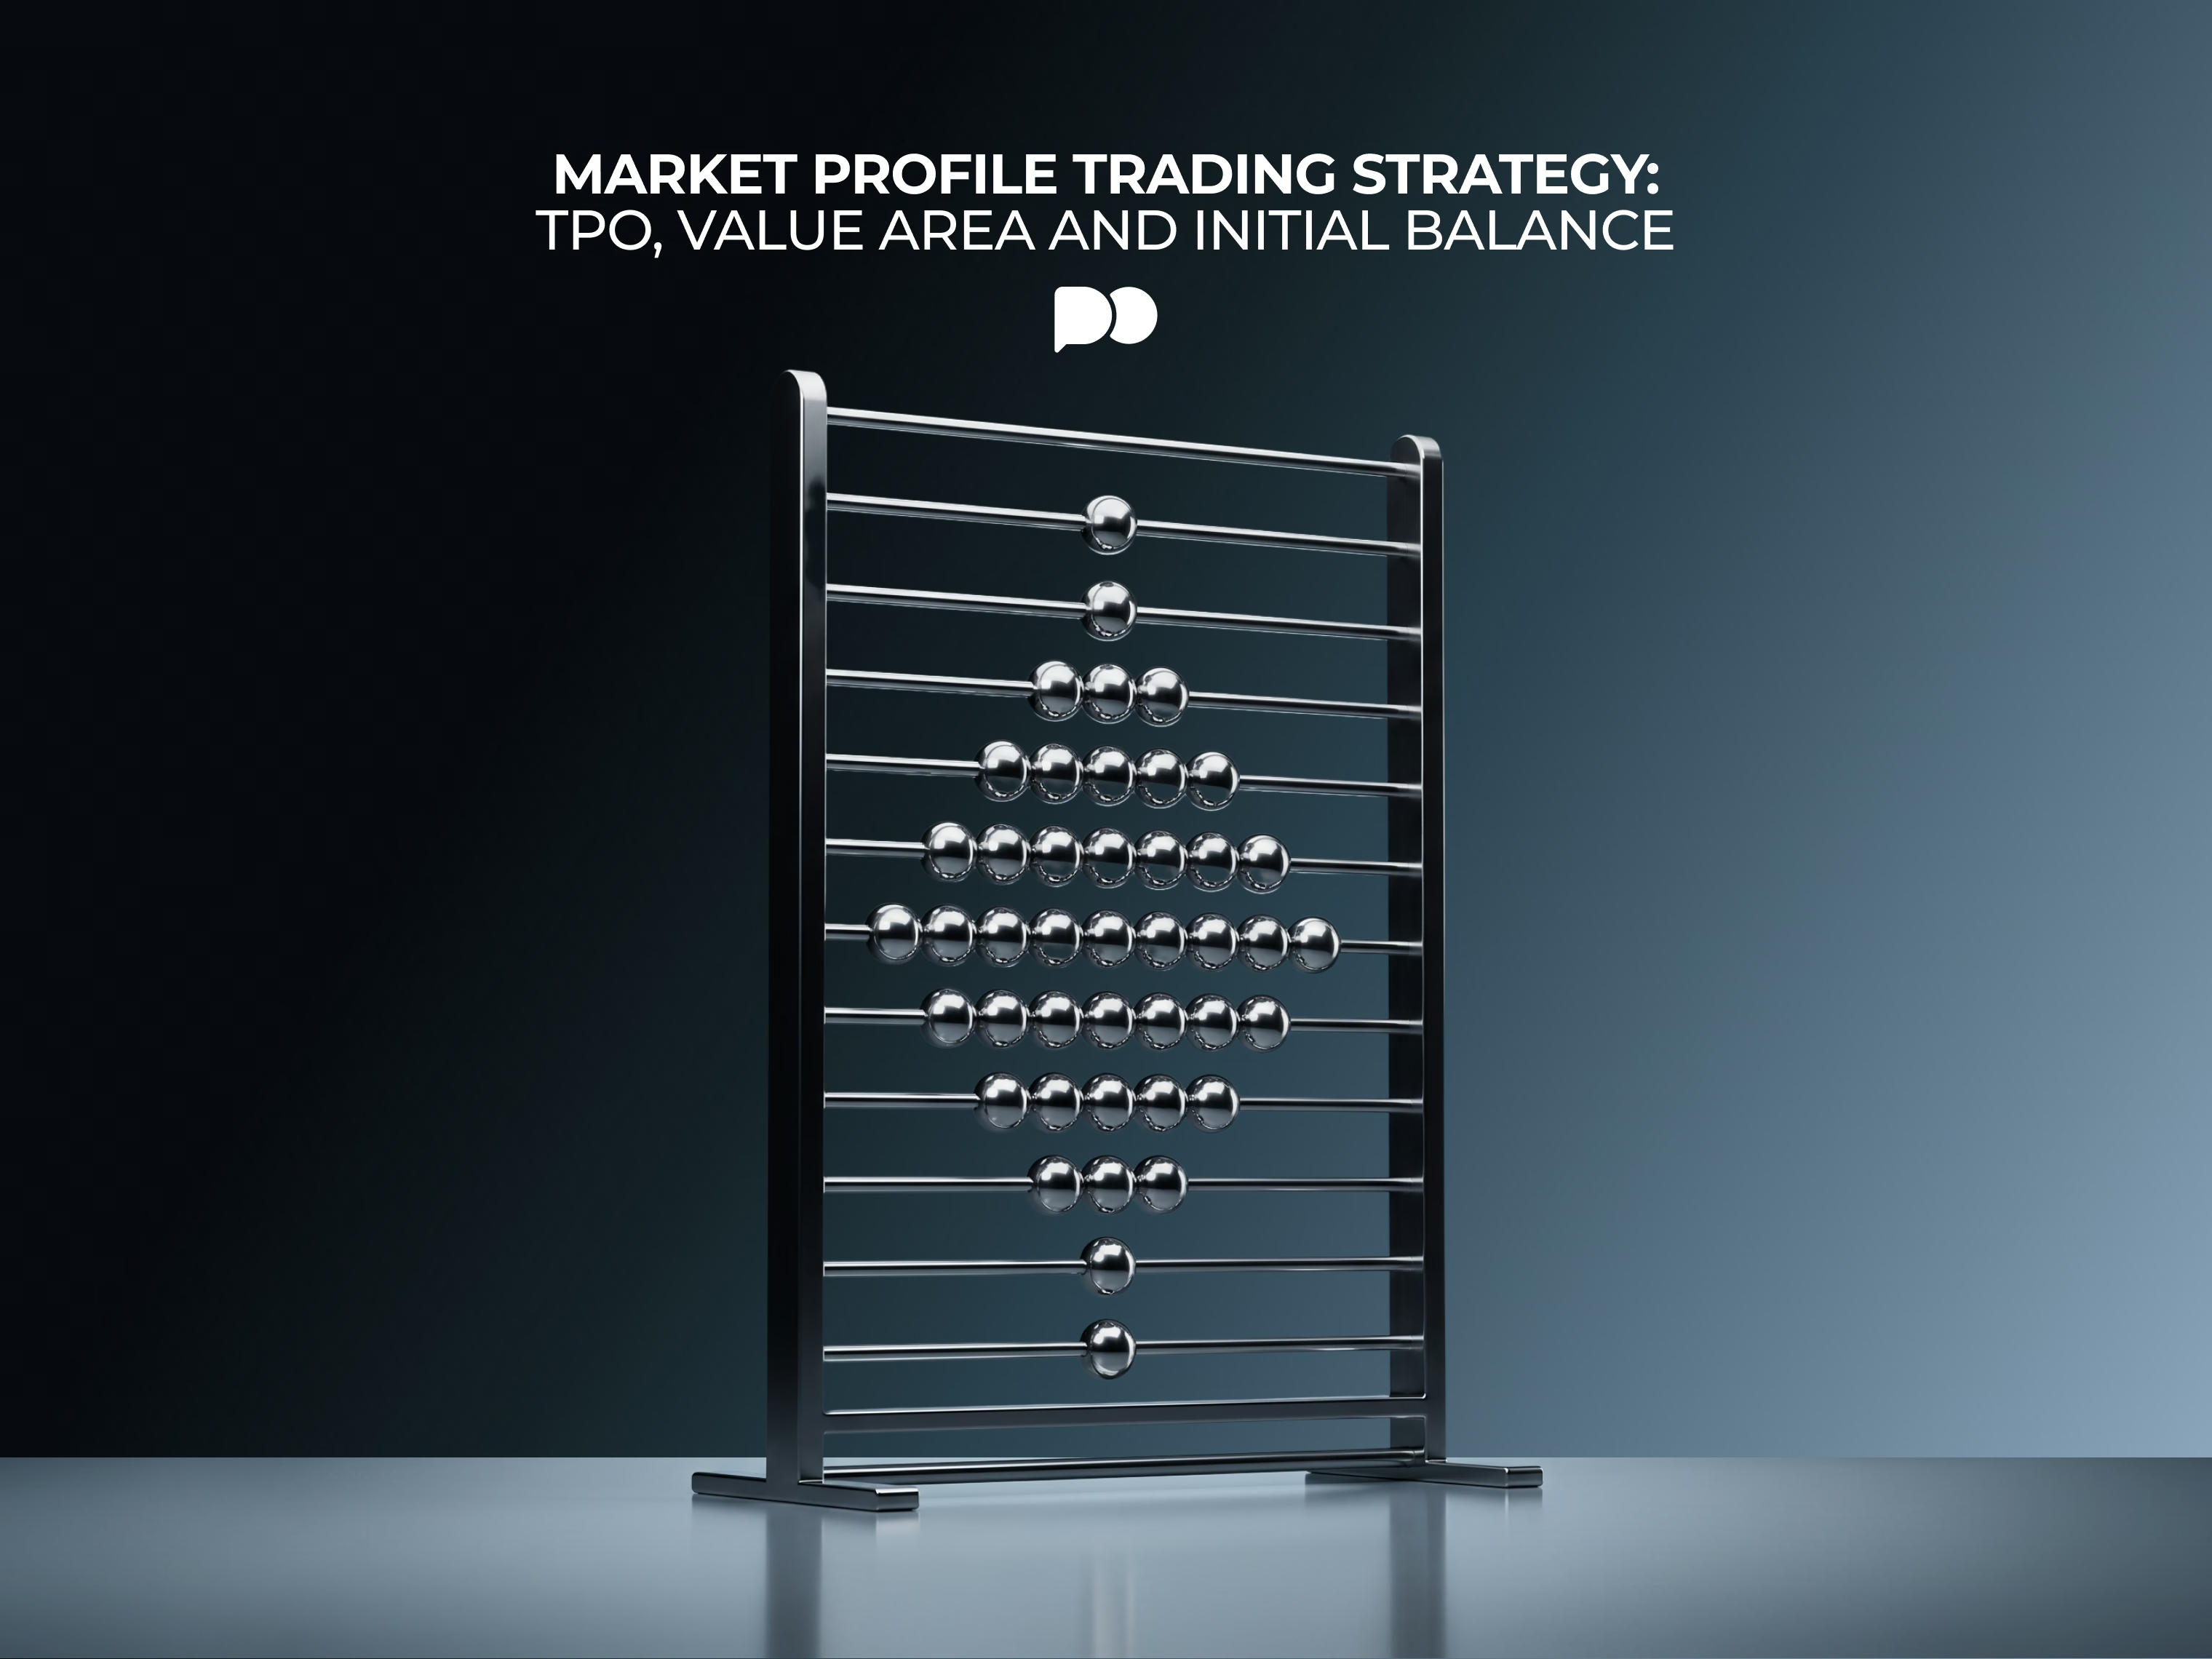
A price chart shows where the market went. A market profile shows where it spent its time, and that turns out a rather different picture, often the more useful one. What follows is how a TPO profile gets built and read, and how trades get planned around value and the first hour, failures included.
 Albert RobertsonBearish
A long wick means price has been trying to go somewhere, but failed and was driven back out. The failed area is the area you outline. The rejected area becomes the rejection block, and trading is about what happens when price returns to it later on. The present piece is a guide on how to mark it according to a fixed rule, how to assess a retest, and in what circumstances it may become invalid. There is also a discussion of what separates rejection blocks from pin bars and order blocks, which are often confused.




 Albert RobertsonBearish
Most losing strategies aren't wrong per se; they're simply being used in the wrong market. Fading the edges of a range only works while the market is still in a range. Trading strength only pays out when strength is being rewarded. The question this approach answers, which method applies in the present environment, takes precedence over any entry rule.
 Albert RobertsonBearish
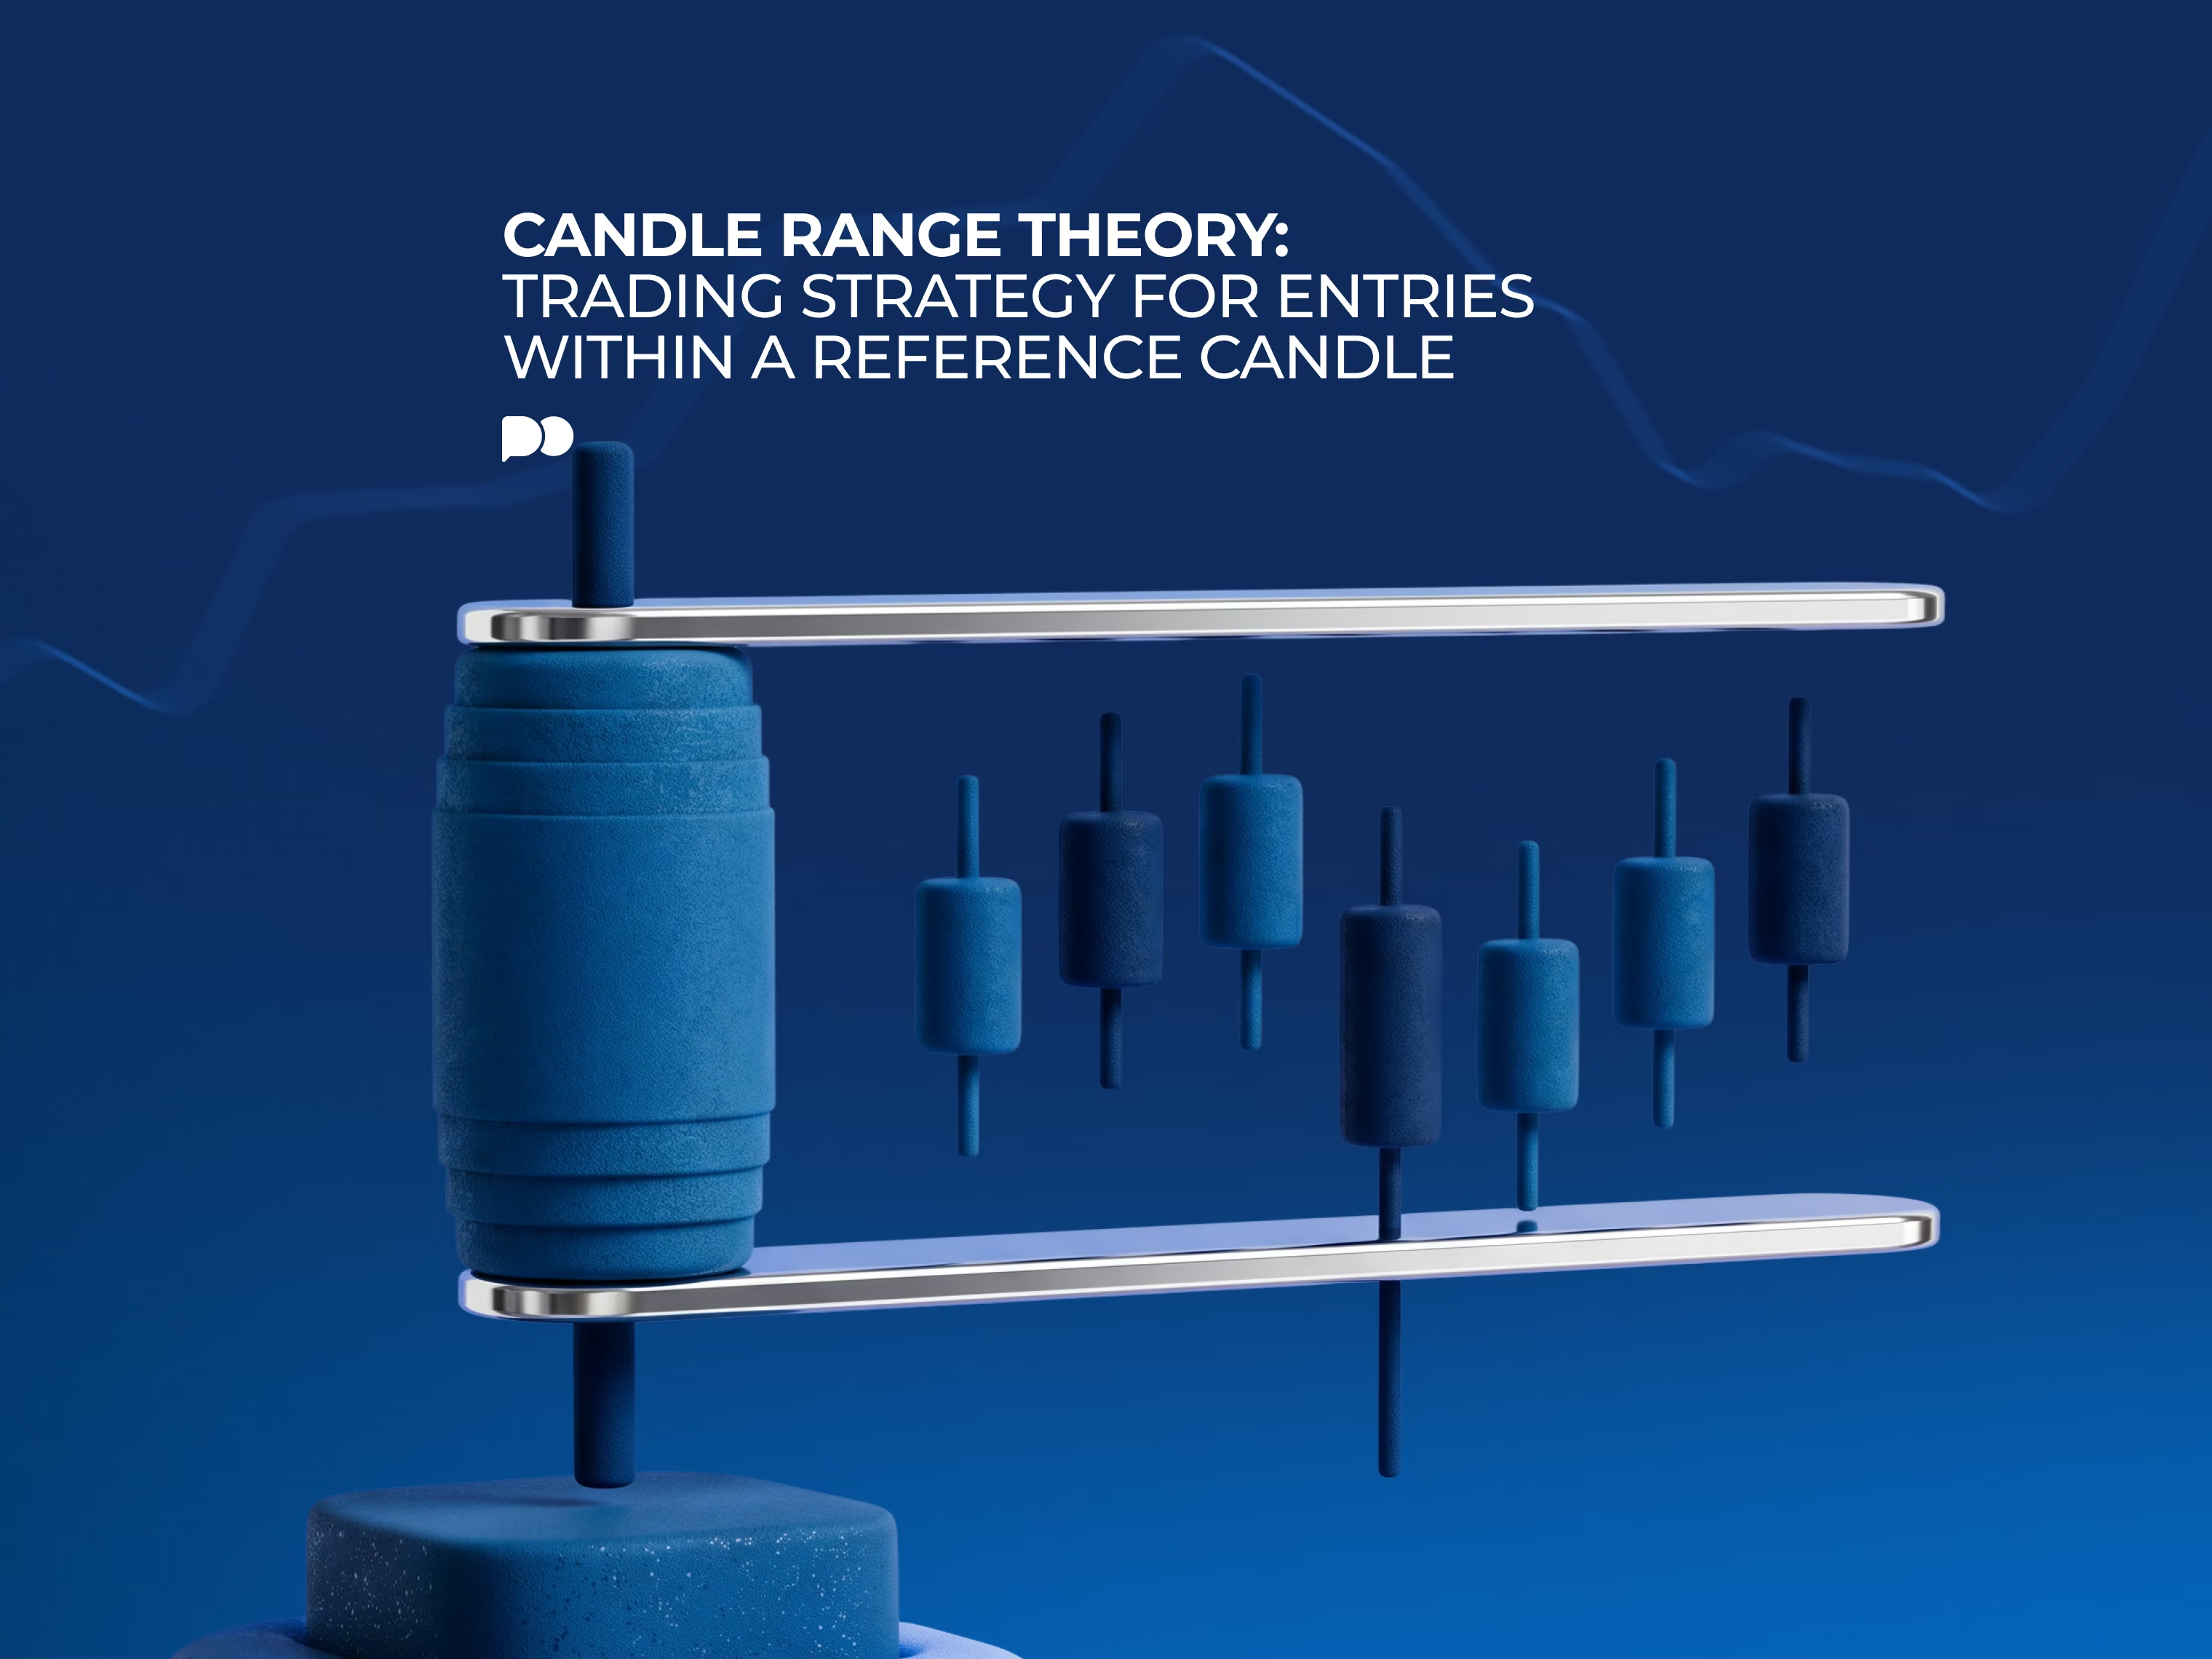
Select one completed candle and write its high and low. These two lines define the entire concept. What follows is the process: price pushes through one boundary, fails to maintain the position, returns to the range, and may then move towards the other boundary. The article explains the conditions for each of these points, provides two annotated examples, and dedicates one section to the case where price fails to continue after the return to the range. And that part is usually omitted, although it determines whether the framework is useful or not.
 Albert RobertsonBearish
Take two markets that often move together. One of them prints a new high/low, but the other one doesn’t. A mismatch like this can be interpreted as a reversal sign. People call it SMT divergence, and it might be a useful tool in your trading toolkit.
 Eric BriggsBearish
The Crypto Volatility Index, CVI for short, gives a number on how big of a price swing the options market expects from cryptos to be over the next 30 days. Not the way it will go, only the size, but that can still give traders a lot of useful guidance.
 Diego FernándezBearish
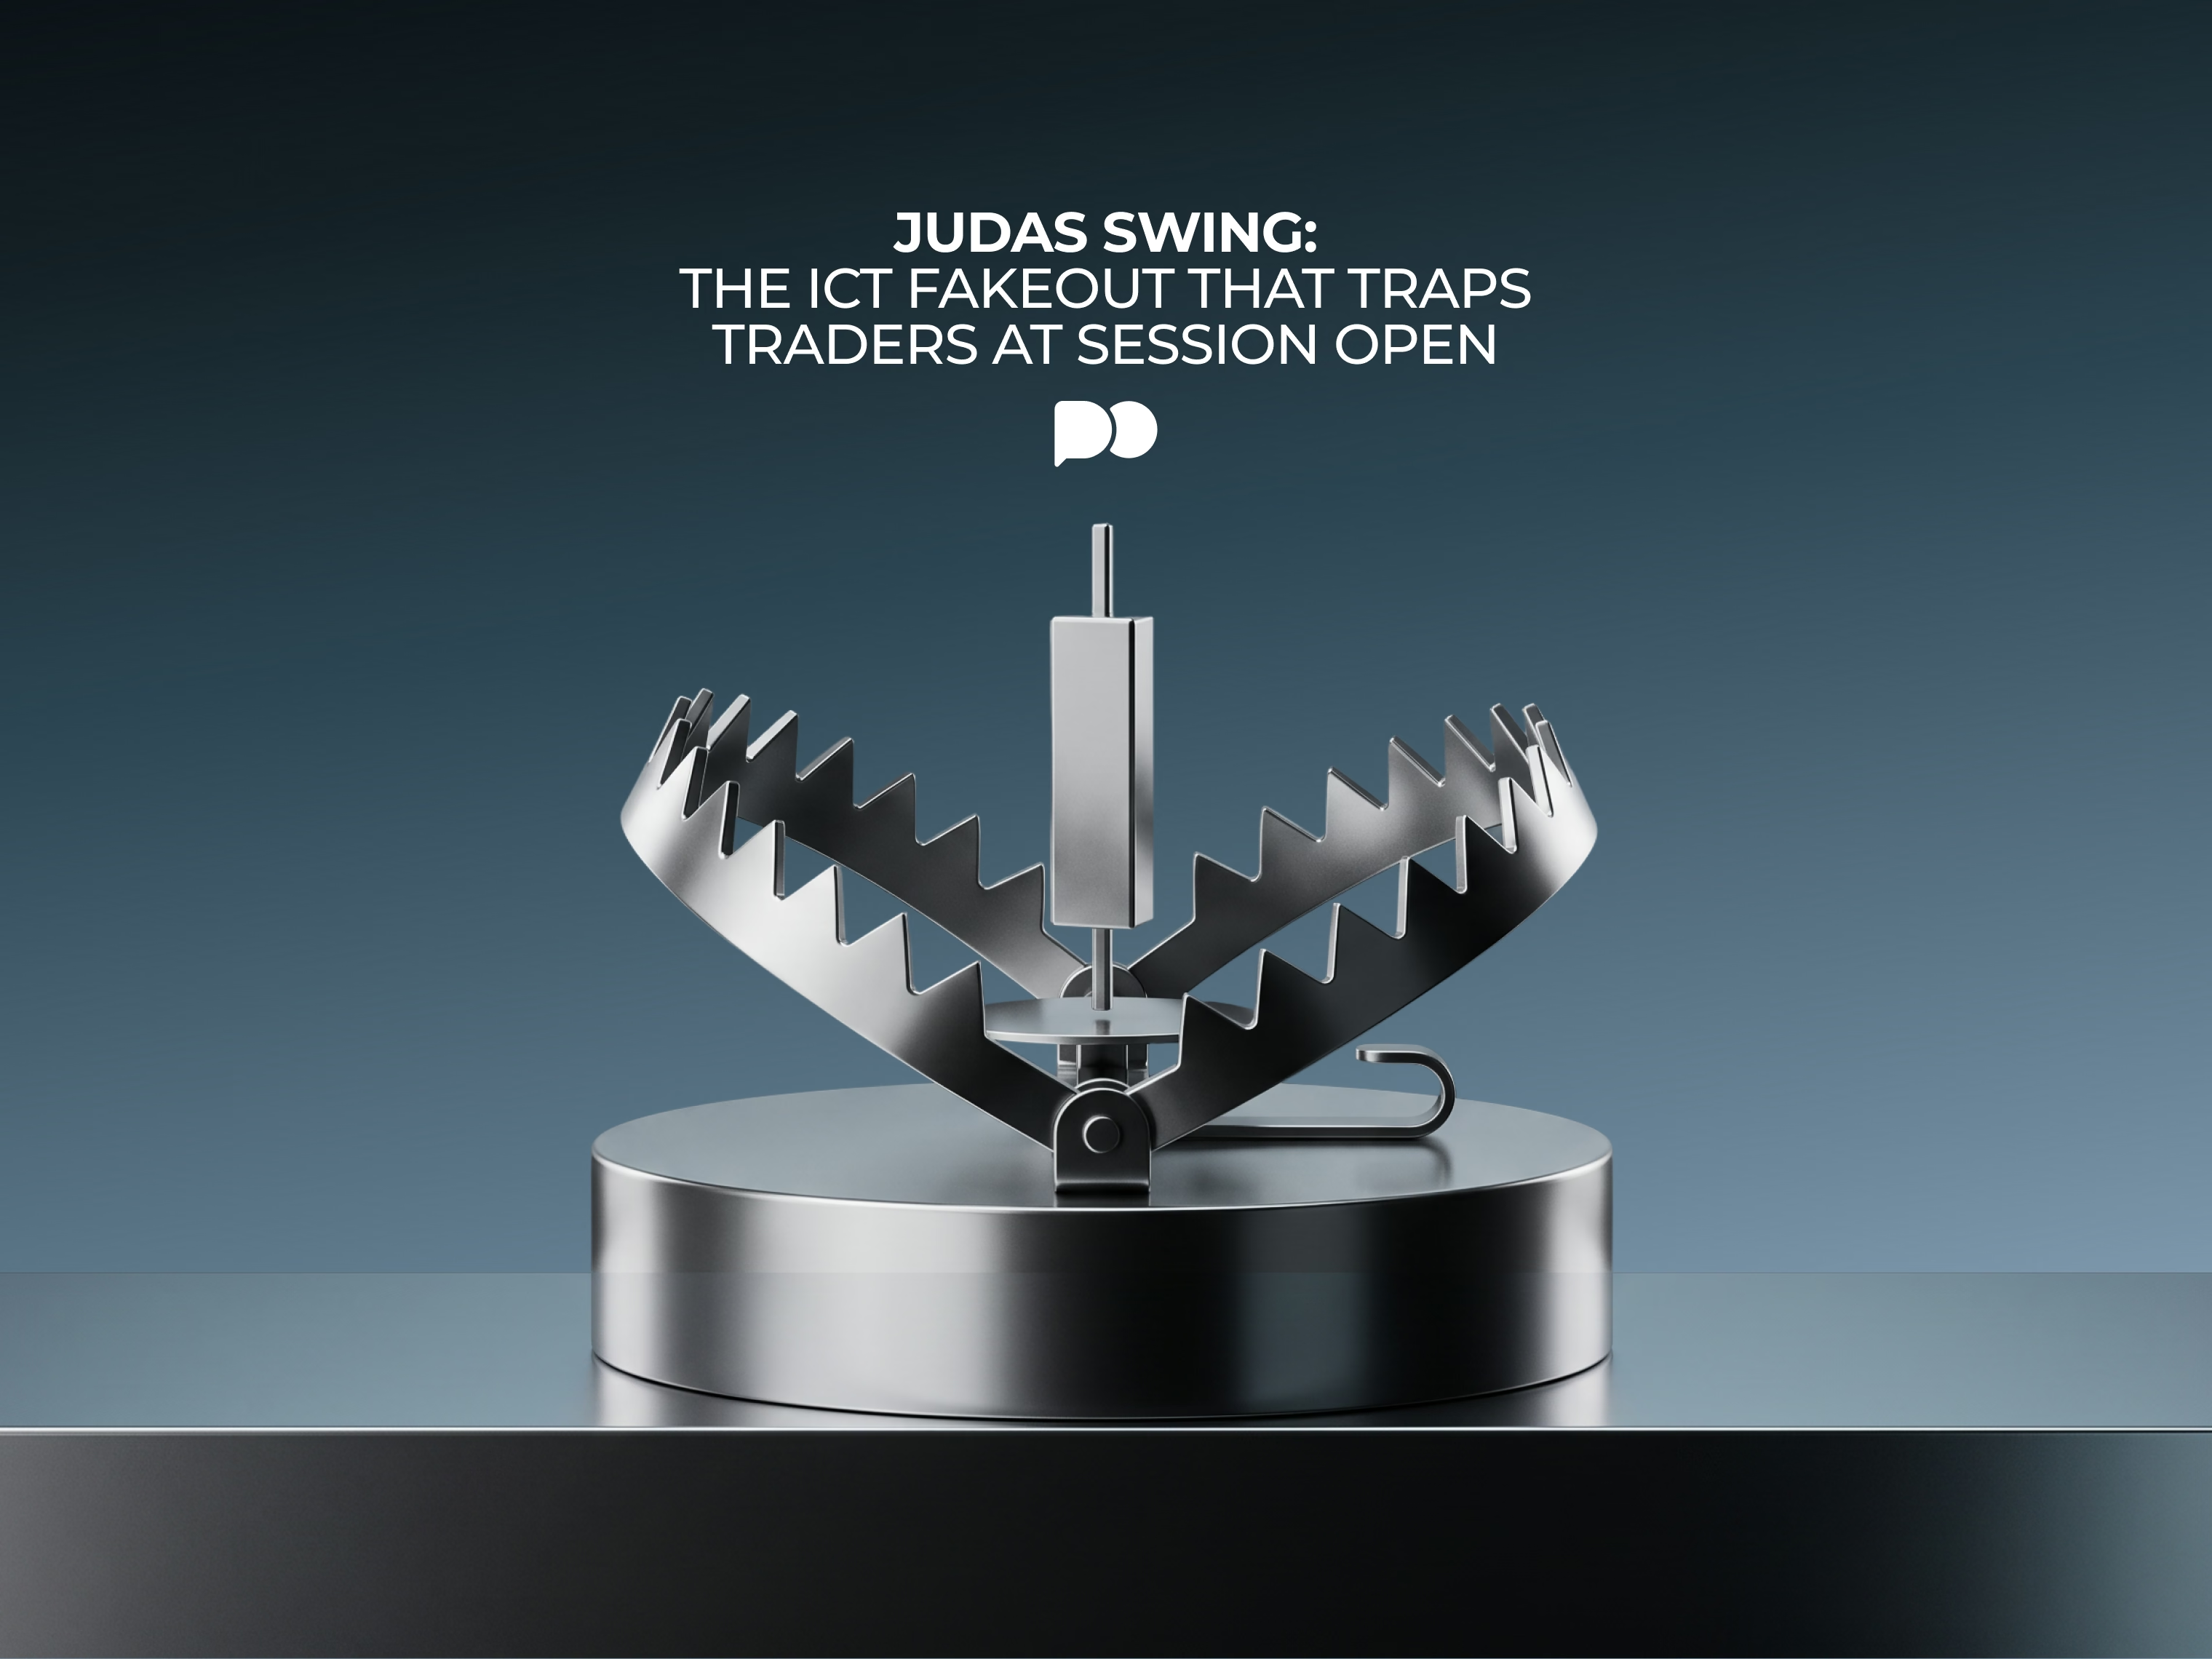
A session opens, price shoots off one way, and crowd decides to chase it. Then the chart turns around. This happens often enough that ICT traders gave it a name, the ‘Judas Swing’. Here’s how to mark it, when to watch for it, and why the first spike can be so dangerous.
 Diego FernándezBearish
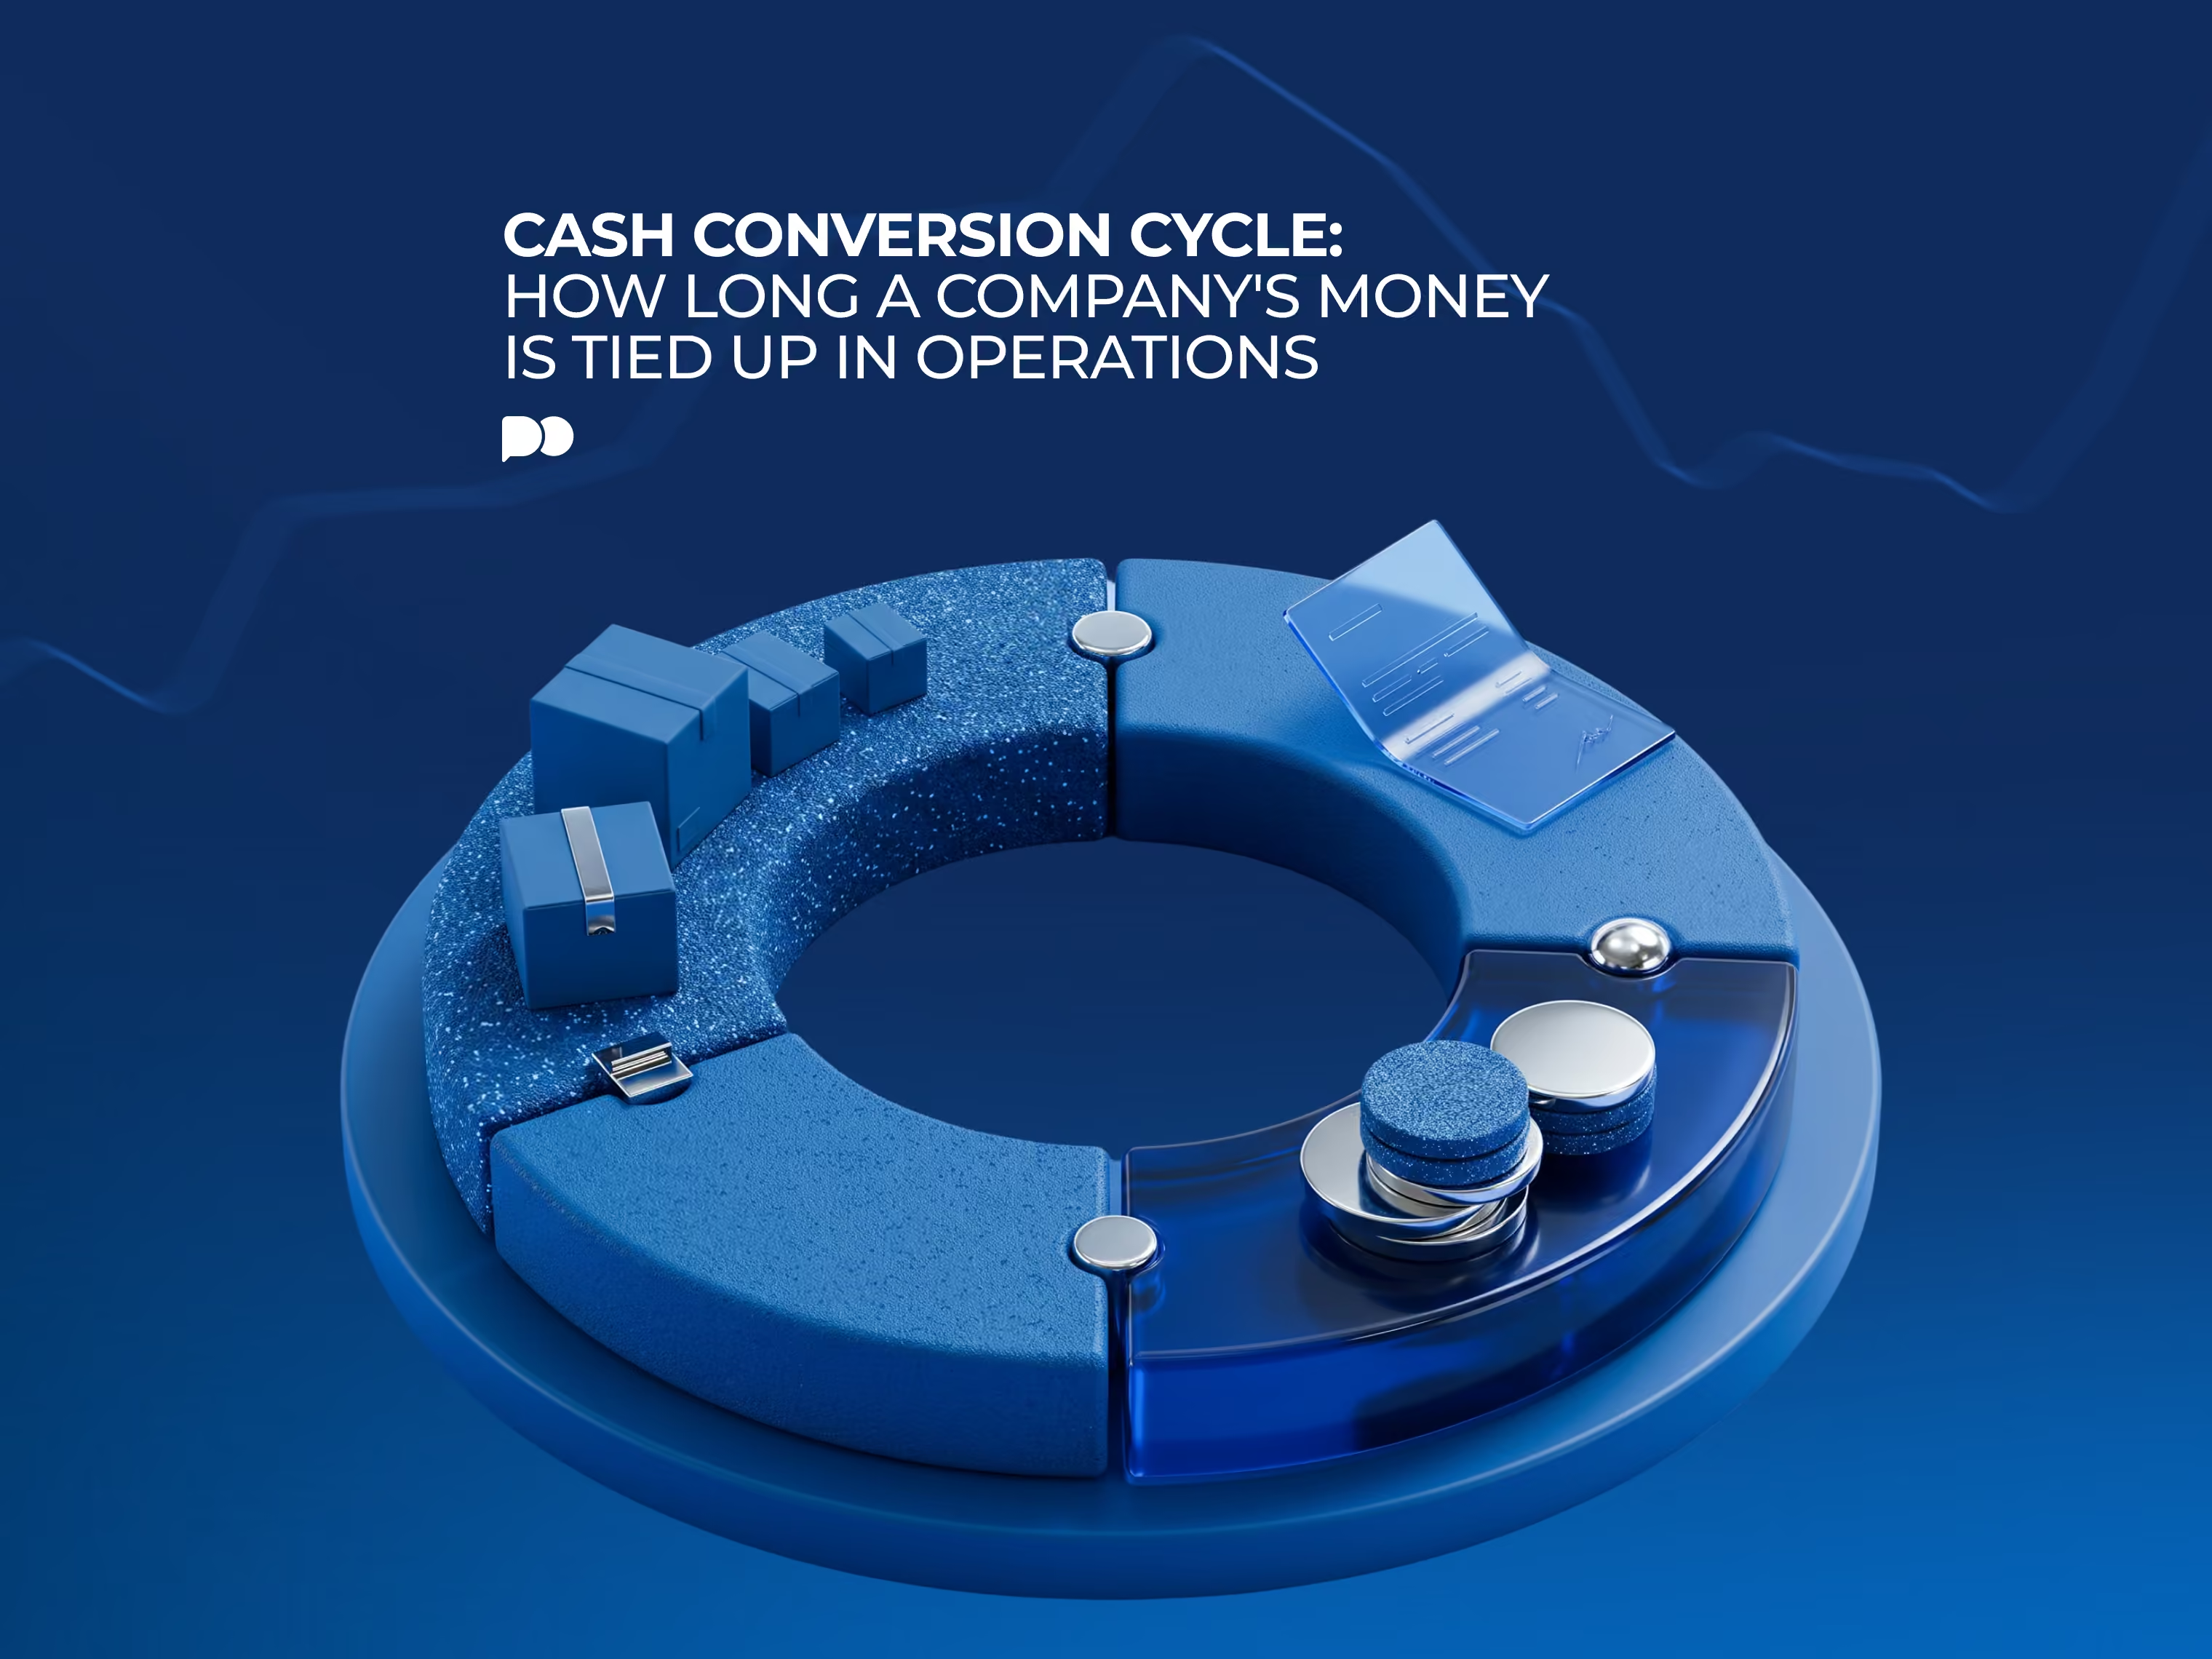
The company purchases materials from its suppliers in March and collects money from its customers in May. Between these two dates, the company doesn't spend money and also doesn't receive it. Instead, it keeps this money inside itself, either as inventory or as an unpaid invoice. This period is known as the cash conversion cycle. This article explains the calculation of this metric, how three changes in operational procedures can influence its value, and why a shorter cycle doesn't always mean that a business is in a better situation.
 Diego FernándezBearish
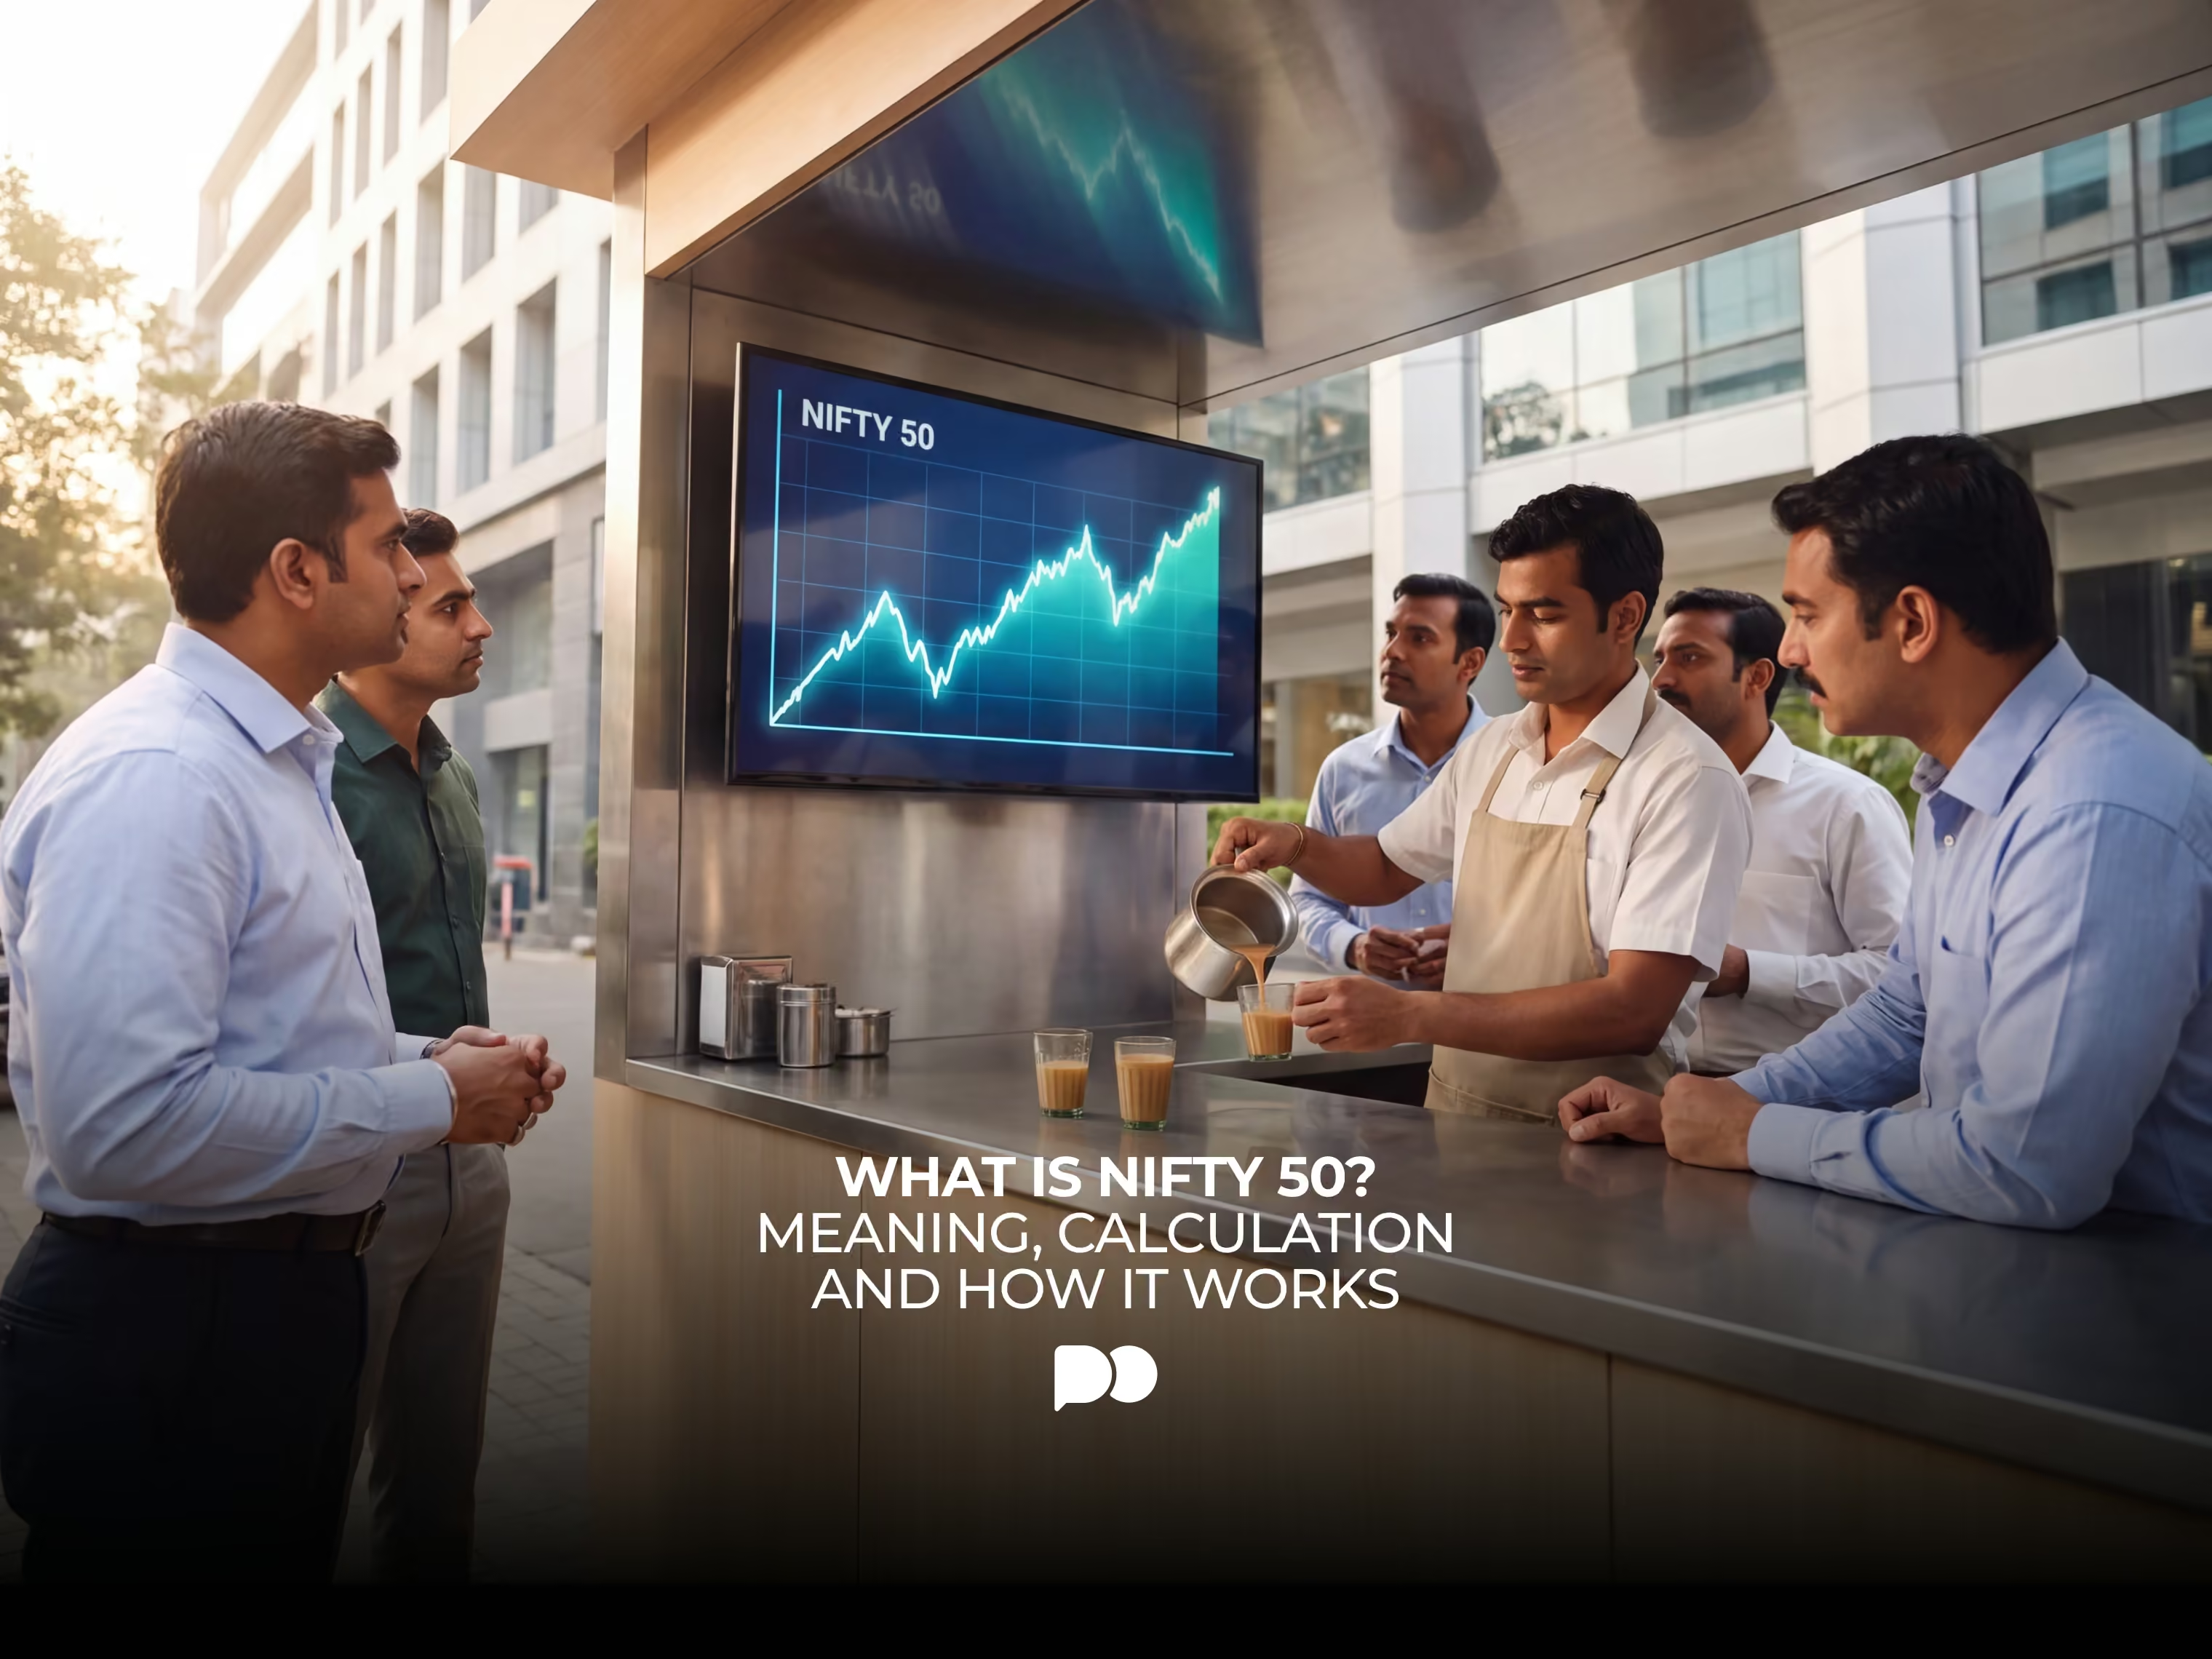
Nifty 50 is NSE Indices' benchmark of 50 large, liquid Indian companies. Here is which companies are in it, how they are selected, how free-float weighting works, what can move it, how it differs from Sensex, and how traders read it without treating it as a signal.
 Diego FernándezBearish
Bank Nifty is NSE's index of the largest, most liquid Indian banking stocks. Here is which banks it holds, how free-float weights are calculated, what can move it, how it differs from NIFTY 50, and how traders read it without treating it as a signal.
 Diego FernándezBearish
India VIX is an index of expected volatility for the Indian stock market, calculated by NSE from NIFTY option prices. Here is how it is built, what high and low readings mean, how it differs from NIFTY 50, what can move it, and how traders read it without treating it as a signal.