Judas Swing: The ICT Fakeout That Traps Traders at Session Open
A session opens, price shoots off one way, and crowd decides to chase it. Then the chart turns around. This happens often enough that ICT traders gave it a name, the ‘Judas Swing’. Here’s how to mark it, when to watch for it, and why the first spike can be so dangerous.

What Is a Judas Swing in Trading?
So what is a Judas Swing in trading? A term out of ICT, the Inner Circle Trader teaching of Michael J. Huddleston, it's for a false move just after a session opens, a push past a nearby high or low that pulls traders in, then a reversal that turns out to be the session's real move, or so the idea runs.
Folks asking what is Judas Swing in trading, or what is Judas Swing in ICT trading specifically, are mostly after the mechanics. These come in three parts, a time window and a level that gets run and a reversal that has to be confirmed. Take one away and what's left is a spike, which happens daily.
It's an interpretation to test, of course. Nobody can see on a chart who pushed price or why, and claims about banks hunting stops on purpose go well past what the data shows.
Why Session-Open Timing Matters
Session opens are when the fresh orders turn up, hungry and in a hurry, some thinking that they know exactly where the market will move, because of the news overnight. Price that was still for hours suddenly has places to be. These are the most common windows for the ICT setup:
Setup | Range to mark (NY time) | Session opening price | Window (NY time) | Window in UTC, winter / summer |
|---|---|---|---|---|
London | Asian range, 20:00 to 00:00 | 00:00 (midnight open) | 02:00 to 05:00 | 07:00 to 10:00 / 06:00 to 09:00 |
New York | Overnight range, 00:00 to 07:00 | 07:00 | 07:00 to 10:00 | 12:00 to 15:00 / 11:00 to 14:00 |
By the way, Pocket Option lets the time zone be set in the account settings, worth doing before marking anything. This guide on how to change the time zone in Pocket Option shows where it sits.
What to Mark Before the Session Opens
Everything gets drawn before the window opens, otherwise it's too easy picking levels that fit what happened.
The Asian range high and the Asian range low for London, or the overnight high and low for New York.
The session opening price, since a Judas Swing tends to start on one side of it and finish on the other.
An obvious prior-day high or low sat close by? Mark that too.
Start and end of the window, as vertical lines.
Why highs and lows? Stop orders are assumed to bunch up just beyond them, though nobody can see those orders on a price chart, they're inferred.
Open a chart and practice.
Get StartedHow a Judas Swing Develops
The Initial Move Beyond a Marked Level
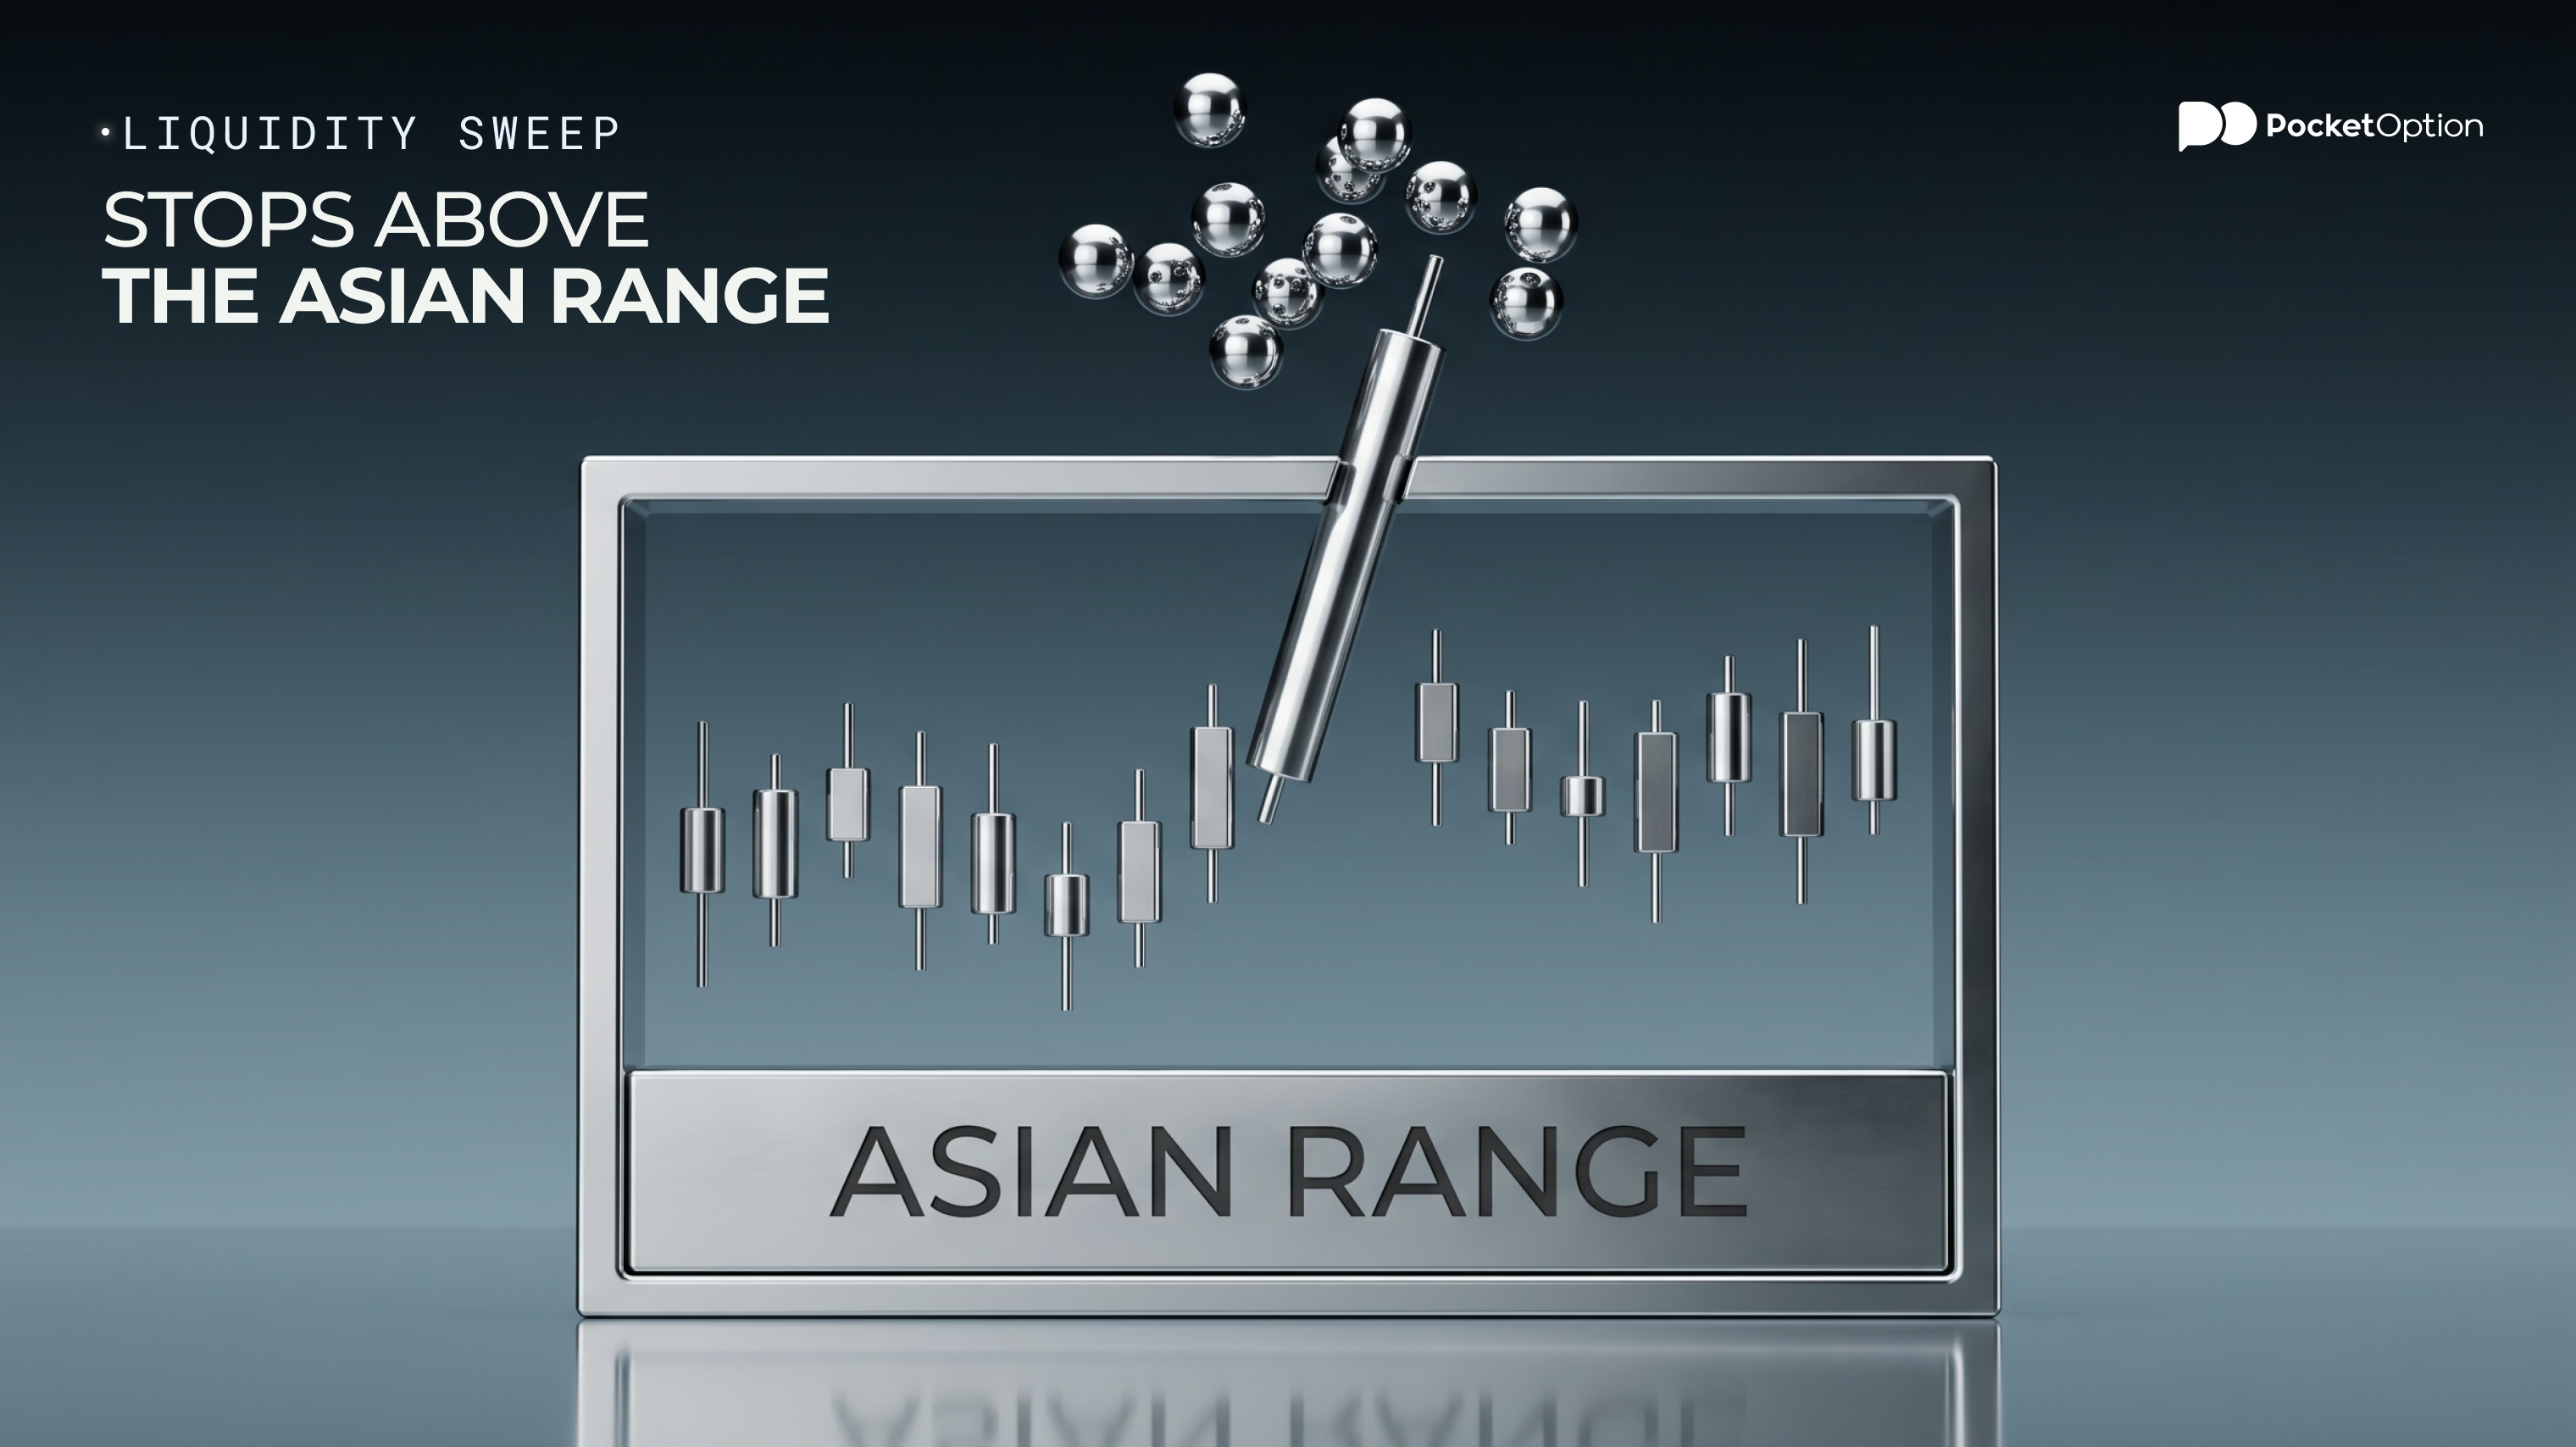
It starts off with a push through a marked level inside the window, above the Asian range high, say. That's the liquidity sweep, price running into where presumed stop clusters sit, short sellers' buy stops and breakout entries mostly, and for a few candles it looks a clean breakout, which is the trap of it.
Failure to Hold the Breakout
Then the push stalls. Candles go small or start wicking, and price slips back toward the line it broke. A failed breakout like that is what the setup gets built on, though at this stage it's only a stall, and stalls turn back into breakouts oftener than anybody would like.
Reversal Back Through Short-Term Structure
Last bit, price falls back inside the range and carries on through the short-term swing formed during the false move, the last higher low on the way up, here. Only then does it look like a reversal and not a pause.
How to Confirm the Reversal Before Considering an Entry
A sweep by itself is not a signal. Price pokes past highs and lows all day and carries on, so reversal confirmation here means two closes, in order, on the chosen time frame, 5 minutes being a common one.
Returning Inside the Marked Range
First a candle has to close back inside the range, not just wick into it. A wick back in, on its own, counts for not much.
A Candle Close Beyond the Relevant Swing
Then a later candle closes past the short-term swing made during the sweep, below the last higher low after a sweep of the high, above the last lower high after a sweep of the low. That close is the reversal confirmation.
Entry Conditions and Setup Invalidation
Put together, a setup only counts when every one of these holds:
The sweep happened inside the observation window.
A candle closed back inside the marked range.
Did a later candle close beyond the short-term swing? It has to.
Stop beyond the sweep extreme, risk fixed before entry.
It's off if price closes back beyond the sweep extreme, or no confirmation shows up by 05:00 for London, 10:00 for New York. Telling a reversal from a pullback is covered in this guide to reversal and pullback trading.
Bullish and Bearish Judas Swing Examples
Figures below are made up for illustration, EUR/USD on a 5-minute chart, not real quotes.
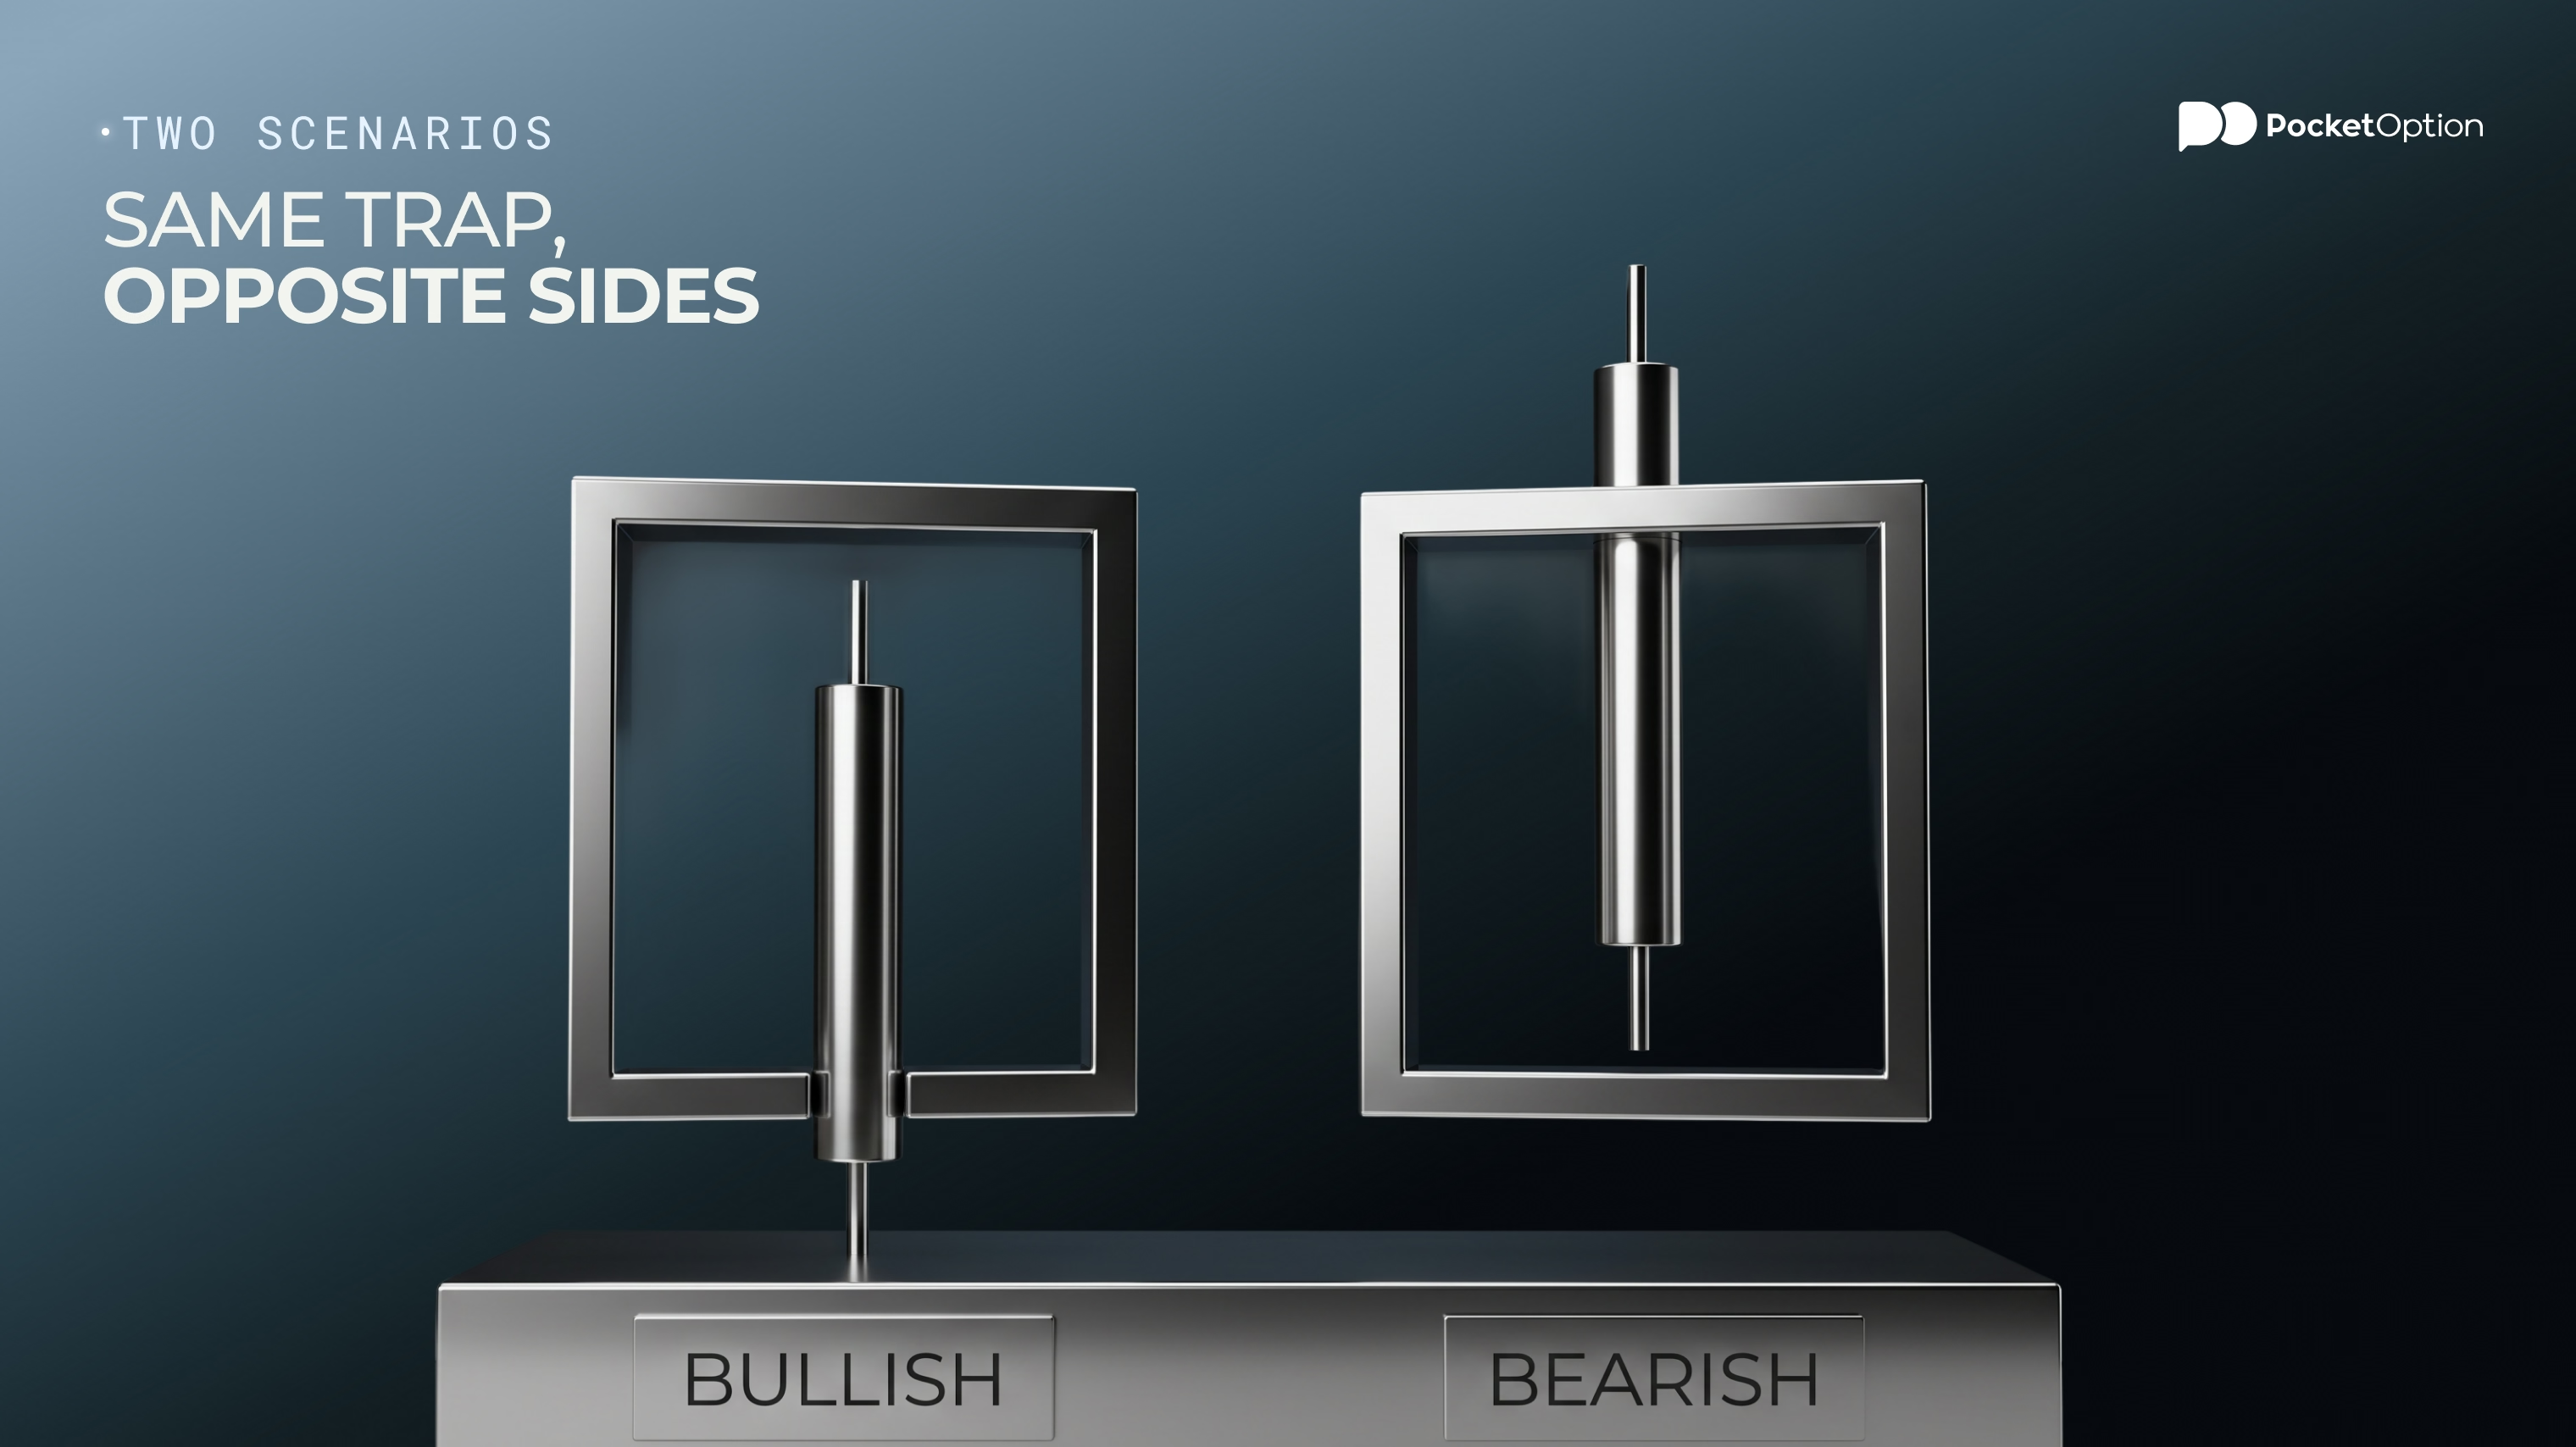
Bullish, London, in winter, so New York is UTC-5. Asian range high 1.0880, Asian range low 1.0840, session opening price at midnight 1.0858. At 02:35 New York time (07:35 UTC) price drops to 1.0831, sweeping under the low, with a lower high at 1.0848 on the way down. A candle closes back inside at 1.0844 at 03:10, and at 03:30 another closes at 1.0851, above that swing. Confirmed. Stop under 1.0831, first objective the range high.
Bearish, New York, summer this one, so UTC-4. Overnight range high 1.0912, low 1.0878, opening price at 07:00 1.0895. US data at 08:30 (12:30 UTC) shoves price to 1.0921, with a higher low at 1.0903 inside the push. At 08:55 a candle closes back under 1.0912, at 09:15 one closes at 1.0899, below 1.0903, stop above 1.0921.
Failed, London again. Price breaks the Asian range high at 02:30, wicks back below it once, but no candle closes back inside and the swing never breaks, and by 04:00 it's 40 pips higher. Anyone who sold the first push got stopped out, the exact case the confirmation rules are there for.
Testing a Judas Swing on a Pocket Option Demo Account
Demo is the place for this, the point being to collect cases, not money:
Make sure you know what is a Judas Swing in trading, which pair you want to trade, do plenty of testing on a demo account.
Set the platform time zone in Settings, and note its offset from New York time.
Pick a live-market pair, such as EUR/USD (so without the OTC label). On a weekday.
Before the window, mark the range high and low and the session opening price.
During it, don't trade the sweep. Note whether both confirmation closes turn up, and when.
If they do, place a small trade, stop beyond the sweep extreme (or amount and expiry fixed beforehand on a fixed-time trade).
Log every session, setups and no-setups. Ideally, London and New York apart.
Thirty sessions per window is about the bare minimum before reading anything into it, and even then the results describe your rules on that stretch of market, nothing more. This guide on backtesting trading strategies covers keeping such a test honest. Losing trades will turn up in the log, as they're supposed to.
Common Judas Swing Mistakes
Trading the sweep itself, instead of waiting on both closes.
Drawing the range after the move, so it happens to fit.
Forgetting the daylight saving shift and watching the wrong hour, for weeks sometimes.
An OTC pair on the chart? Then session timing will seem meaningless, because there it largely is.
Conclusion
A Judas Swing is an ICT reading of the session open. It’s a false push past a marked high or low, that sweeps presumed stop clusters before price turns back. To try to capitalize on it, mark the range and session opening price, and try not to trade the sweep alone. Wait for a close back inside, and then one beyond the short-term swing. The stop-loss is best kept past the sweep extreme. Skip days that bring no confirmation, avoid overtrading.
Practice before any real money is involved
Try DemoDisclaimer: This is for informational purpose only, and does not constitute investments or trading advice. Remember that trading involves risks of capital loss.
See more:Knowledge baseTrading