
What Is India VIX? Meaning and How the Volatility Index Works
India VIX is an index of expected volatility for the Indian stock market, calculated by NSE from NIFTY option prices. Here is how it is built, what high and low readings mean, how it differs from NIFTY 50, what can move it, and how traders read it without treating it as a signal.

The NIFTY barely moved today. Yet one number on the NSE site jumped. Traders call it the fear gauge, which misleads. It measures how big the market expects swings to be over the coming month. Not fear. Not direction.
What Is India VIX?
So what is India VIX, exactly? NSE builds it from the prices of NIFTY options. The result is an index of expected volatility for the Indian stock market. It looks 30 calendar days ahead and is quoted as an annualised percentage.
Notice what's missing. Direction. India VIX says how big moves are expected to be, never which way. A jump isn't a crash alarm. A sleepy reading isn't a rally tip. Ask what is India VIX telling you, and the answer is magnitude, never the sign.
Open a demo account and compare quiet and volatile markets on live charts.
Try Demo AccountVolatility is easier to feel on a chart than in a definition.
Try this. Open a demo account and watch one asset through a quiet week. Then watch it through a week stuffed with news. Compare the candles. That's what is India VIX measuring in the options market: expected swing size, priced in before the swings arrive. No formula needed.
Compare a quiet week and a busy week in demo trading, candle by candle.
How Is India VIX Calculated?
No heavy math here. The India VIX meaning starts with option prices. NSE takes NIFTY options across many strike prices and reads the future swings they imply. Pricey options hint at bigger expected moves. Cheap ones hint at smaller moves. Treat options as insurance: when protection costs more, the index tends to rise.
Need a chart to compare moves? The pocket option tutorial gets one open fast.
The inputs are specific. Strike prices that matter. Bid and ask quotes. Near-term and next-term expiries, blended so the reading always looks 30 days out. NSE handles the blending. If you want the India VIX meaning in one line, it's a 30-day movement expectation squeezed out of option prices. Black-Scholes isn't required.
What Does a High or Low India VIX Mean?
A higher reading means the options market expects bigger swings. A lower one means smaller swings. Both show up in climbing markets and in sliding ones, because the number carries no direction.
So how high is high? No universal cutoff exists. Compare a reading with its own history and with today's backdrop. A level that feels calm in one year can feel jumpy in another. Watch the change too: a leap from a low base says more than a high but steady figure.
India VIX vs NIFTY 50
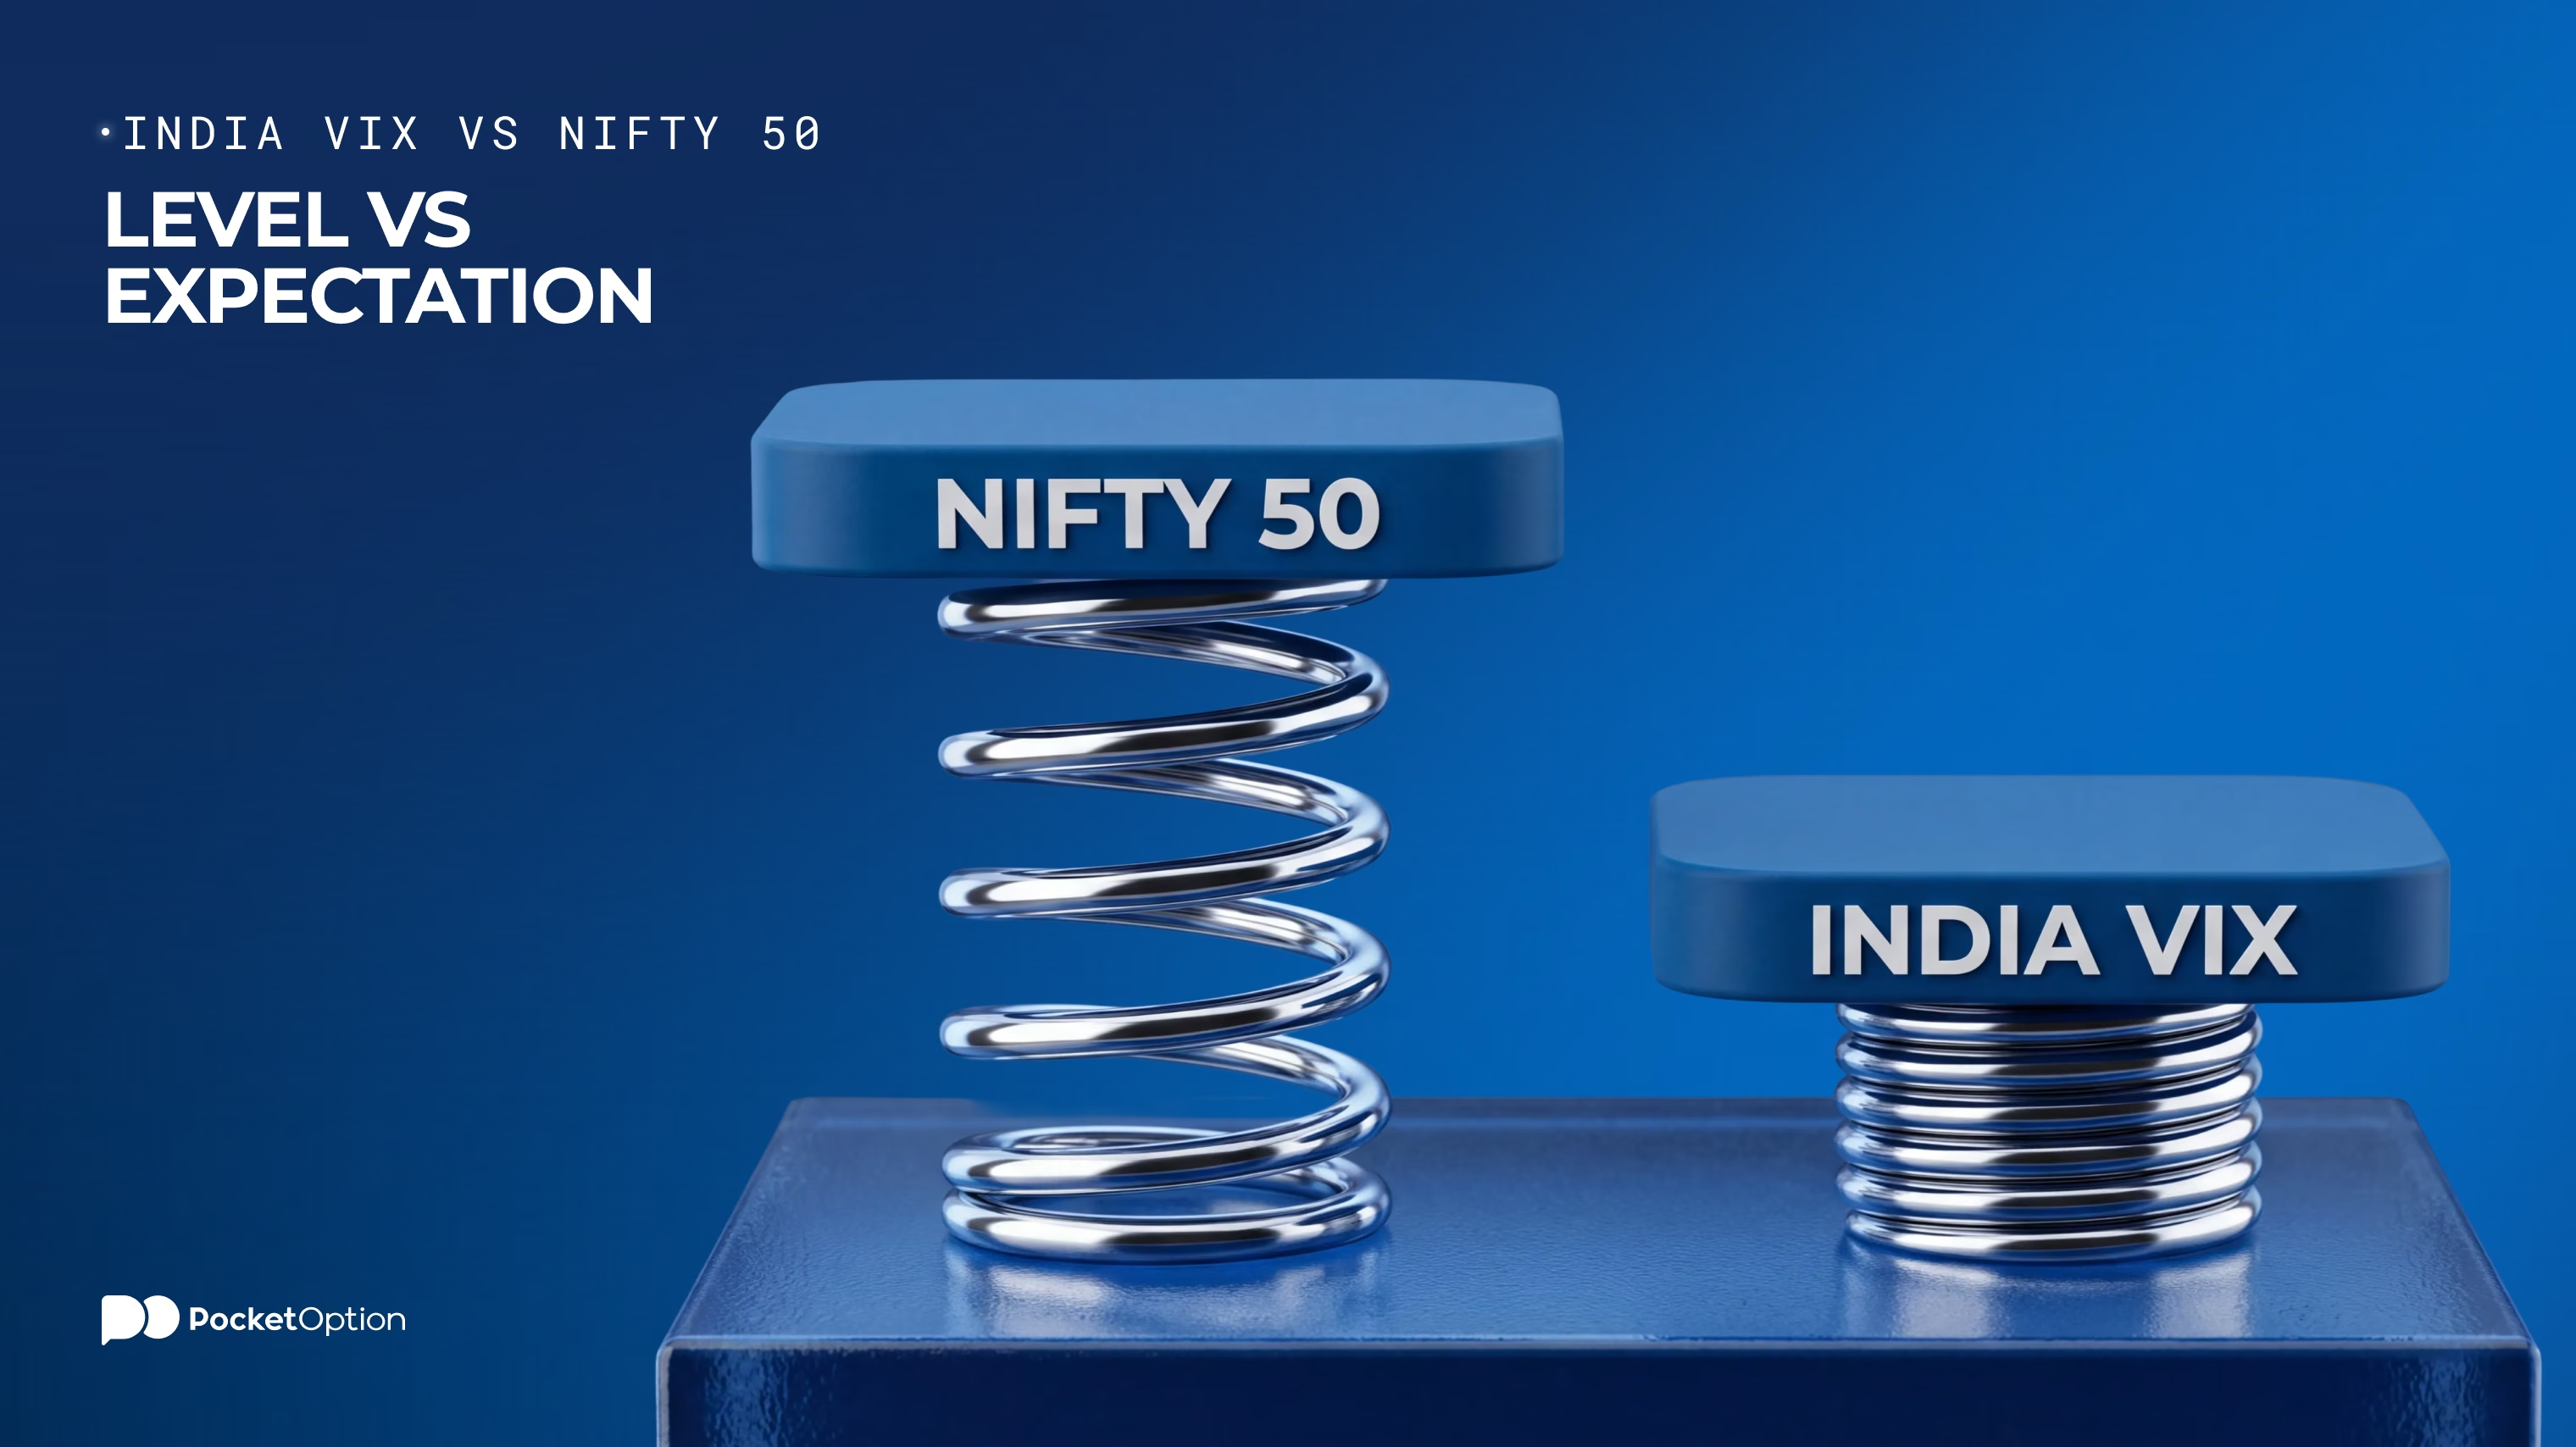
Two different kinds of tool. NIFTY 50 shows where a basket of large Indian stocks stands. India VIX shows how bumpy the next month is expected to be. A level versus an expectation.
Aspect | India VIX | NIFTY 50 |
|---|---|---|
What it measures | Expected volatility, 30 days ahead | Where 50 large Indian stocks collectively stand |
Data source | Prices of NIFTY options | Prices of the underlying stocks |
Direction vs volatility | Gives size, never direction | Gives direction, not size |
Typical interpretation | Higher: bigger swings expected. Lower: smaller | Higher than before: the basket gained. Lower: it lost |
Key limitation | Cannot tell you which way | Cannot tell you how rough the ride may be |
Confusing the two is the classic mistake.
Why India VIX Can Rise or Fall
No single cause drives it. The index follows option-implied expectations, so it moves whenever those expectations move. What can influence it:
How much traders want options, and how those options are priced
A general sense of market uncertainty
Big economic or policy events on the calendar
Earnings season and other event risk
Sharp moves in the market itself
Changes in how much investors want to hedge
Several often act together. One headline seldom explains a whole move. Hedging deserves its own mention: when big investors rush to protect portfolios, option prices can climb, and the index follows, even with the NIFTY standing still.
How Traders Can Interpret India VIX
Treat it as context. It reads uncertainty and expected volatility in Indian equities. Two questions help. Is the reading unusual against recent history? Does it follow the market or fight it? Compare its moves with NIFTY and the wider backdrop. It never works as a buy or sell signal. A rising VIX doesn't promise a falling market, and a falling VIX doesn't promise a rally.
Risk Disclaimer: Trading involves significant risk of capital loss. This article is for educational purposes only and does not constitute financial advice. Always conduct independent research and consider your risk tolerance before making any trading decisions.
See more:GEO