Candle Range Theory Trading Strategy for Entries Within a Reference Candle
Select one completed candle and write its high and low. These two lines define the entire concept. What follows is the process: price pushes through one boundary, fails to maintain the position, returns to the range, and may then move towards the other boundary. The article explains the conditions for each of these points, provides two annotated examples, and dedicates one section to the case where price fails to continue after the return to the range. And that part is usually omitted, although it determines whether the framework is useful or not.

What Is Candle Range Theory?
Candle Range Theory, shortened to CRT, is the technique of arranging what to watch. You select one completed candle as a reference, consider its high and low as the range boundaries and observe how price reacts to them.
To be clear about what it is: a framework for building a scenario based on certain conditions and a defined failure point. It is not a rule proving that price will get to the other side once it has returned to the range, and this article does not make any claims regarding the frequency of it. There are no published studies of the statistics for candle range trading, so treat any exact success rate you see quoted as unsupported.
The reason why these boundaries attract traders' attention is quite simple. The high and low of a recent and visible candle are levels which many traders use for their resting orders and stops, so a move above or below can trigger that activity and then reverse once it is absorbed. The CRT trading strategy describes this behavior with explicit conditions.
How to Select a Reference Candle
It is the most vulnerable part of the framework since it can easily be manipulated after the fact.
Use a completed candle. An unfinished candle does not have its final high or low, and therefore the boundaries can change while you are analyzing them.
Use a rule you can repeat, not just a visual selection: for example, the last completed daily candle. If you cannot formulate the rule in writing, you are selecting by eye.
Use the entire high-to-low range. Both boundaries include the wicks.
Never change the reference candle after you saw what happened next.
The third point is the candle body vs full range distinction. The candle body spans the open and close, while the full range includes the highest and lowest prices reached. Since the premise involves a move above or below the boundary and a rejection, and these movements are reflected as wicks, the reference candle high and the reference candle low must correspond to the wick extremes. If you use the candle body, the boundaries will sit inside the area you are describing.
The fourth point quietly undermines the whole exercise. After a price movement, there is almost always some candle on some timeframe which has its high or low aligned with the reversal. After-the-fact identification of such a candle and its designation as the reference is equivalent to curve-fitting. Decide on a reference before the sequence starts and leave it as it is.
Combining Timeframes for CRT Trading
CRT trading requires two timeframes. The higher one is used to define the range, while the lower one is used to watch the sequence and enter. The boundaries of the higher timeframe range are set once and never changed.
Daily reference candle, observed with 1H or 15M for entry.
4H reference candle, observed with 15M or 5M.
1H reference candle, observed with 5M or 1M.
How many lower timeframe candles that puts inside one reference varies a lot. On a 24-hour market a daily candle holds 24 one-hour candles or 96 fifteen-minute ones, while a 1H reference holds 12 five-minute candles or 60 one-minute ones. There is no target ratio to hit here. What matters is that the lower chart is fine enough for the sweep and the return inside to show up as several separate candles rather than one, and coarse enough that a single close still means something.
One practical trick that catches many traders: daily boundaries are dependent on the server time of your broker. Two trading platforms with different session rollover will have different highs and lows for the daily candle, so the range is not identical for everyone. Make sure that you have the same timestamps on both charts and stick to one platform's clock.
Open a live chart
Get StartedThe CRT Setup Sequence
The entire CRT strategy consists of four points, each with its own conditions which can be checked and not interpreted.
Price Moves Beyond One Range Boundary
Price trades above the reference candle high or below the reference candle low. You decide in advance which one you consider: any trade beyond the level, or a completed candle close beyond the level. The former happens more often but is less reliable; the latter happens less often and later. Stick to the selected point or you won't be able to check your results properly.
The Breakout Fails to Hold
The move above or below the boundary did not get established, meaning that price is not holding outside the range. You need to define the acceptance, for example two or three consecutive closes outside the range on the lower timeframe. If those closes do appear, the scenario is finished and the boundary becomes a level that price trades through rather than rejects.
Price Returns Inside the Reference Range
A lower timeframe candle closes back inside the range, between the two boundaries. Only the close is important here, not a wick that goes above or below and then returns.
This move is the trigger. It also sets the extreme of the initial move above or below as a known level, and thus the setup becomes measurable. There is a specific price that, if exceeded, will tell you that your read was incorrect.
The Opposite Boundary Becomes a Potential Objective
Since price moved back inside, the other boundary becomes the candidate for destination: one side has been swept, the other is still untested.
Candidate is the key term here. It becomes the candidate for destination, not the destination itself. Price can move to it, stall halfway, drift sideways until the setup is irrelevant, or reverse and break the same side it just swept. Considering it as a guaranteed destination is the most common mistake regarding this framework.
Bullish Candle Range Theory Example
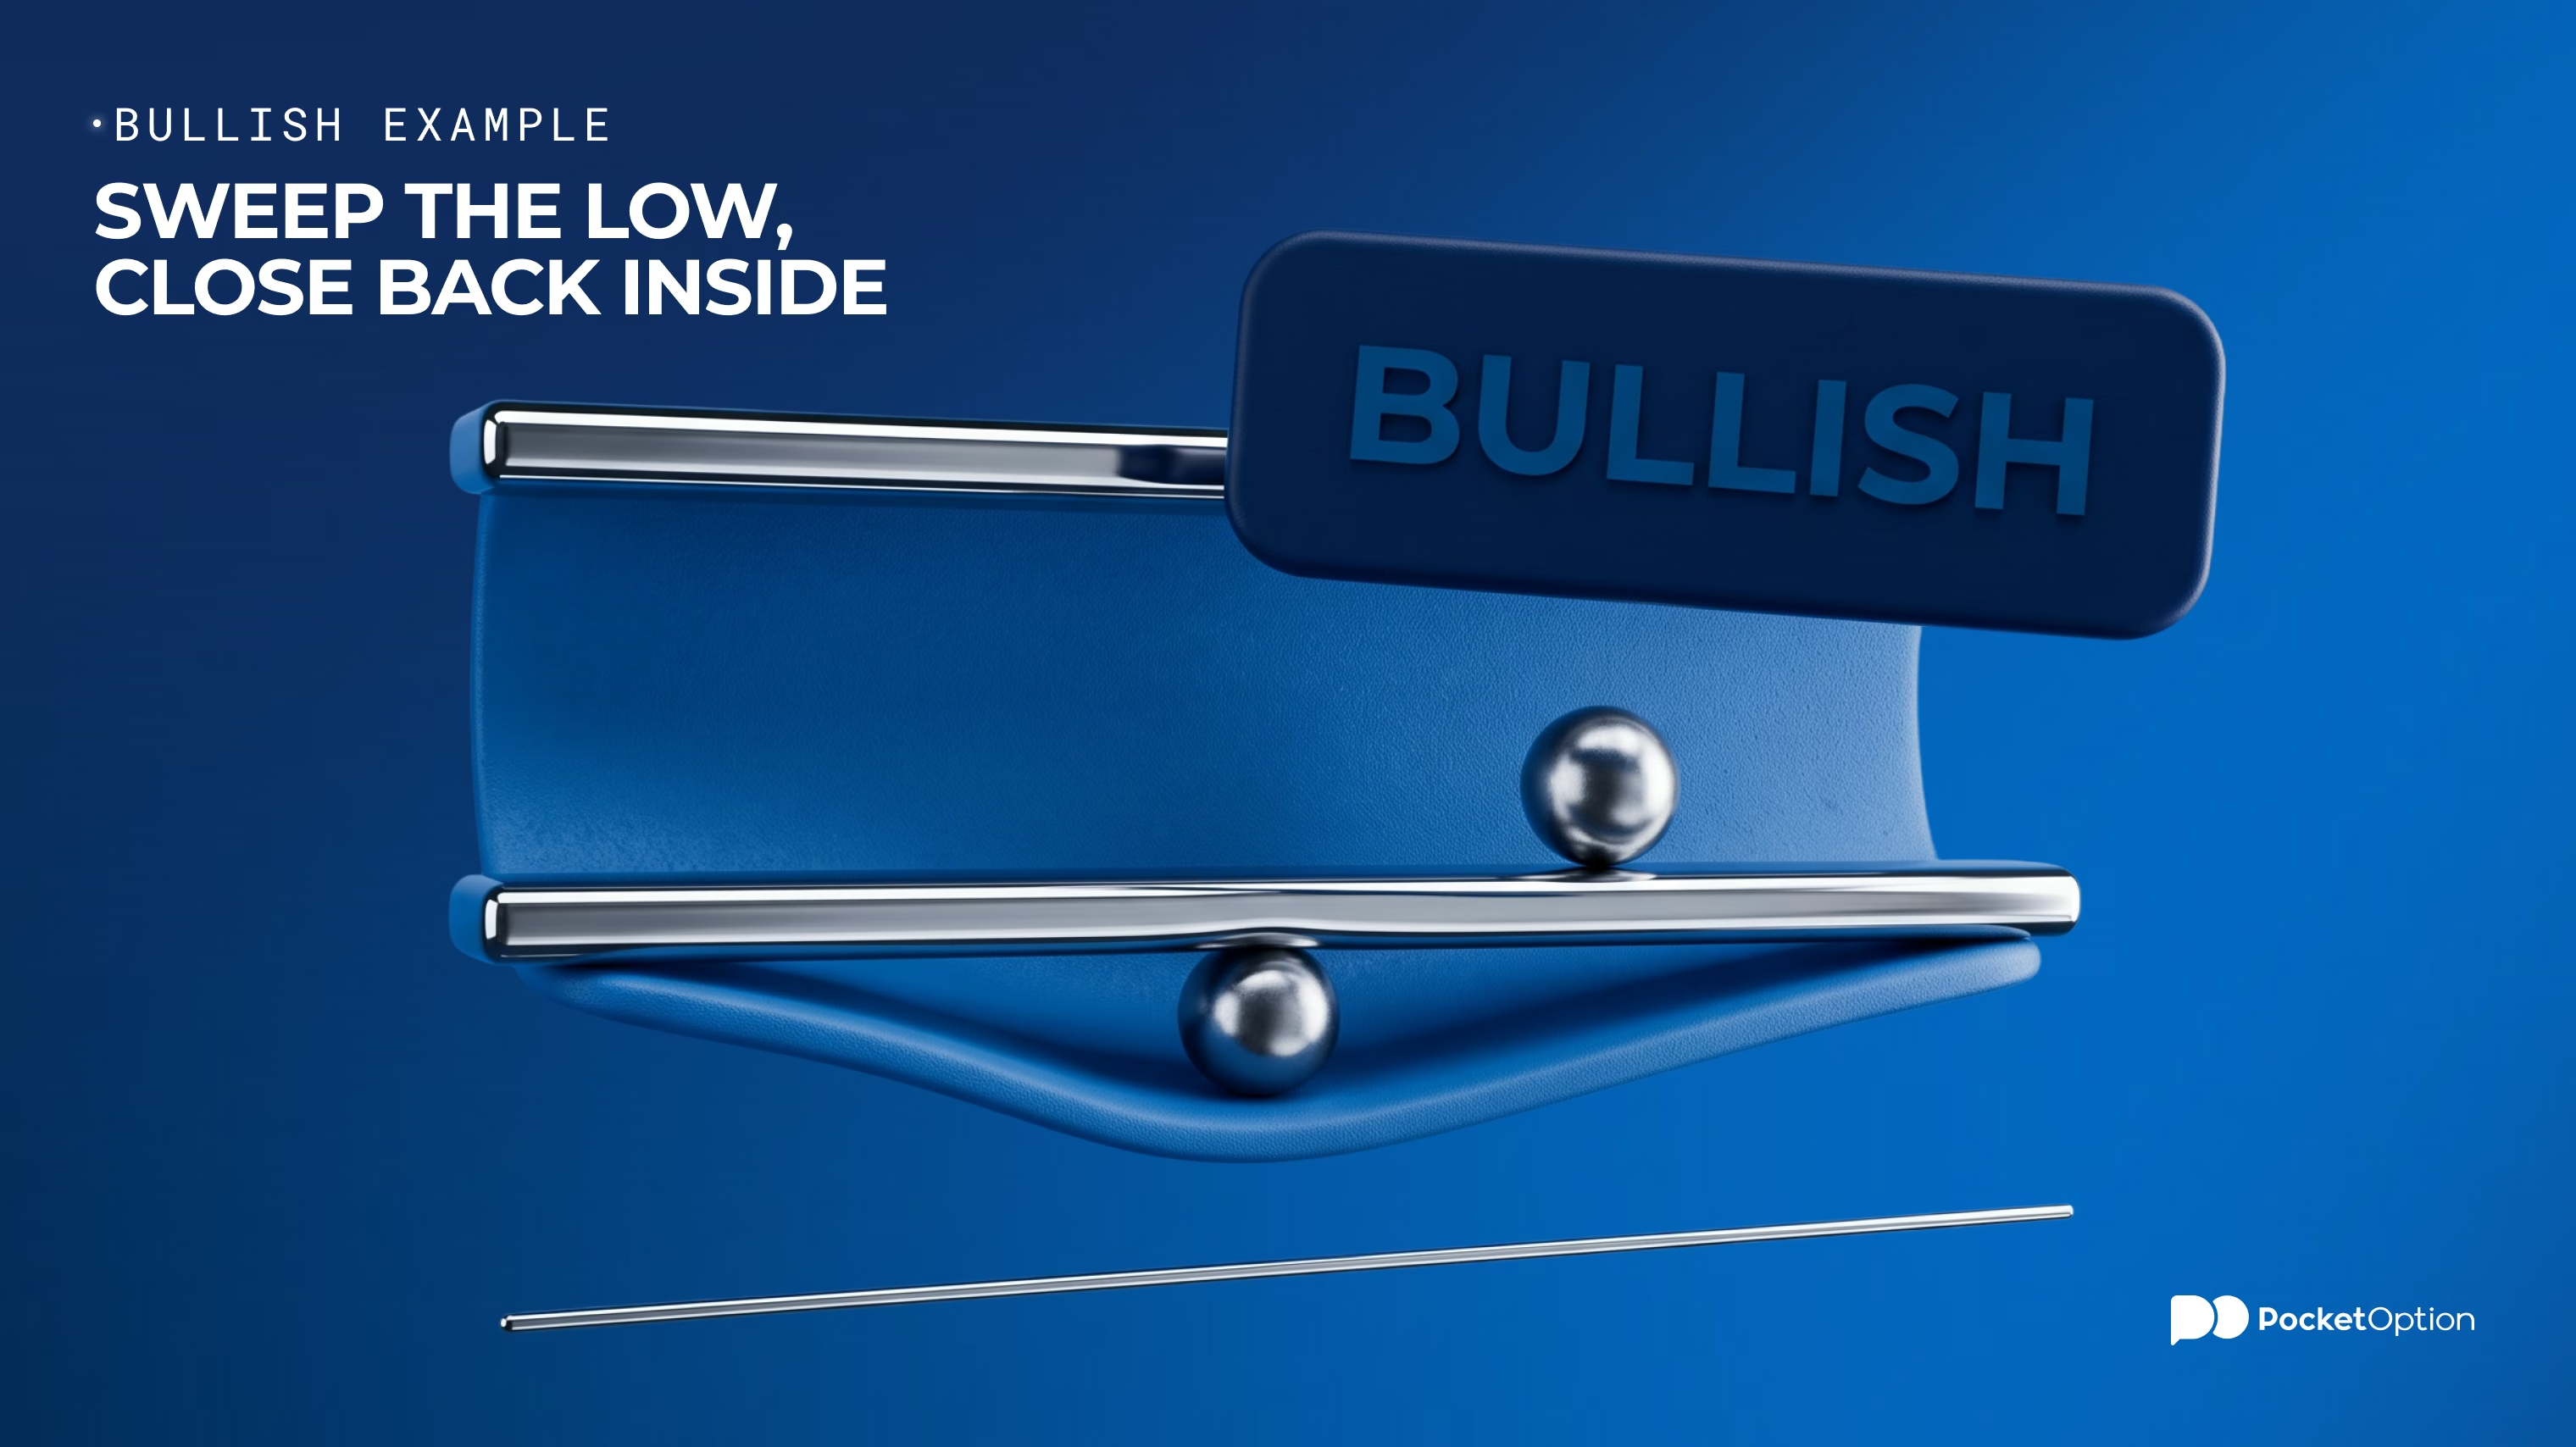
Hypothetical scenario with the invented levels chosen to illustrate the arithmetic rather than describe a real situation. The reference is a completed daily candle, high 1.0850 and low 1.0780, giving 70 pips range. Observation moves to the 15M timeframe.
Price moves down to 1.0768, which is 12 pips below the low. The low has been swept.
There are no consecutive 15M closes below 1.0780, therefore there is no acceptance outside the range.
A 15M candle closes at 1.0792, moving back inside. This is the trigger.
Invalidation is located below 1.0768, which is the extreme of the initial move. The candidate for destination is 1.0850.
From 1.0792 the invalidation is 24 pips away and the destination is 58 pips. About 2.4 to 1 ratio. Both figures are known before the trade, and this is the practical benefit of defining the setup in this way. Will price travel the 58 pips? Nobody knows, and the ratio tells nothing about this probability.
Bearish Candle Range Theory Example
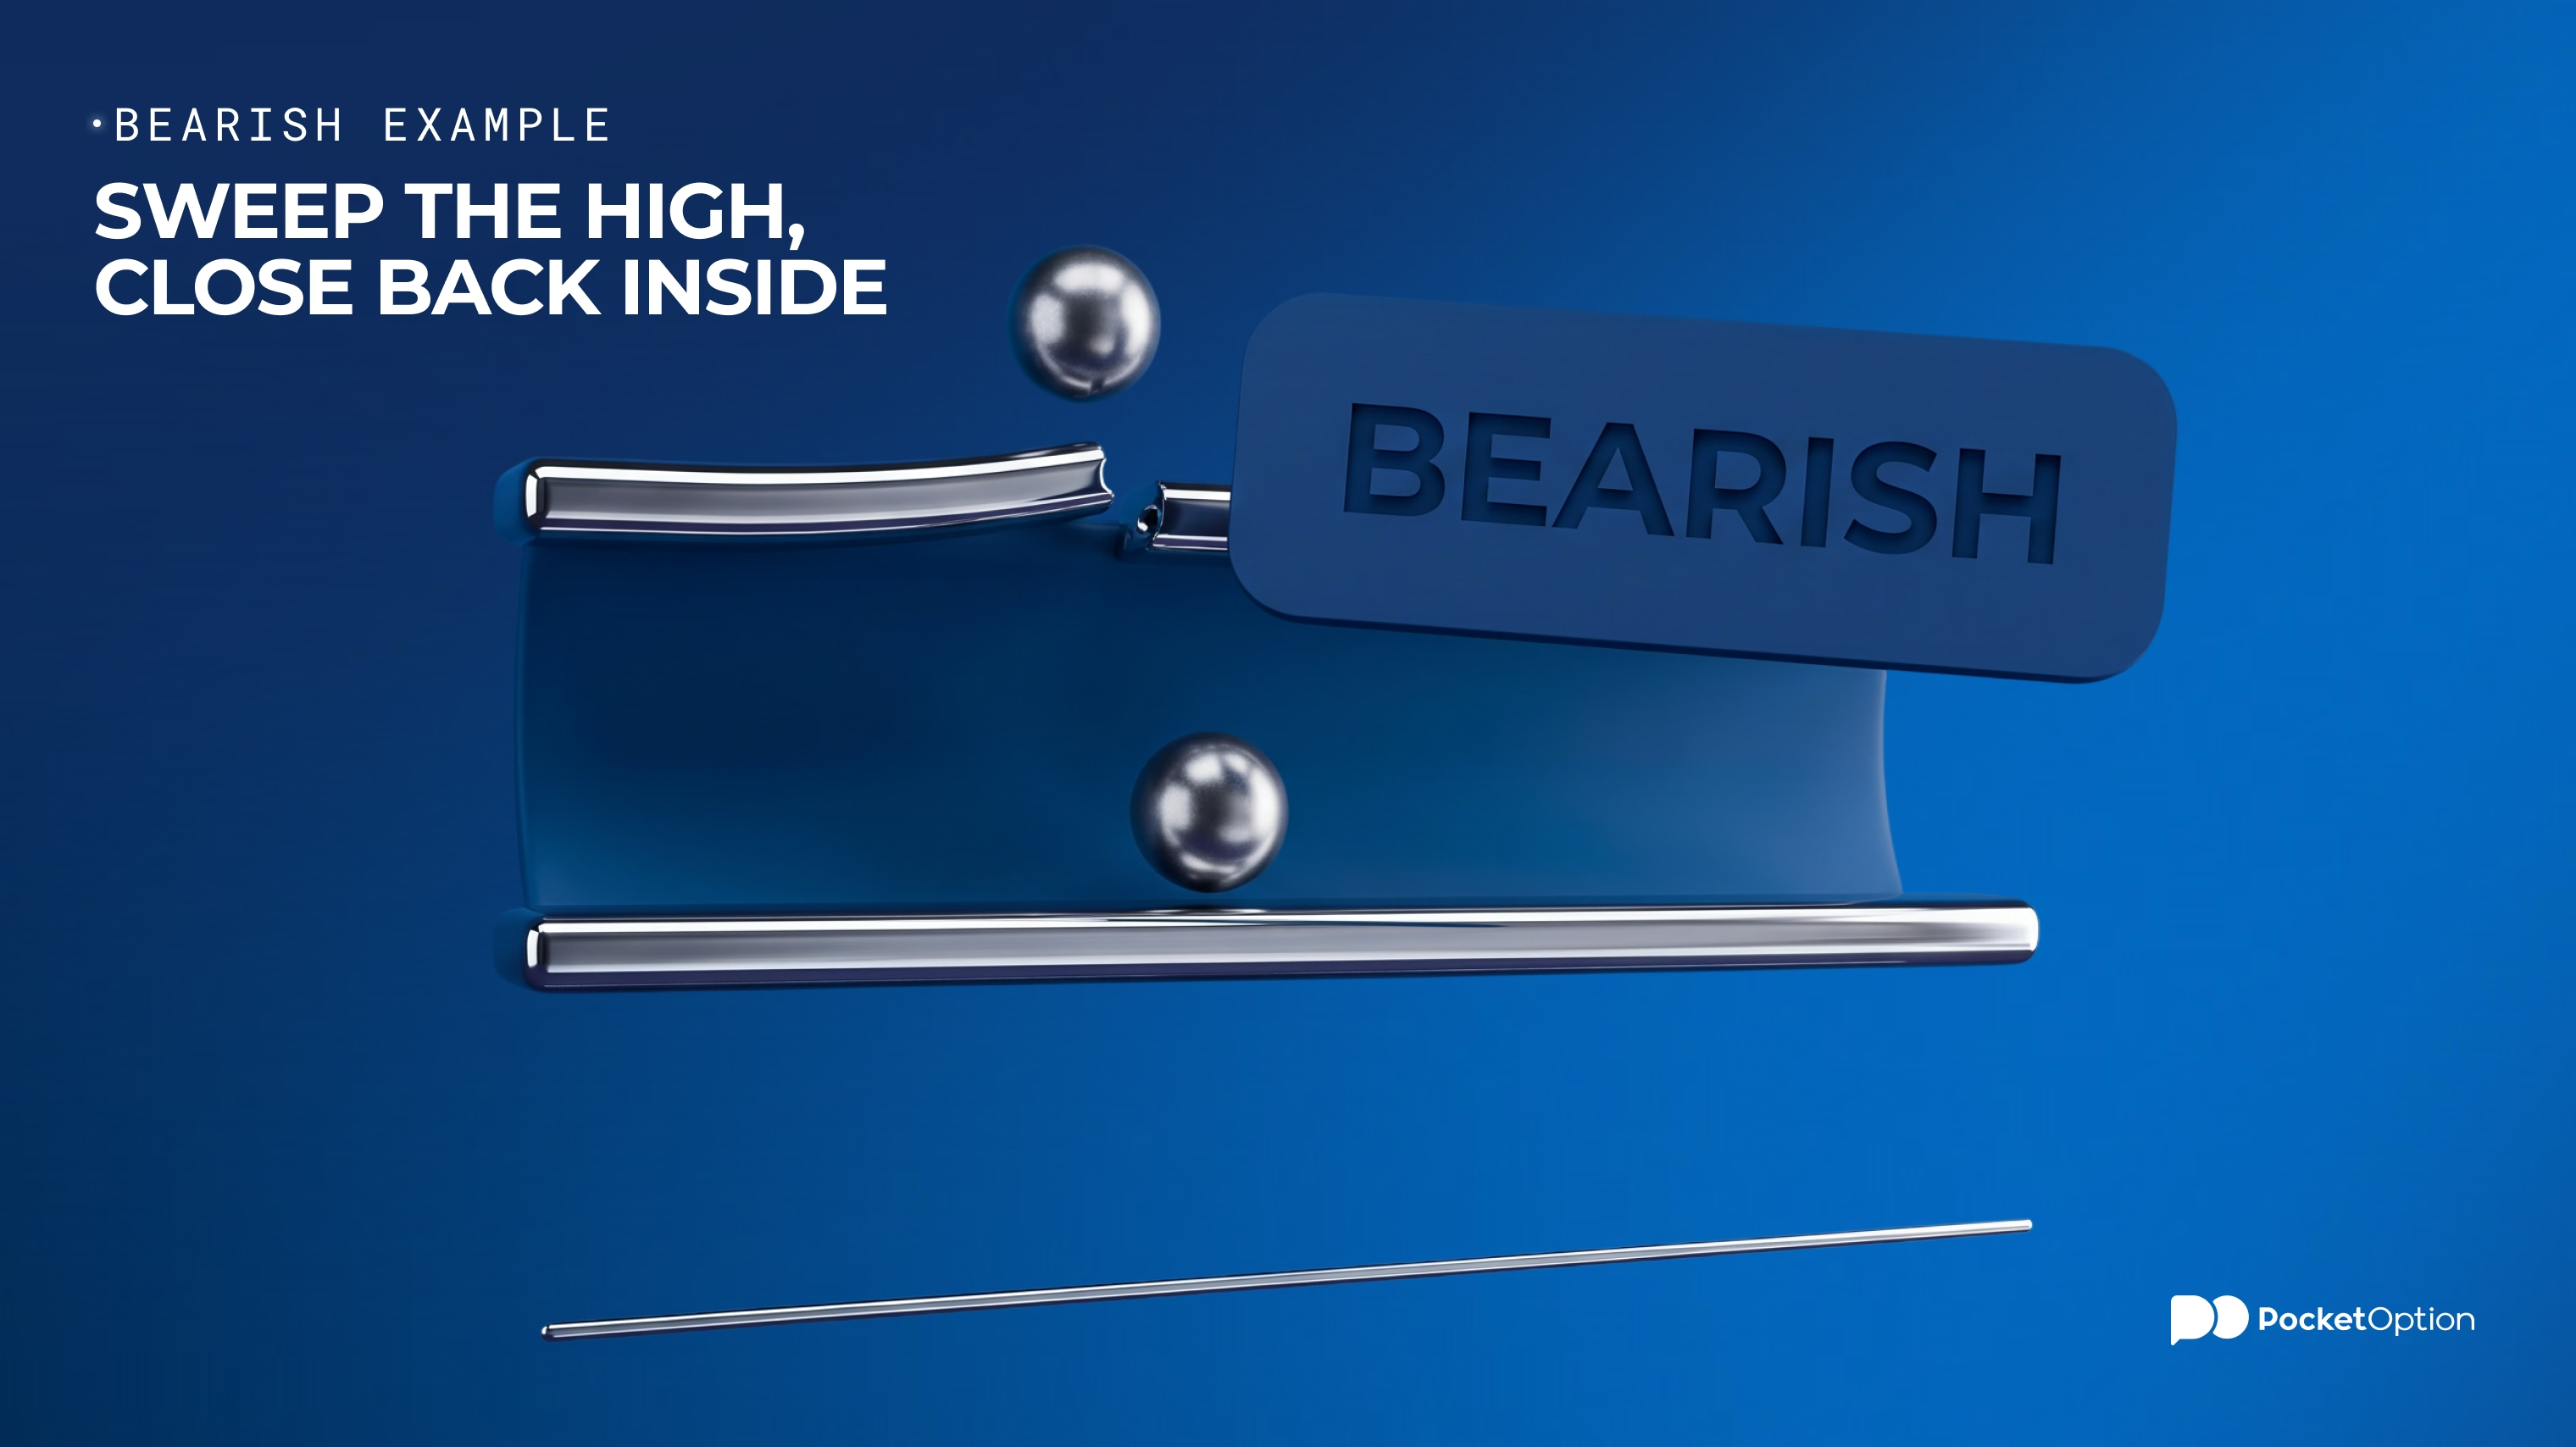
Mirror scenario with the invented levels. The reference is a completed 4H candle, high 1.0915 and low 1.0860, giving 55 pips. The observation moves to the 5M timeframe.
Price moves up to 1.0928, which is about 13 pips above the high.
The move failed to hold and there are no consecutive five-minute closes above 1.0915.
A 5M candle closes at 1.0906, going back inside. This is the trigger.
Invalidation is located above 1.0928, while the candidate for destination is 1.0860.
Thus there are about 22 pips to invalidation and 46 pips to destination, about a 2.1 to 1 ratio. The scenario structure is the same as the bullish setup, just with the opposite direction: one sequence to remember, not two. For more information on how this kind of turn looks in the bigger picture, consult the guide on reversal and pullback trading and how to read swings on charts.
How to Confirm an Entry Inside the Range
Confirmation is a checklist, and all items in it must be true before entering into the trade, not afterwards.
The reference was fixed before the sequence started and is not changing.
The boundary was truly exceeded, according to your definition.
There was no acceptance outside the range according to your number of closes.
The lower timeframe candle closed inside the range. Wicks that go inside do not count as the close.
Invalidation price was determined before entering into the trade, beyond the extreme of the initial move.
Position size is determined by the distance from entry to the invalidation, not by how convincing the setup looks.
If any point is not true, there is no trade, not a smaller one. The confirmation checklist is also helpful for reviewing: if you cannot say which point was true, the result will teach you nothing. A confirmed setup becomes an input for the decision, not the instruction for trading, which is the point made in the article on trade signals and how to use them.
When to Cancel the CRT Scenario
Each scenario needs its expiry date along with the invalidation price, or you hold a view that the chart stopped supporting hours ago.
Acceptance outside the range. The required number of consecutive closes beyond the boundary ends the scenario before entering.
Extreme of the initial move is exceeded after entering into the trade. This serves as the invalidation of the setup, and is determined in advance.
The opposite boundary is broken first. If the price leaves the range on the far side before completing the sequence, the premise is gone.
The time window has expired. Define one, for example the completion of the next reference timeframe candle, and expire the scenario after that.
Scheduled data release interrupts the scenario. High impact data can move price regardless of the range, therefore check the calendar first.
Time-based expiration is the rule many traders ignore, and that is the reason why stale scenarios become losing trades that the rules never endorsed.
When Returning Inside the Range Does Not Work
The return to the range serves as the trigger, not as the guarantee. Here is what else it might produce, and none of these are exceptional situations.
Price does nothing. It moves to the middle of the range and reaches neither boundary until the range loses relevance. This is the most common non-result and the least discussed.
The same boundary is broken again and holds. The initial move was the real move. This is the most common case in strong trends, when the price level is taken, retested from the other side and left behind.
The opposite boundary is reached and surpassed without any reaction. The objective is technically achieved, but anybody who expects a reaction there will be disappointed.
The range is too small to make sense. When the reference candle is narrow compared to current volatility, its boundaries are crossed by normal noise several times per hour.
The reference candle was selected incorrectly. Selected by eye, it doesn't have any special meaning and the price acts accordingly.
There is another trap for the reasoning, worth mentioning. Since every completed candle has its high and low, you can always find one afterward whose boundaries will explain what the price did. These explanations are unfalsifiable: they fit every chart and forecast none. The test is to fix the reference candle and its conditions beforehand and to write down what happens, including the setups that didn't work. A candle range theory strategy must be judged on the basis of logged setups, not on examples you remember, because memory keeps only the good setups.
Try a demo account
Try DemoTesting CRT Rules on a Demo Account
A demo account is useful for determining if you are able to apply the rules consistently. That is a different question from whether the rules work.
First of all, write down the rules: selection, timeframe combination, the definition of beyond, the number of closes required for acceptance, trigger, invalidation, time window.
Choose the instrument and the timeframe combination for the test. Changing one of them in the middle of the test measures two things simultaneously.
Log every setup that meets the rules, including skipped ones and ones that did not work. A log of winners is not a log.
Record the outcome against the rules, not against the result. The important question is if you followed the checklist.
Conduct the review after reaching a certain number of setups, not after a certain period of time, so the number of setups drives the evaluation.
Clearly mark the limits. Demo results do not indicate future results in live trading, because there is nothing to lose and execution changes when money is on the line. Likewise, a few dozen setups on a single instrument cannot validate an advantage of the framework, because the sample is too small. For that task, this guide on backtesting trading strategies and turning raw ideas into tested plans is recommended.
Conclusion
The value of this framework lies in forcing you to state, before anything happens, what you are waiting for and what will prove you wrong.
Thus the consistency lies in the setup and not in the signal. Fix the reference candle with a written rule and use the entire range, including the wicks. Define beyond, acceptance and the trigger close, and keep them stable. Set the invalidation beyond the extreme of the initial move, along with the time window. Then treat the other boundary as a possible destination, not as a must, and log the setups that did not reach it, because they show you the true value of the framework.
Disclaimer: This article is provided for informational and educational purposes only and does not constitute investment advice or a recommendation to use any particular trading approach. The price levels and sequences described are hypothetical and chosen to illustrate the structure, not records of real market movements. Candle Range Theory is an informal framework with no published statistical validation, and nothing here should be read as a claim that it yields profits or a specific success rate. Past price behavior does not predict future price behavior. Trading involves a significant risk of capital loss and may not be suitable for all investors, and results obtained on a demo account do not indicate future results in live trading.
See more:InterestingTrading Strategies