Option Trading Indicators: The Secret Tools Every Trader Needs
An indicator alone can never predict the price movement. But it can describe the price behavior so far, providing you with just one line or number so you don't judge the whole chart visually. So the question is not which indicator is the best one, but which question you are trying to ask when you pick it. Choosing indicators for option trading means picking tools that answer different questions, and you have four groups to draw from. This article describes all of them, shows you how to combine them without redundancy, and is straight with you about how a strategy built for classic options behaves differently on Quick Trading at Pocket Option.

What Are Option Trading Indicators
Option trading indicators are calculations made with the help of the price data, and sometimes the volume data as well. A moving average is a typical example, a calculation of an average of recent closes. An indicator reduces a huge amount of information on the price chart into a readable number.
What is essential to remember when you use indicators?
They are descriptive rather than predictive. Each indicator is based on the price action that happened before;
They lag by their nature. A 20-period average needs at least 20 periods. And lag is the cost of reducing noise.
It doesn't make them useless but simply reminds you that the indicator is a summarizing tool you consult, not a signal you obey.
Why Technical Indicators Matter for Option Trading
When you trade stocks, you can afford to be early and still be right because you can buy, hold and wait. Any option trading is limited by time. Thus any option trade is a trade where not only being right about the direction is important but the timing of your move as well.
That's why technical indicators for option trading are used in pairs, one indicator for the direction and one for the timing of the entry. Neither of them eliminates the element of uncertainty, and even a well-thought-out setup loses regularly. The goal is to make the losses the kind you planned for.
Trend Indicators: Moving Averages, ADX, Ichimoku
The questions these indicators answer: in which direction is the market going and how strong is this movement?
Moving averages. The average of recent closes, displayed as a line. Simple averages consider each period equally, and exponential averages give more weight to recent periods, reacting faster. The most common lengths are 20, 50 and 200, and a long moving average serves as a direction filter in most cases.
ADX. The indicator of the strength of the trend in the range of 0 to 100, where the most usual period is 14. Values above roughly 25 indicate a trending market, whereas values around 20 or below indicate a ranging market. The thing to note is that ADX doesn't show the direction, as both a strong uptrend and a strong downtrend can result in a high value.
Ichimoku. Five lines with a shaded cloud, calculated with the help of 9, 26, and 52 periods and representing trend direction along with support and resistance.
To learn how to analyze the strength of the trend with the ADX indicator, read this article on ADX indicator strategies and trading with trend strength.
Momentum Indicators: RSI, Stochastic, MACD
The questions these indicators answer: how fast is the price moving, and is the move stretched?
RSI. The comparison of recent gains and losses on the scale from 0 to 100, where the most common period is 14 and the most common levels are 70 and 30.
Stochastic. Shows where the close is in the recent price range with the parameters 14, 3, and 3. The crossovers of the two lines are often used as triggers.
MACD. The difference between a 12-period and a 26-period exponential moving average with a 9-period signal line. While it shows momentum, it consists of two trend tools.
One common correction, which can cost beginners dearly: RSI higher than 70 doesn't mean the price will reverse soon. It means that recent gains outpace recent losses significantly, meaning a strong uptrend. The price can stay above 70 on RSI for several weeks while continuing to climb. Treat an extreme reading as a description of what just happened, never a promise of a reversal.
Divergence of the price and momentum is a separate topic discussed in this guide to bullish and bearish divergence and how to use RSI signals on charts.
Volatility Indicators: Bollinger Bands, ATR, Keltner Channels
The questions these indicators answer: how much price action should you expect?
Bollinger Bands. 20-period moving average with the bands at two standard deviations above and below it. They widen with an increase in activity and narrow in case of slowing down.
ATR. Average True Range, usually measured for 14 periods and reflecting the average movement per period in price units. It has no directional bias, and it is helpful in sizing positions and defining stops but not in entering trades.
Keltner Channels. A 20-period exponential average with the bands at a multiple of ATR away. As the bands are ATR-based, not standard deviation-based, they react to the move differently from Bollinger Bands.
A common mistake is thinking that a touch of the outer bands is a signal to sell. Prices can run with a trend along the band for a long period of time. The bands simply describe recent action.
Volume Indicators: OBV and Accumulation/Distribution
The questions these indicators answer: is the price action supported by participation?
On-Balance Volume (OBV). A cumulative total, adding the period's volume if it is an up-close and subtracting the volume if it is a down-close, based on the logic that the total should match the trend.
Accumulation/Distribution (A/D). The similar logic but with each period weighted by its close position in the price range: a close near the high counts more than a close in the middle of the period.
And here is the information, usually omitted in other articles, which is crucial for trading currency pairs. There is no central exchange for spot forex, which means there is no one true record of how much was traded. The tick volume shown on the chart represents the number of price updates during the period, not the contracts traded. It's a reasonable approximation of the activity, but not the same thing as volume in stocks, so interpret the OBV line on a currency pair chart with this in mind.
How to Combine Indicators for Better Signals
The idea is simple but often overlooked: use indicators that answer different questions.
RSI, Stochastic, and MACD are all momentum indicators. Putting them all on the chart doesn't build confirmation. You've just asked the same question three times and gotten three answers of the same kind. In case they coincide, you gain almost nothing, and in case they don't, you have no solution.
A better combination includes one tool from each category you need:
one trend indicator to define the direction and exclude the opposite trades;
one momentum indicator to find the right time to enter the trade;
optionally, one volatility indicator to size the position and determine sensible distances.
Two or three is a realistic number. Beyond that the conditions rarely all line up, and by the time they do, the move is already taking place. See how to treat any tool as an input rather than an instruction in this article on trade signals and how to use them.
Open a free chart
Get StartedA Practical Example: Moving Average and RSI Strategy

A worked example on the daily chart, with the terminology explained in clear terms. Levels are only for illustration.
Direction filter. The price is trading above its 200-period simple moving average, so you only consider the bullish setups. Below it, you only consider bearish ones.
Entry trigger. RSI(14) falls below 30 and then returns above 30. This means a pullback in the trend, not a prediction of the low.
Invalidation. The price closes lower than the low of the pullback, defined before you enter.
Exit reference. The price closes above its five-period average, or RSI reaches the upper reference level.
And now the point where the terminology goes wrong most often. In case of classic exchange-traded options, a bullish view is expressed by buying a call, which is the right to buy at a set strike price, or by selling a put. A bearish view means buying a put, which is the right to sell at the strike, or selling a call. Note that buying an option and selling one are not mirror images: the buyer holds a right, while the seller takes on an obligation if the option is exercised.
However, classic options are not pure directional bets. Their price reflects not only where the underlying sits against the strike, but also the time left until expiry and market expectations about how volatile it is going to be. Even if you're completely right about the direction, you can lose money because the price action arrived too slowly and time decay eroded the premium, or because the expected volatility fell after you entered.
Another point in translating this strategy is its structure. The exit above is conditional, waiting for either a moving average crossover or an RSI level. A trade with a fixed settlement time has no conditional exit because it closes regardless of the chart action once the predetermined time is over. Thus you cannot use this strategy without changes. You need to decide in advance how long the move should take, translate that into a duration and check whether it works, which makes it a different strategy you need to test separately.
Classic Options vs Quick Trading on Pocket Option
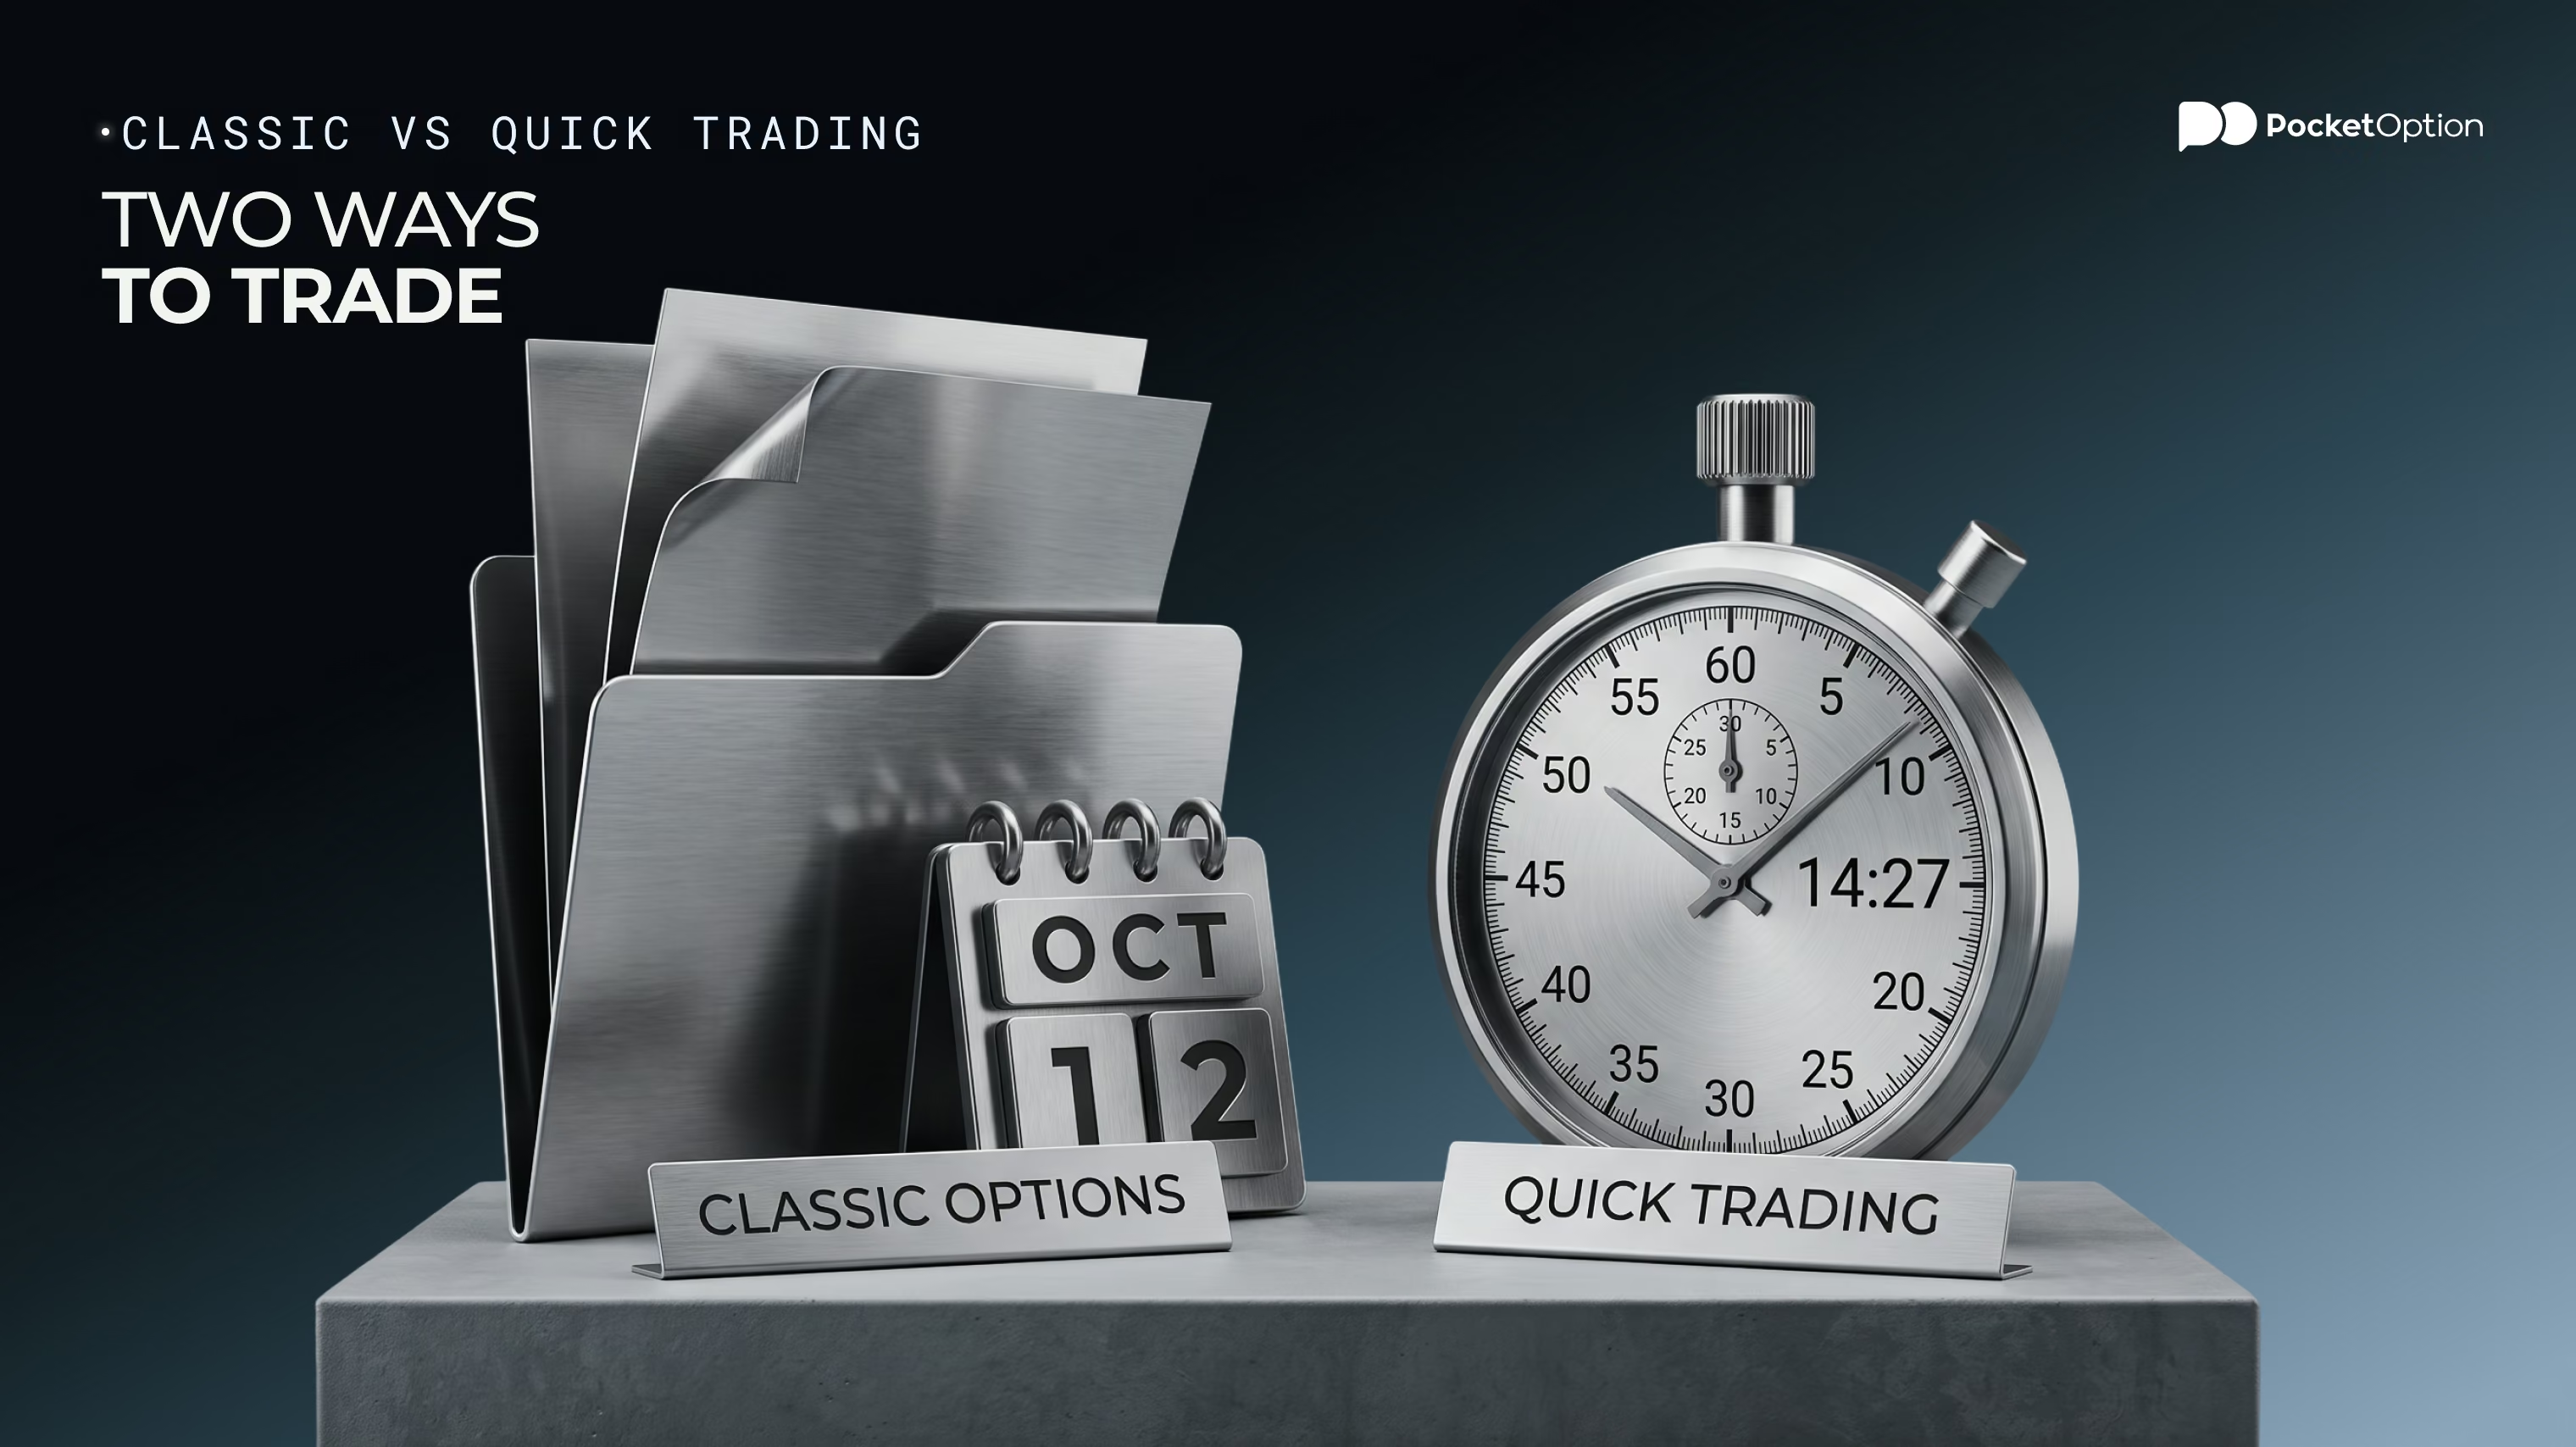
Pocket Option offers Quick Trading, where you forecast an asset's direction over a period you define yourself. It is not classic options, and that changes the way any given strategy works.
Classic options | Quick Trading | |
|---|---|---|
What you choose | Direction, strike price and expiry date | Direction and duration |
What you pay | A premium changing according to the market | A stake defined by you |
What drives the result | Price, time left till expiry and expected volatility | Price level at settlement compared to the entry |
When it settles | At the expiry time, or earlier at the prevailing premium | At the time you chose before opening the trade |
Maximum loss | The premium of the option you've bought | The stake |
Possible profit | Depends how far the price moves past the strike | A percentage agreed before the trade |
The technical analysis stays the same: the trend is the trend and an oversold reading is an oversold reading regardless of the instrument you apply it to. What doesn't translate into Quick Trading is the trade structure, and that is why strategies often get transferred wrongly.
Using Indicators on Pocket Option: Step by Step
Pocket Option provides its users with more than 30 built-in indicators, so setting up takes only minutes.
Open the chart of your asset and choose the timeframe first, since all readings depend on it.
Open the indicators panel from the chart toolbar and choose the indicator from the library.
Set the period consciously rather than staying with the default value. For instance, a 14-period RSI on a one-minute chart is a different story from the daily one.
Choose your second indicator from a different category, not a second momentum one.
Don't go beyond two or three indicators. In case your chart becomes difficult to read, you've got too many.
Save the layout if the platform allows it, so you can test your setup consistently.
Try a demo account
Try DemoCommon Mistakes When Using Indicators for Options
Most mistakes related to indicators are not about choosing the wrong one. They are about asking the impossible.
Stacking several indicators that agree by design. Three momentum indicators give you one opinion with extra lines.
Interpreting overbought as a reversal. The extreme reading means a strong move, and strong moves tend to continue.
Tuning the settings to fit the past. Any indicator can be tuned to fit history, and the tuning rarely works with new data.
Ignoring the time factor. In a timed trade, being right about the direction and being late is still a loss, so duration is an additional factor in the decision.
Thinking that tick volume on forex equals volume. It shows the activity, not the size.
Trading without a limit of losses per position. No matter how good your indicators are, you need to define your risks in advance.
Conclusion
Choose your indicators according to the question you need to answer, not according to their reputation. Trend indicators show you the direction, momentum indicators provide you with the timing of the entry, volatility indicators show you the expected distance, and volume indicators show the participation.
Remember two things. All readings are derived from the price action that has already happened, so they do not predict anything, and the readings that look most confident at the extremes are the easiest to misread. And a fixed settlement time makes the duration part of the decision in a way it never is when you can simply hold and wait. Losses come whatever the quality of your setup, and that is why it is a good idea to test your combination on a demo account first.
Disclaimer: This article is provided for informational and educational purposes only and does not constitute investment advice or a recommendation to use any particular indicator or strategy. The settings and examples provided are illustrative and not the records of real trades. Trading involves a high level of risk and may not be suitable for all investors, and results achieved on a demo account do not indicate future results in live trading. The features of the platform and tools may vary.
See more:InterestingTrading Strategies