ADX Indicator Strategies: Day Trading with Trend Strength
Most of the technical indicators show the trend direction. ADX provides information which is more helpful than just pointing to the trend. It shows whether the market has confidence to move at all. Trading in a strong trend with confident momentum is a different game from trading in a noisy range. And ADX helps traders to see it clearly. This article will provide guidelines on how to use ADX indicator for trading on Pocket Option: it will explain what the ADX numbers mean, how the directional lines work, and it will introduce you into creating your own basic ADX indicator strategy to test on a demo account.

What Is the ADX Indicator
Average Directional Index (ADX) is an indicator created by J. Welles Wilder Jr. in 1978, same inventor as RSI. ADX is showing the strength of the trend on the scale from 0 to 100. ADX does not show if the trend is going up or down. This task is done by its companions, the directional lines: +DI and -DI which appear together with ADX.
The trio forms the Directional Movement System where ADX is asking "how strong is the trend?", while the other two lines are answering "which force is in control of this movement, buyers or sellers?" Understanding what each line works on is crucial to understand how to read ADX indicator correctly.
How Is ADX Calculated
ADX indicator formula calculation includes several steps. First of all, True Range and Directional Movement (+DM and -DM) are calculated for every period. Then, these numbers are smoothed, usually for 14 periods, and they become the basis for calculating +DI and -DI. ADX is then calculated as a smoothed moving average of the absolute value of the difference between +DI and -DI divided by their sum.
There is no need to calculate all these numbers manually as the trading platform takes care of that. How ADX is calculated matters primarily for understanding why the indicator lags: the multiple smoothing steps mean ADX confirms trends after they have begun, not before.
How to Read the ADX Indicator on a Chart
ADX appears as one line (or three if +DI and -DI lines are displayed) below the price chart. ADX oscillates between 0 and 100 but spends most of the time below 10 and 50 levels. Level readings above 50 are rare but signal very strong trends.
The value and direction of the ADX line have equal importance. The upward movement of the ADX, even if it's under 25, shows the growing strength of a trend. Falling ADX line indicates that the current trend is losing its strength, no matter what level the line is currently on.
What ADX Values Mean for Trend Strength
ADX Value | Trend Strength | Trading Implication |
|---|---|---|
0–20 | Absent or very weak | Trend following trading strategies are not recommended; better to look for the range-bound setups |
20–25 | Emerging | A trend might be forming now; wait for the DI crossovers before going long or short |
25–50 | Strong | Trend following strategies could be used; the DI crossovers are especially meaningful in this case |
50–75 | Very strong | Trailing stops should be used if the strong trend exists; fresh entries have high risks of being late |
75–100 | Extreme (rare) | The trend seems to be weakening; pay attention to the upside peak of the ADX line |
25 level is the most widely used threshold. Levels below 25 mean the lack of directional power needed to enter the trade based on trends. Levels above 25 indicate that the trend is strong enough to trade.
Understanding +DI and -DI Lines
The +DI line shows upward movements while the -DI line shows the downward movements. +DI over -DI means the dominance of buyers while -DI over +DI means the dominance of sellers.
Crossover on this indicator happens when the +DI line goes over the -DI one (or vice versa). Crossover is not an entry signal itself; it should be combined with the certain value of the ADX line. The DI crossovers in a flat ADX environment have low probability to be meaningful.
How to Use ADX for Day Trading — Step by Step
ADX can be added to your Pocket Option chart as part of Trend or Williams indicators, where you will set the period to 14, which is the default one.
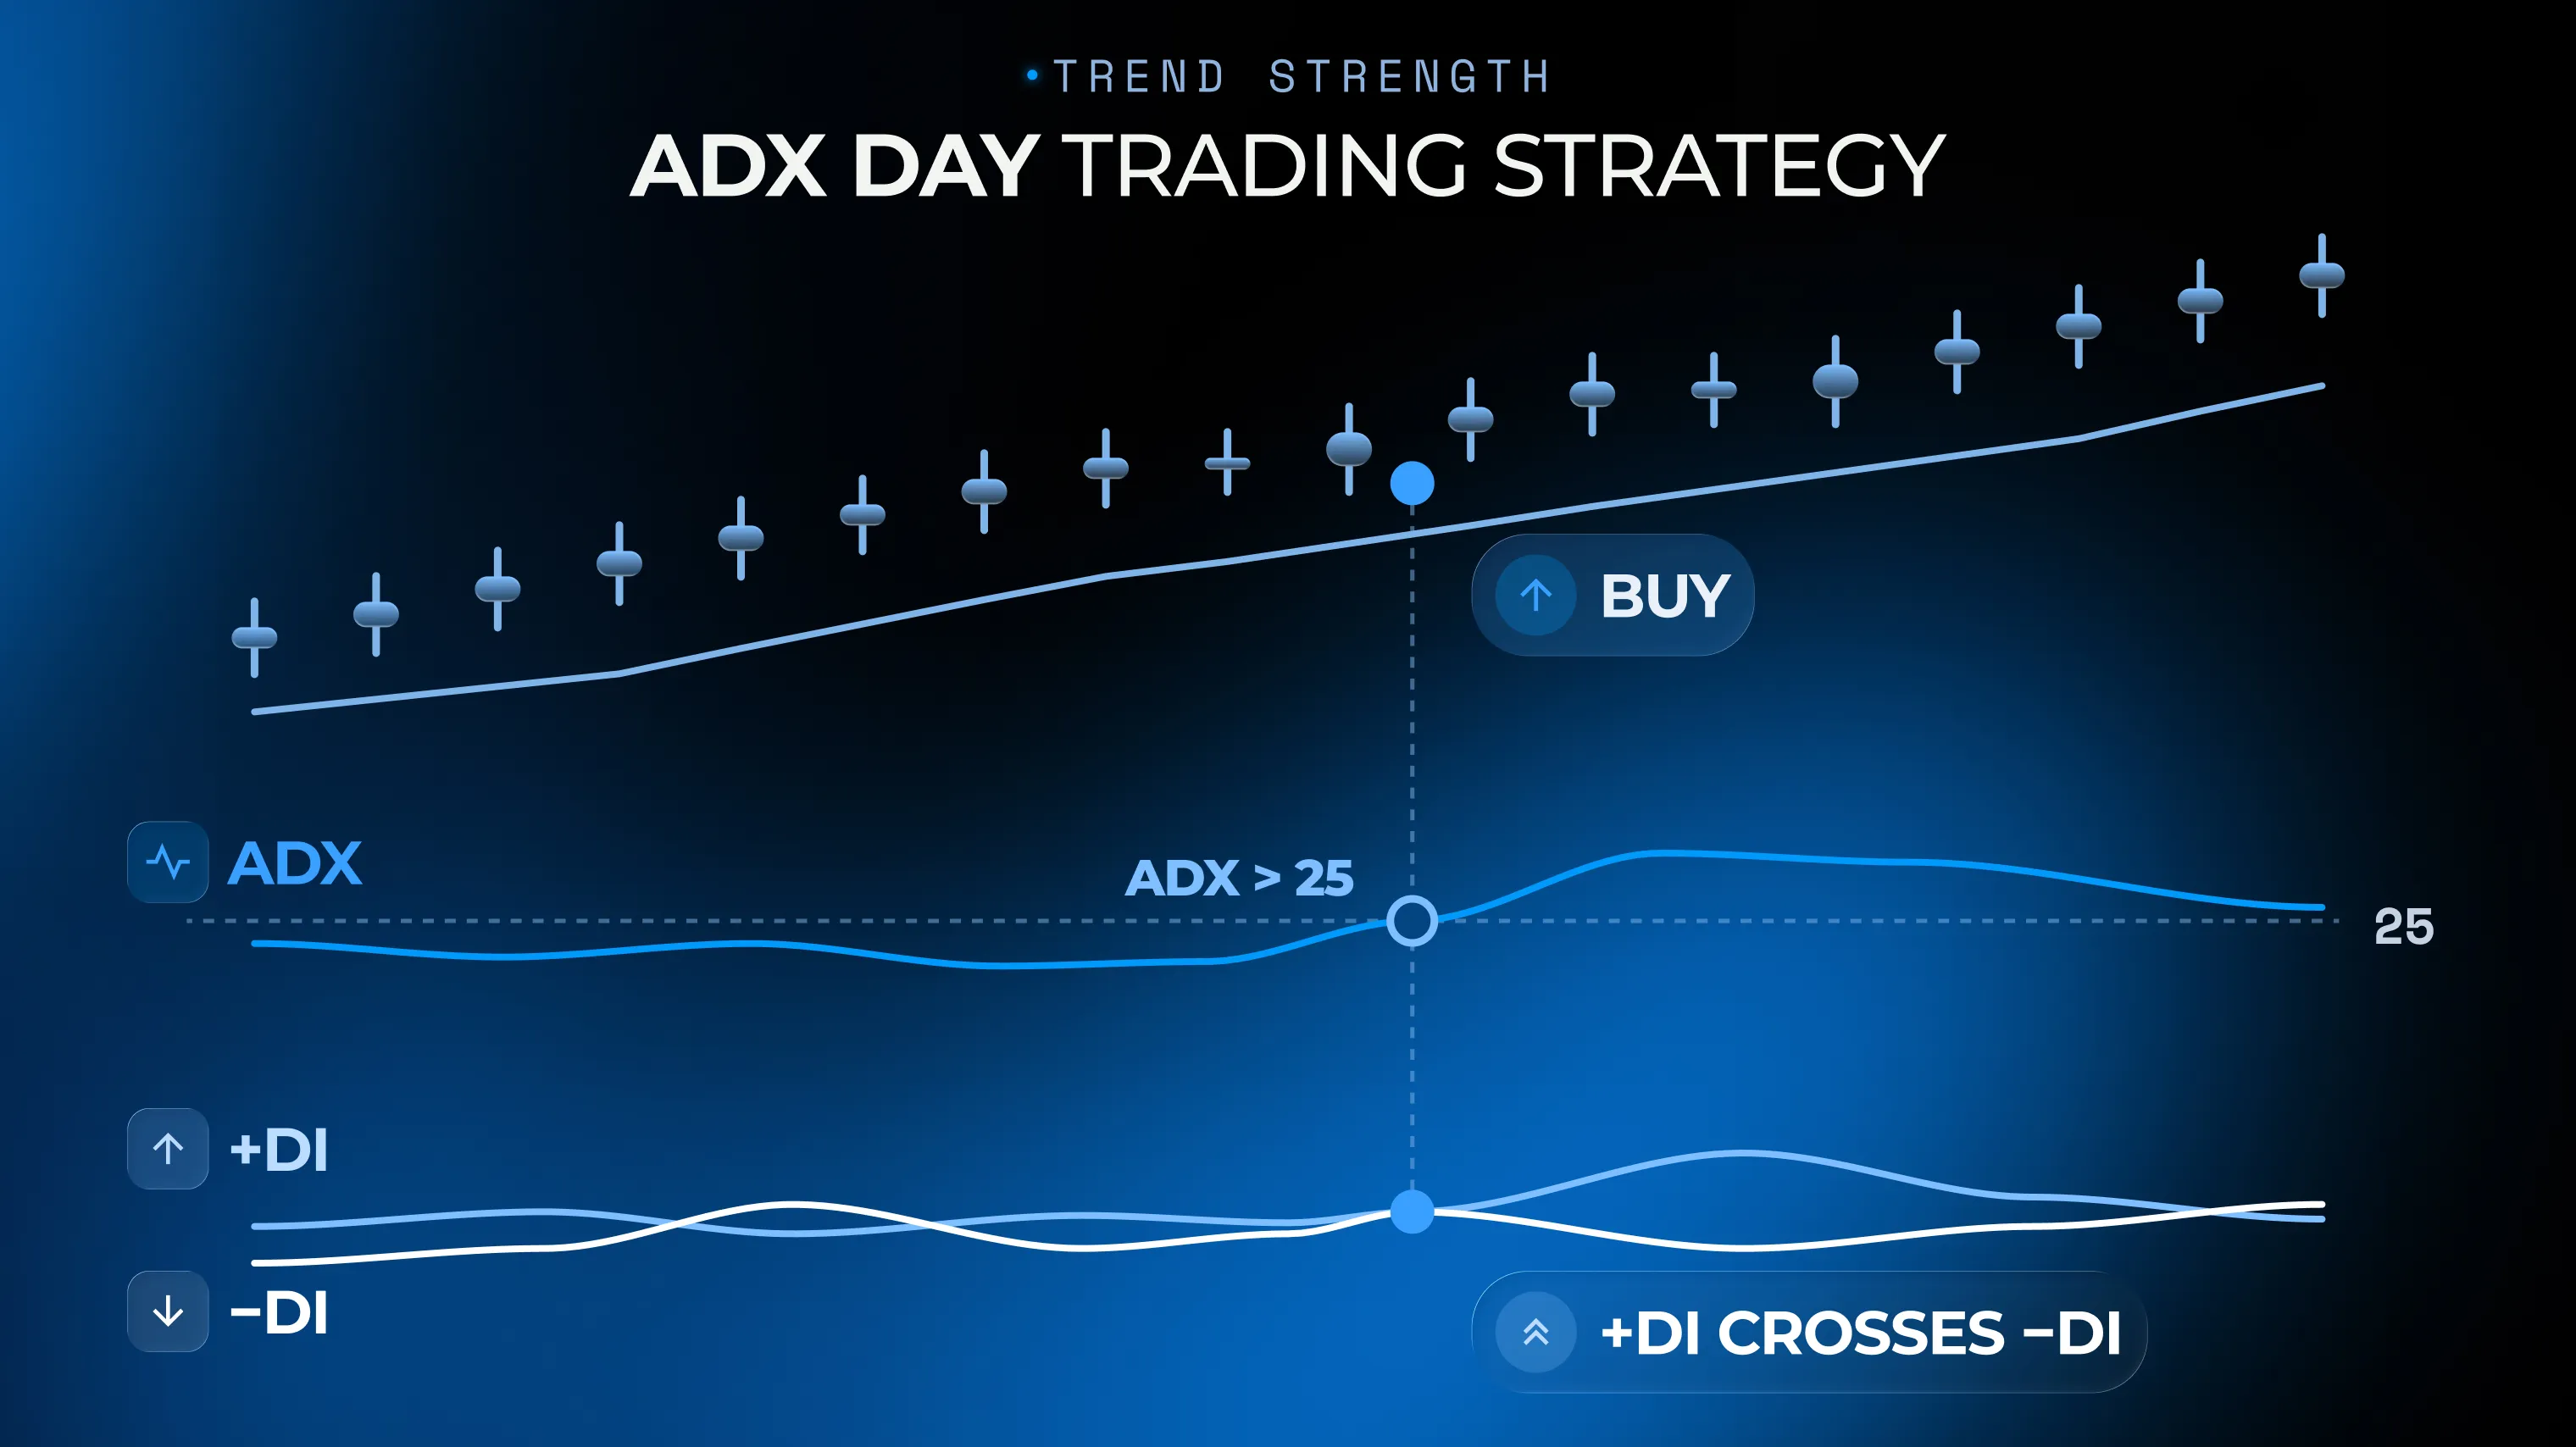
First, see what your ADX value is; if it is less than 20, the market is range bound, so no entries based on the trend. If the ADX is greater than 25 and growing, you should wait for a DI crossover to determine its direction.
If +DI is higher than -DI, and ADX is higher than 25, this is a signal of a bullish entry.
If -DI is higher than +DI, and ADX is higher than 25, this is a signal of a bearish entry.
Place your order at the moment of the crossover. Set your stop loss order at the recent swing low for a long position or swing high for short.
completely for free
Try Demo AccountEntry and Exit Signals with ADX Crossovers
The classic entry when using an ADX trading strategy takes place when +DI crosses over -DI, while ADX is over 25 and growing, meaning a long entry. You can close your trade when the opposite DI crossover happens or when the ADX starts declining after reaching the maximum value.
Note: a declining ADX value does not mean a reversal; it means a weakening of the trend. Weak trends may stay sideways for a relatively long time.
Combining ADX with Moving Averages
A successful combination for the indicator is: 20 EMA will show the direction of the trend, and ADX will confirm its strength. If price is higher than 20 EMA and ADX crosses above 25 level – it’s a buy signal. If price is lower than 20 EMA and ADX crosses above 25 level – sell signal. This mix of indicators filters out many false signals generated by each one when using them separately.
Combining ADX with RSI and MACD
ADX + RSI: ADX is used to find out if the market is trending and RSI is used to enter at pullback extreme points in the trend. ADX crossing above 25 and RSI dropping below 40 in uptrend is a very profitable situation.
ADX + MACD: In this case ADX is used as a gate for trend and MACD as a signal line crossing. This indicator gives the fast signal for entering and ADX confirms this signal as a profitable one.
Building a Simple ADX Day Trading Strategy on Pocket Option
Timeframe: M5 or M15.
Indicators: ADX with the settings 14 and +DI, -DI indicators along with a 20-period Exponential Moving Average as a trend filter.
Buy signal: If the ADX value exceeds 25 and continues to grow, the long signal will appear if +DI crosses -DI upwards and the price is located above the 20 EMA line. The short signal appears when -DI crosses +DI upwards while the price is located below the 20 EMA.
Stop Loss positioning: For buy positions, the stop loss is placed under the last swing low. For the sell positions, the stop loss is placed over the last swing high.
Take Profit levels: 1.5 to 2 times the size of stop loss or the price movement from the peak of ADX until it starts moving downwards.
Daily maximum number of trades: 5 trades per day. Stop after three losing trades in a row.
Test the best trading strategies!
Get StartedRisk Management Rules for ADX-Based Trades
Risk 1% of capital in the account per trade - ADX strategies work well when sizing is constant.
Never enter when ADX is less than 20; entries at levels less than 20 are noticeably more likely to fail.
Decrease size of position when ADX is in range of 20 and 25 - trend is being formed but not confirmed yet.
Use trailing stops for ADX values above 40 - as strong trends need space to develop.
Common Mistakes to Avoid When Using ADX
Do not confuse the direction of the ADX line with price movement. Downtrending ADX means losing momentum but not downward price movement.
Ignore DI crossovers when ADX is lower than 20 - as there will be no strong trend, crossovers will be pure noise.
Do not rely on the ADX line alone. Though ADX shows the strength of a trend, it does not give information about the direction. You need some kind of direction signal - an EMA line, price action or DI lines.
Notice the slope of ADX. ADX at level 30 that is uptrending shows a completely different picture from ADX at level 30 and downtrending. The same numbers show completely opposite things.
Conclusion
The ADX indicator is unique in the sense that it provides an answer to the question of whether a particular trend is worth trading and that is the question many traders forget to ask themselves. The answer to the question on: How to use ADX indicator for day trading comes down to a very simple principle and this is to confirm the strength of the trend before picking a position.
Develop your strategy using a demo account. Try it on 30 trades or more. Then when your statistics confirm that it's time to go live, start with the minimum possible position size.
Disclaimer: Financial markets are volatile and prices can move against you quickly. Past performance is not indicative of future results. Only trade with funds you can afford to lose. The information here reflects general market education and not personalised advice. Any trading decisions you make are your own responsibility. Consider consulting a licensed financial professional if you are unsure.
See more:InterestingTrading Strategies