
Bullish vs Bearish Divergence How to Use RSI Signals on Charts
Divergence is considered one of the most dependable immediate alerts in technical analysis. Understanding bearish and bullish divergence can meaningfully improve trade timing. This article provides a concise definition of different types of divergence in easy terms, guides the readers through RSI indicator on Pocket Option, and provides a detailed guide explaining how to find divergences.

Why RSI Divergences Matter for Everyday Traders
Most technical indicators give information about the present condition of the market. On the contrary, technical divergence indicates that a price movement is losing momentum before the price itself has noticed it. That additional time makes RSI divergences priceless for confirmation of reversal and continuation trends.
They are important as they solve the question that every trader would like to know at least once in their life: whether this movement is just beginning or it is about to finish.
How RSI Works in Plain Language
RSI is fundamentally considered an overbought oversold oscillator (a momentum indicator) based on price movements that can take values between 0 and 100. The default period setting is 14. RSI values above 70 are indicative of overbought conditions, while the values below 30 indicate the oversold conditions.
However, the mere index number is perhaps not as interesting as the RSI's relative performance toward the prices. A new high in the price coupled with lack of confirmation from the RSI suggests a loss of strength in the movement. A new low in price with lack of respect from RSI indicates fading of selling pressure. This behavior represents divergences, which are a signal.
What a Divergence Is: Price vs Indicator
What is a bullish divergence? What is bullish divergence in its bearish form? The technicalities aside, divergence is simply when price movement goes in two opposite directions; the price moves to a new extreme high or low and the RSI does not make a new high or low to follow this movement. Drawing RSI trendlines between these points makes the pattern visible. Failure to follow is what we call divergence, which indicates that whoever is driving the current price action is losing its strength, but the price has not changed direction yet.
Types of RSI Divergences You'll See on Charts
Divergence Type | Price Action | RSI Action | Signal | Context |
|---|---|---|---|---|
Regular Bullish | Lower low | Higher low | Possible trend change upwards | Downward trend comes to end |
Regular Bearish | Higher high | Lower high | Possible trend change downwards | Upward trend comes to end |
Hidden Bullish | Higher low | Lower low | Trend is likely to move upwards | Continuing the current uptrend |
Hidden Bearish | Lower high | Higher high | Trend is likely to move downwards | Continuing the current downtrend |
Regular Bullish Divergence
Bullish divergence RSI means price makes lower low but RSI makes higher low. Signifies that selling pressure is weakening. The bullish divergence meaning is clear: this is a trend reversal confirmation signal that appears at the end of a downward movement. Price goes through a higher low (the structure of the upward movement is preserved) and the RSI goes through a lower low, indicating continuation of the trend - the pullback has relieved the selling pressure without breaking the whole trend.
Regular Bearish Divergence
Bearish divergence RSI (the bearish divergence meaning) - price shows a higher high and the RSI shows a lower high, meaning that the price advance is weakening and selling may be preparing for new moves.
Hidden Bullish Divergence
When the price makes a higher low and the trend structure continues. At the same time the RSI makes a lower low. This is a sign of trend continuation. The pullback has absorbed selling pressure without leading to a break of the trend. Expect the price to continue increasing.
Hidden Bearish Divergence
The price makes a lower high (the downtrend is intact), and the RSI makes a higher high. The fix did not lead to a change in momentum. The downtrend may continue.
Setting Up RSI Directly on Pocket Option Charts
Open the Pocket Option trading platform and select the trading asset you want to operate.
Click on the indicators menu (the icon in the upper part of the chart panel).
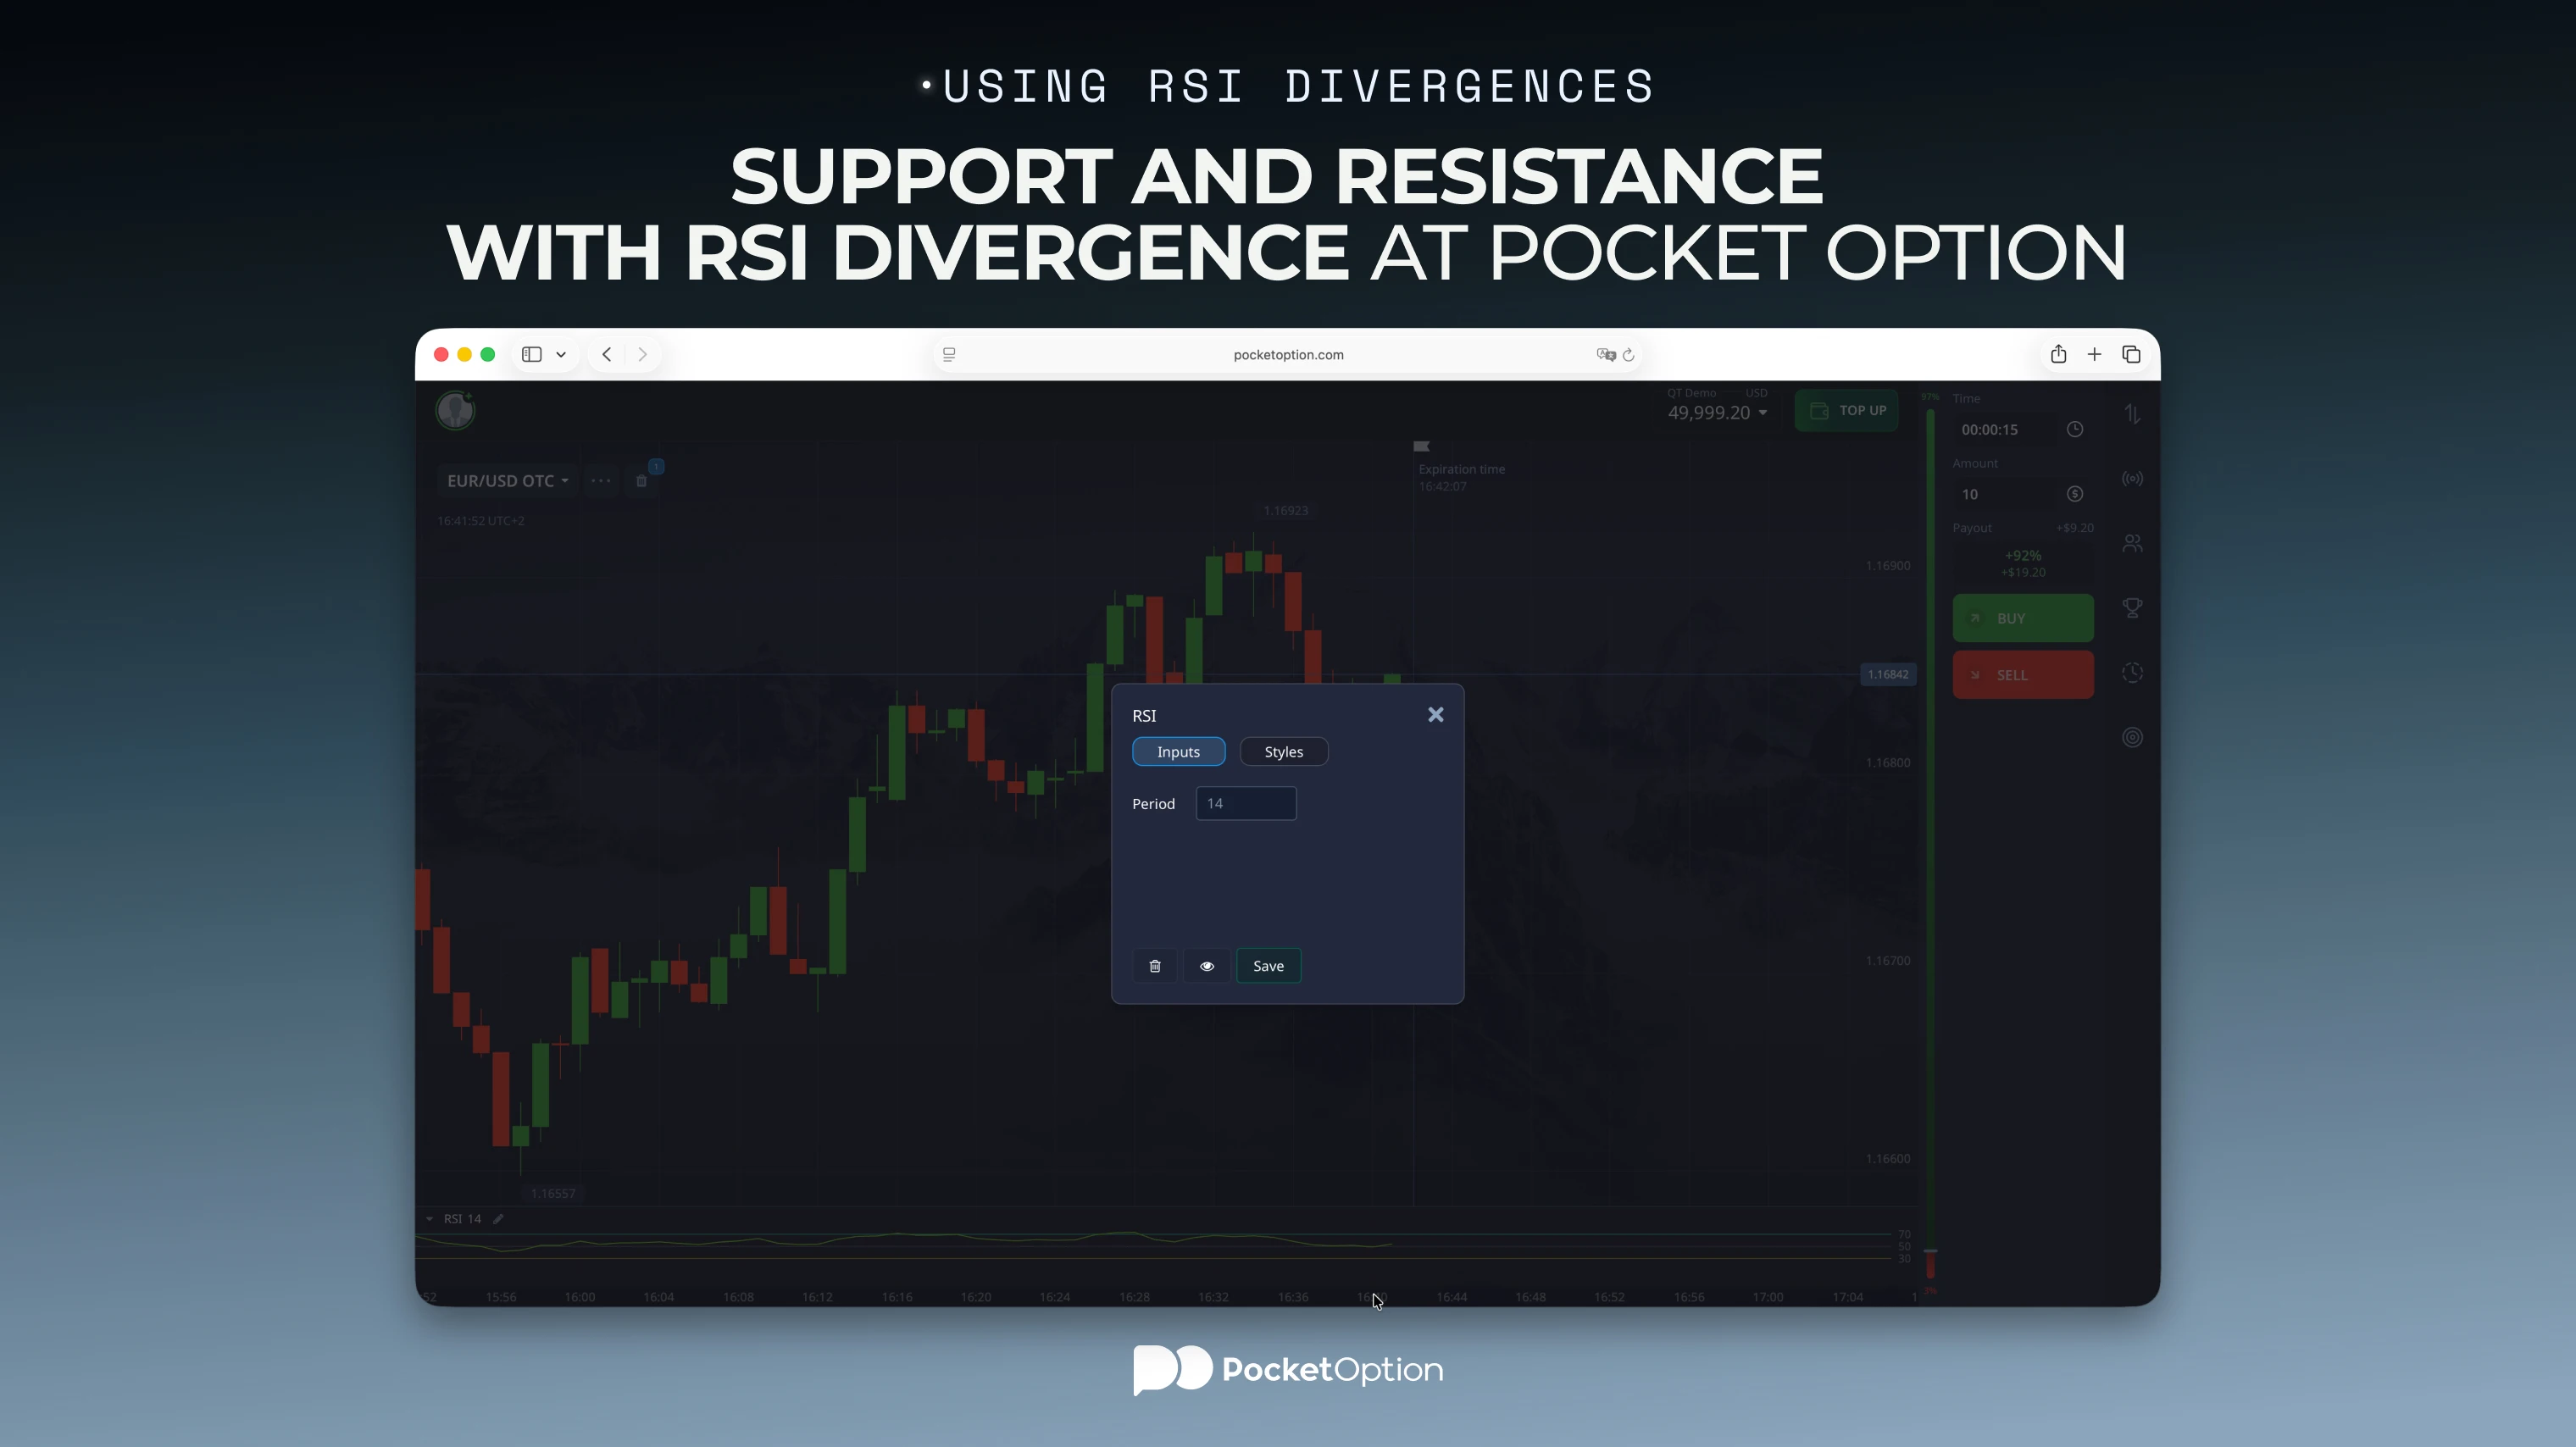
Find the term 'RSI', or 'Relative Strength Index', and add it. The indicator will be displayed at the bottom of the price chart in a separate panel.
It is required to keep the default parameter of 14 periods.
Pro Tip: Add horizontal lines at 70 and 30 to make them more visible. These mark the overbought and oversold levels.
Start using indicators on real charts
Get StartedStep-by-Step: How to Spot Divergences on Pocket Option
Marking Swing Highs and Lows on Price
Find the latest peaks and valleys on the price chart, where there was a price reversal. This is your anchor. On a 15-minute chart, the swings will be tighter; on a 4-hour chart, broader and more significant.
Marking the Same Swings on the RSI Line
Now check the RSI chart - whether the peaks and valleys coincide with each other. They should match in a timeframe. The question is whether they match in a direction - namely, whether RSI confirms the price higher or lower.
Connecting Swings to See Divergence Patterns
Draw a connecting line between the last two lows of price. After this, draw the same line between the identical lows of RSI. If the price swings down and RSI goes up, that suggests a bullish divergence. To recognize bearish divergence apply the same approach for the highs. Following this technique will help you identify the divergence pattern easily.
Using RSI Divergences with Trend and Key Levels
The occurrence of divergences at critical levels of support and resistance produces more significant results. For example, if the price tests a sufficiently strong support area while the RSI shows bullish divergence, there is a high probability of success of the trading plan.
Furthermore, the use of the RSI to perform multi-timeframe analysis increases the credibility of the signals obtained. For example, if the 15-minute chart gives a bullish divergence while the 1-hour RSI is getting off the oversold levels, the market signals become more forceful because both timeframes demonstrate the same trend.
Divergences go against the main trend on a higher timeframe, leading to weaker price actions. Therefore, context is important and constitutes a part of the signal.
Practical Examples of RSI Divergences on Pocket Option Charts
Let’s assume that EUR/USD is in a downtrend at the 15-minute chart. The price is recording new lower values of 1.0820 followed by an upward movement to 1.0805. However, the RSI recorded its lowest value already at the first movement down and got higher during the second one. Thus, the divergence is present here.
Now let us analyze gold on a 1-hour chart showing a certain trend and price correction. Price makes corrections while creating a higher low; however, in this case, the RSI records a lower value compared to the previous correction. The price structure suggests that the situation is bullish; the dip in momentum indicates buyers activating the weak hands. This condition is referred to as hidden bullish divergence, which means that the trend is likely to continue.
Risk-free on Pocket Option Demo account
Try Demo AccountHow to Turn Divergences into a Simple Trading Checklist
Before making any trades based on divergence, take the following checklist into account:
Is the divergence regular or hidden? It is crucial to determine whether you will be trading along or against the trend.
Is price at any important level of support or resistance? Rules regarding the reliability of divergences state that any divergence at a specific level is more likely to produce good results than divergence which is not associated with any critical price levels.
What does a higher timeframe indicate? Any divergence which complies with the general trend is likely to be successful
Is there any particular candlestick pattern confirming the divergence?
Is the stop-loss level defined before entering? If not, do not enter. The divergence tells you direction. Risk management tells you size.
Training Your Eye on the Demo Account First
Practicing Divergence Spotting Without Real Money Risk
A demo trading account of Pocket Option is the perfect way to upgrade the divergence recognition skill. Analyze different assets on multiple timeframes while concentrating on spotting divergences. The focus during the first couple of weeks is not on actually trading, but rather on visually identifying divergences. Correct identification is the first step that should lead to correct execution.
Recording Screenshot Examples in a Trading Journal
You should take a screenshot every time you see a divergence, even if it does not work for you. After 30 or 40 examples, you will gain an understanding of which setups work and which ones do not.
Common Mistakes Beginners Make with RSI Divergences
Using divergences by itself while ignoring other signals: direction, levels, and timeframe context.
Seeing divergences that are not present: there needs to be at least two clear swings to confirm a divergence, and if there are none, it is a false signal.
Overlooking hidden divergences completely: many beginners learn how to work with normal divergences and then do not search for continuation signals, thus missing an important half of the picture.
Entering the market when a divergence is formed rather than when a particular price reaction occurs. A divergence is merely a warning and should not be treated as an entry signal in and of itself.
Next Steps: Refining Your RSI Divergence Approach Over Time
Once you have full understanding of how to detect divergences, incorporate it into your trading strategy. You need to set up the RSI's time frame. Change it to 9 if you want faster and more changeable signals, while you should set it to 21 if you prefer signals that are slower and smoother. You may also use the RSI concurrently in different time frames, for example, if you see the divergence on an hour chart and it confirms on the four-hour chart simultaneously. Volume can serve as a second oscillator.
The goal is to be successful in acting based on your experience, not instincts.
Conclusion
The divergences generated by means of RSI indicators allow traders to see the market conditions indicating the price movements being in accordance with the underlying momentum. However, they are not 100% accurate. No signals are precise enough to be fully trustworthy. But if the divergences are supported by key levels and a trend context, they can work for the trader and lead to a successful outcome.
Practice in demo mode and learn how to spot patterns and, when the real market gives you a divergence signal, to know what to do.
Pocket Option offers unlimited possibilities!
Register NowDisclaimer: Trading involves significant risk of capital loss. This article is for educational purposes only and does not constitute financial advice. Always conduct independent research and consider your risk tolerance before making any trading decisions.
See more:InterestingTrading Strategies