Vortex Indicator: How to Catch the Start of a New Trend with VI+ and VI-
Vortex indicator is displayed through two lines labelled as: VI+ and VI- and allows to track the upward and downward price movements. Crossing points mean that the new trend starts developing, and the opened gap reflects the power of the new trend.

What Is the Vortex Indicator
Vortex indicator was developed by Etienne Botes and Douglas Siepman and it is based on the idea that there is a rotational energy in a market, therefore the name vortex market, in which the price is moving from one high to another and vice versa
In order to measure the rotational energy, there are two different lines:
VI+ line is the indicator of the upward strength and it calculates the difference between the current high and the previous low;
VI- is the downward strength indicator and it counts the difference between the current low and the previous high.
Both lines are located under the price chart, and it is their interaction that provides us with the signal.
The Vortex Formula: True Range, VM+, and VM-
Vortex indicator formula works on the basis of three parameters: True Range, VM+, VM-.
True Range (TR) is a measure of the price change in one candle. It is the greatest of the three measured distances: the difference between current high and current low; the gap between current high and previous closing; the gap between current low and previous closing.
VM+ is a parameter of the upward pressure and it represents the distance between current high and previous low. The further price has risen from its recent minimum level, the larger VM+ will be.
VM- is a parameter of the downward pressure and it is practically symmetrical to VM+. It is calculated as the distance between current low and previous high.
These two lines are formed based on the ratio of the specified parameters to the movement of the prices. For example, the sum of VM+ values over a period of 14 candles divided by the sum of True Range gives VI+. The same goes with VM- and VI-. Thus, the lines show the answer to the question: what percentage of the recent price movement was made in this direction?
All distances are calculated in terms of their absolute value, since the formula calculates only the distance between candles, but not its direction. That is why a sharp reversal of prices may increase both lines for some bars. Wide-ranging candle increases the value of VM+ and VM-, and only after the formation of the new trend one of the lines prevails.
A Worked Example
Assume a 14 period vortex calculation is done based on a 1-hour chart, with the cumulative sum of VM+ over the last 14 candles being 42, the sum of VM- being 28, and the True Range of those 14 candles totaling 56, then:
VI+ becomes 42/56, equaling 0.75, whereas
VI- becomes 28/56, resulting in 0.50.
As VI+ (0.75) is higher than VI- (0.50), the positive directional move is now in control.
However, if VM- sum increases but VM+ stays the same on the next candle, VI- will increase until it passes over VI+, reversing the directional move into negative.
How a Crossover Signals a New Trend
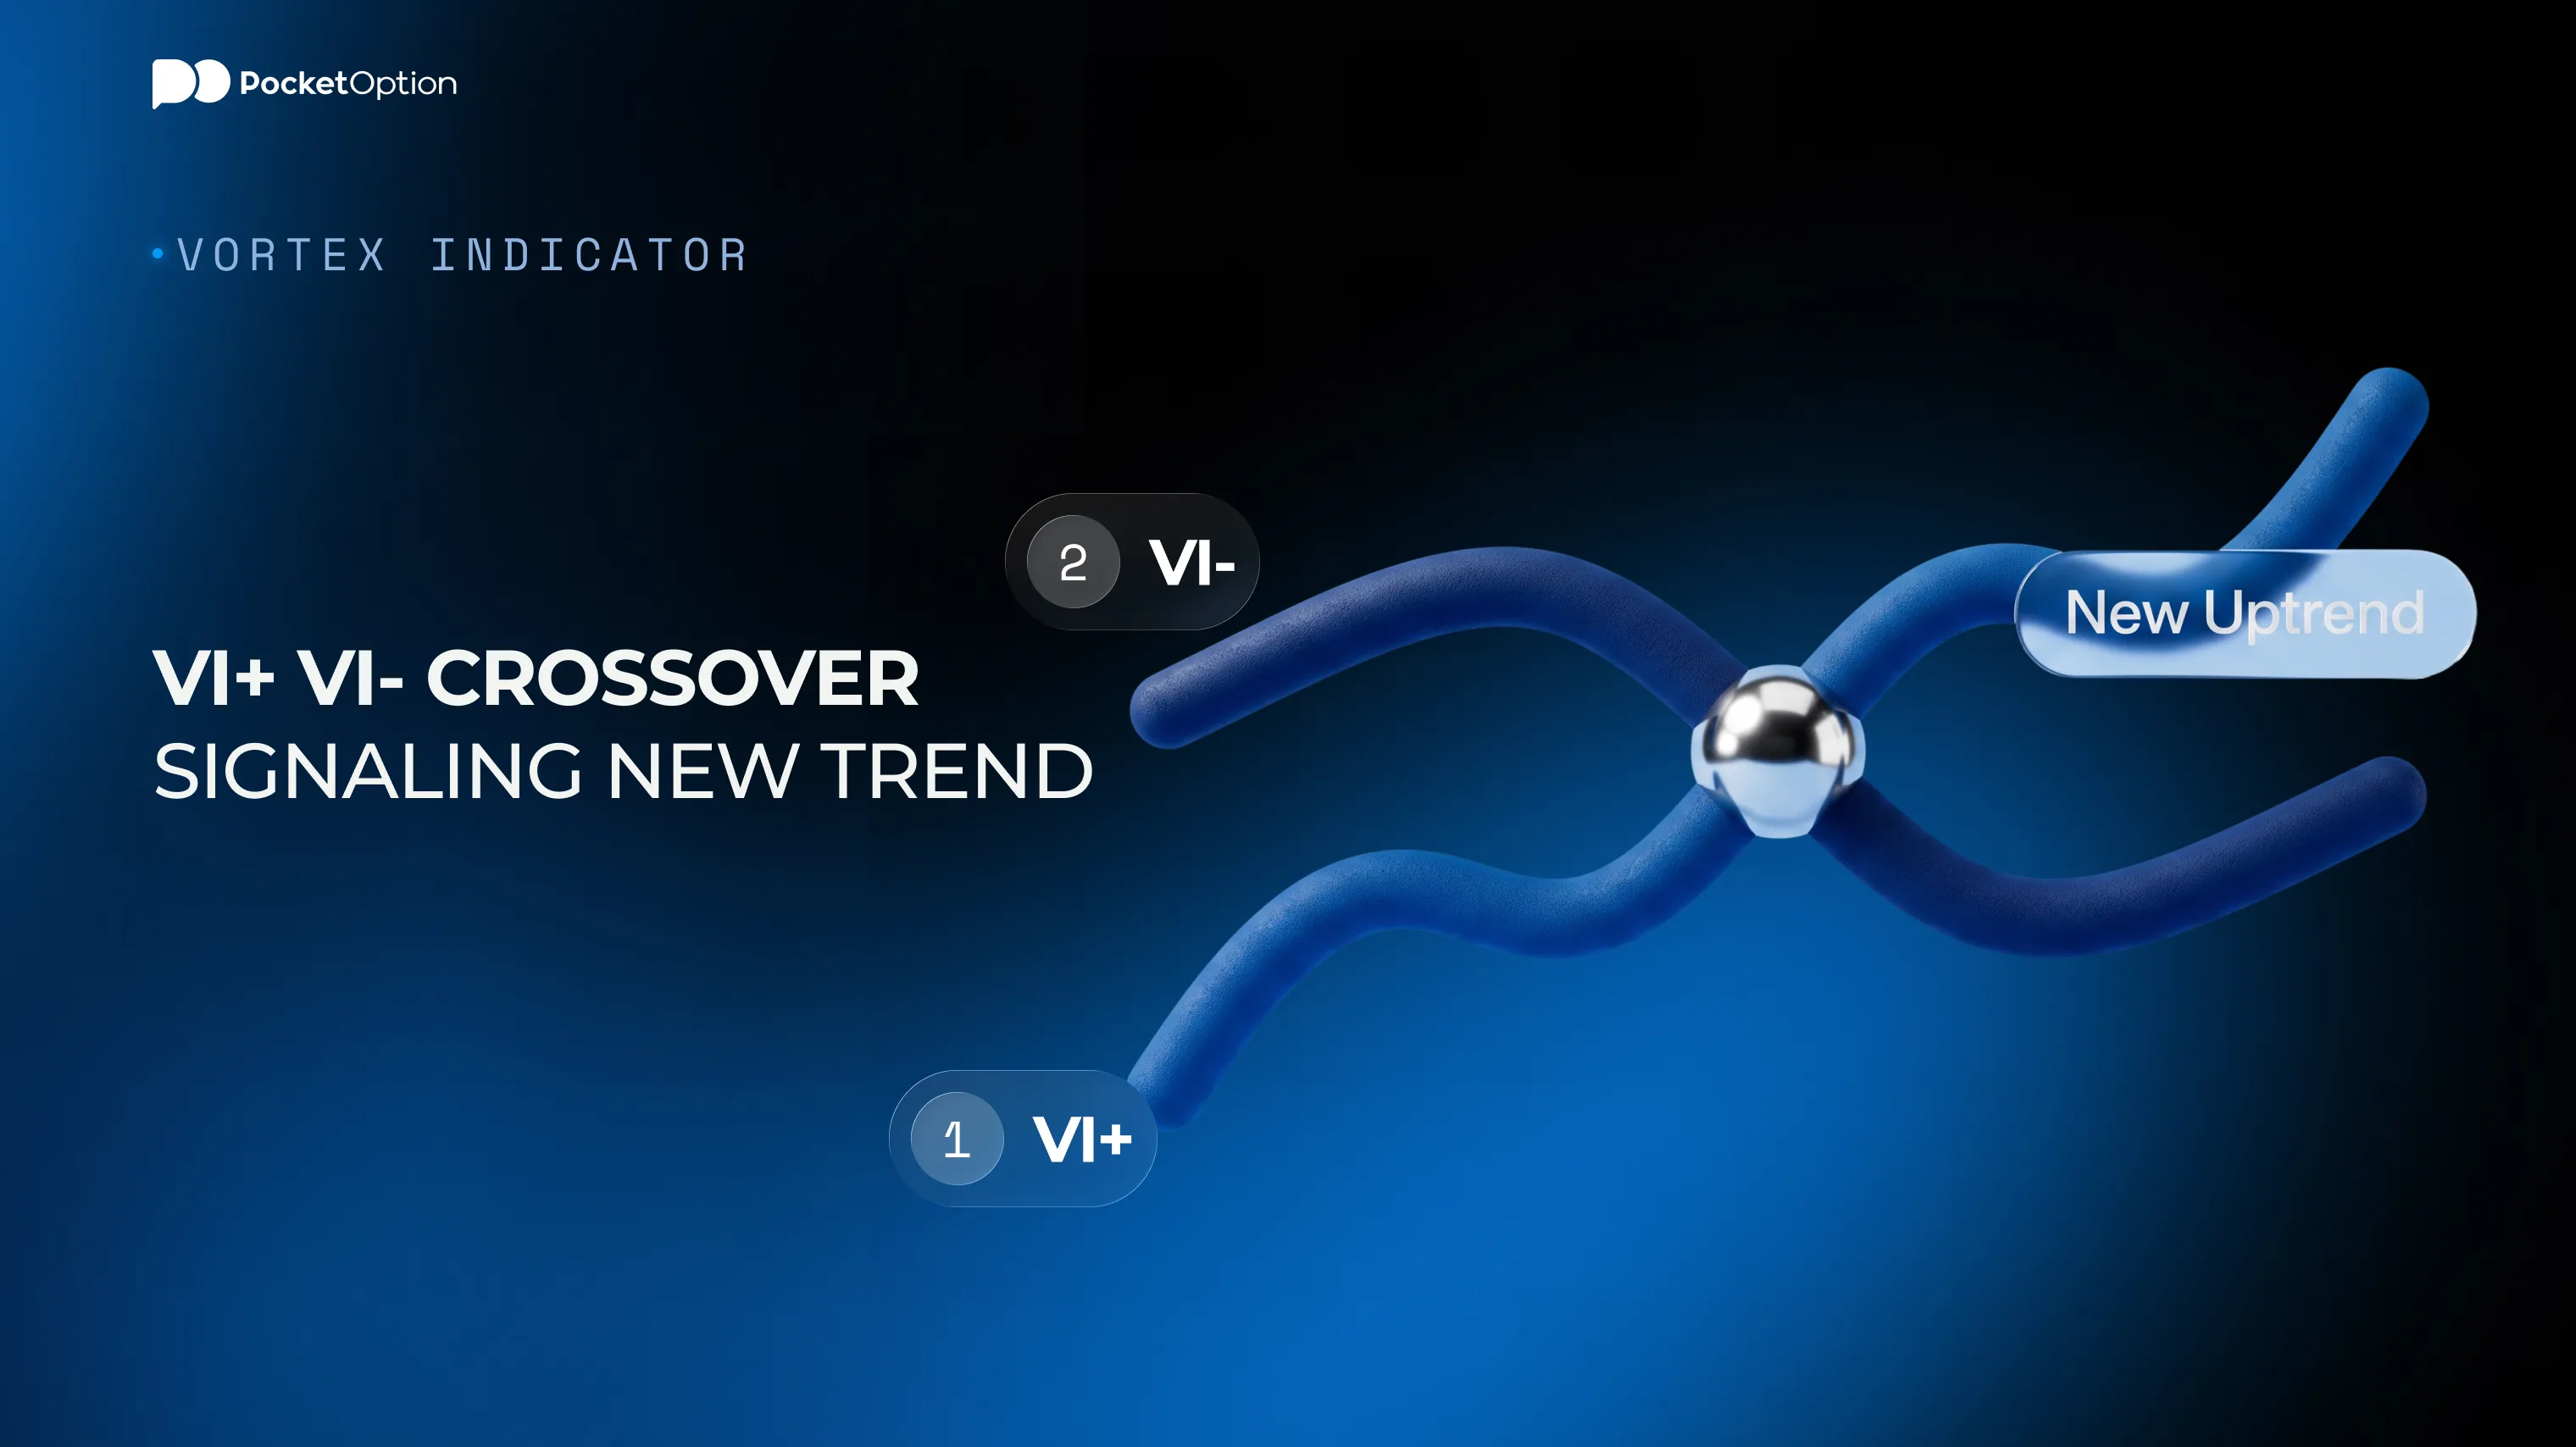
Crossover is where VI+ moves from below VI- to above it, and vice versa. If VI+ crosses above VI-, it means that the upward trend is dominating the downward trend, therefore, the new uptrend has begun. In case VI- crosses above VI+ the new downtrend has been formed.
The crossover is nothing but a change of dominating direction. It doesn't mean at all that the strength of a new trend is known. For that, you need to pay attention to the distance between these two lines.
What the Gap Between VI+ and VI- Tells You About Strength
The small distance between the two lines, even soon after the crossover, tells us about the weak new trend because both directions have almost equal weight. The increasing distance between the lines means that the new trend becomes stronger and one of the directions is much faster in VM+ and VM- values than the other one.
Many traders consider a widening gap as a reason to keep their positions open, while narrowing one gives them an early signal that the trend is losing strength.
Best Settings by Trading Style
A vortex indicator period of 14 is considered as standard one, since it matches the standard period of ADX and many other indicators showing directions. Short periods (from 8 to 10) increase the sensitivity and give many more crossovers, so the strategy can use it for intraday or scalping trading on low time frames.
Longer periods (such as 20 to 25) make lines smoother and give fewer crossovers which is suitable for swing trading on H4 and daily charts. Vortex indicator MT4 settings can include the periods from 8 to 25 with 14 as default value.
Vortex vs ADX: Direction vs Strength
Feature | Vortex Indicator | ADX |
|---|---|---|
What does it measures | Direction, measured through the VI+ and VI- crossovers. | Trend strength, independently from direction. |
Type of signal | Line crossover | Threshold level, typically above or below 25 |
Directional information | Built in (VI+ vs VI-) | Requires both +DI and −DI lines in addition to ADX line |
Best used for | Identifying trend initiation | Verifying trend strength before trading |
The two measures are used in combination, not as alternatives. The crossover in the vortex indicator suggests a possible change in trend direction, but the increase in the ADX value, described in this overview of objective trend strength metrics, is a strong signal that the trend has sufficient strength.
A Simple Crossover Trading Strategy
Apply the vortex indicator to the chart with a 14-period setting.
Look for a crossing above by VI+ over VI- to mark a long entry setup and a crossing above by VI- over VI+ for a short one.
Verify the presence of a stronger trend with ADX value of above 20 to 25.
Enter the trade in the direction of the crossing with a stop placed past the recent swing high/low.
Exit the trade when the distance between VI+ and VI- starts narrowing after becoming wider.
Combining Vortex with Moving Averages, MACD, or RSI
Vortex crossover in line with the direction of the longer moving average is usually more significant than the opposite. Applying vortex indicator with EMA crossovers creates a simple filtering mechanism: only long crossovers in case price is above the longer EMA and vice versa.
Similar approach can be used with MACD, as the convergence in the direction of the crossing between vortex lines means getting additional confirmation of the crossover with MACD histogram. The settings of MACD can be adjusted to the chosen period to keep the same sensitivity of two indicators.
RSI can be used not to verify the direction of the crossover but to make sure it comes in early enough, as the fresh crossover coming while RSI is in the overbought or oversold zone has greater chances to be followed by a pullback immediately.
Common Mistakes When Using the Vortex Indicator
The biggest pitfall when working with the vortex indicator can be taking all crossovers regardless of context. In a ranging market, VI+ and VI- form multiple crossings with reversed directions after each other in just a few candles. That happens because the trader does not pay attention to the distance between two lines and uses the crossing as a basis for entering the trade.
Another mistake is using the same period setting for the vortex indicator in all markets regardless of their volatility level, as more volatile markets have noisier VM+ and VM- lines.
Using the Vortex Indicator on Pocket Option Charts
The vortex indicator can be added from the indicators menu and applied to any chart. The period field is available for adjusting and testing the parameters explained above. It would be reasonable to test various period settings and confirmations on the demo account first.
start with a small deposit
Open AccountConclusion
In general, the vortex indicator gives a clear insight into which trend direction dominates, while the difference between VI+ and VI- is a simple criterion of its strength. In combination with the ADX trend strength filter and moving averages or momentum indicators as confirmation tools, it gives a straightforward way of entering positions at the beginning of the new trend, not in the middle.
test it on a free demo
Try DemoDisclaimer: CFDs and other leveraged products involve a high level of risk to your capital. Ensure you understand how this product works.
See more:InterestingTrading Strategies