
Pocket Option Best Technical Trading Indicators
Choosing the right technical indicators can boost your Pocket Option trading results. This article highlights the best tools for short-term trades.

Understanding the Value of Technical Indicators in Pocket Option
The best Pocket Option indicator isn't the most complex--it's the one that provides actionable signals aligned with your strategy. Pocket Option offers 30+ technical trading indicators as tools for mathematical analysis to help predict price movements and market trends. You can access these through the "Indicators" section, located on the upper left part of the trading interface near the chart type selector.
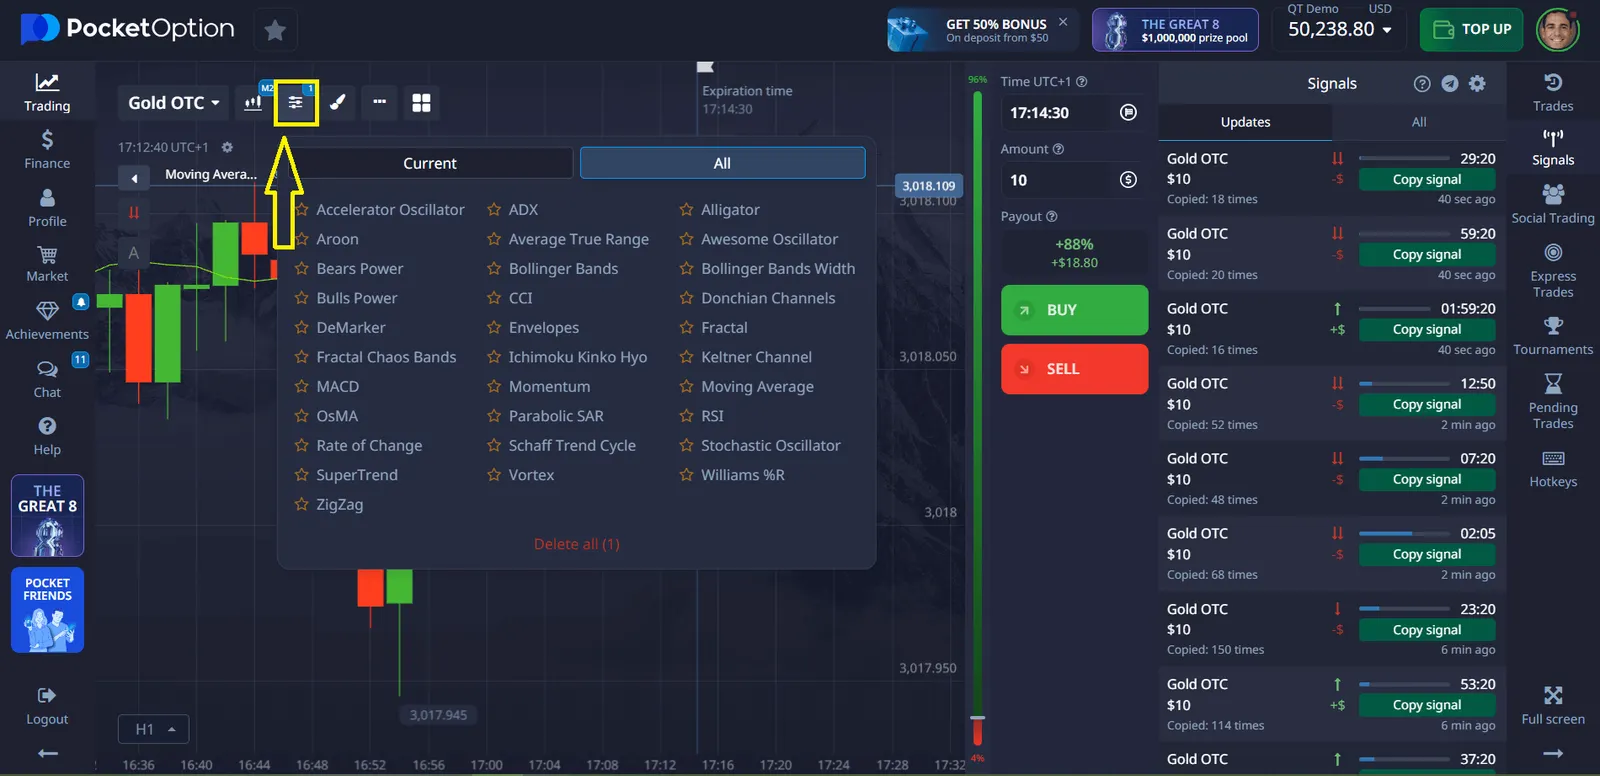
Accessing and Managing Indicators on Pocket Option
When examining the best indicator for Pocket Option trading, it's important to know how to effectively use the platform. Once you select an indicator, it will be applied to your chart. You can add indicators to your Favorites by clicking the star icon next to them for quick access. Keep in mind that a maximum of 30 indicators can be applied across all charts. If you wish to add more, you will need to remove some existing ones.
Top-Performing Indicators for Pocket Option Trading
When selecting the best indicator for Pocket Option trading, five tools consistently outperform others across various market conditions.
| Indicator Name | Best Timeframe | Trading Style | Accuracy Rating |
|---|---|---|---|
| Relative Strength Index (RSI) | 5-15 minutes | Reversal | High |
| Bollinger Bands | 1-5 minutes | Breakout | Medium-High |
| MACD | 15-30 minutes | Trend | Medium |
| Parabolic SAR | 5 minutes | Trend Reversal | Medium |
| Stochastic Oscillator | 5-15 minutes | Overbought/Oversold | High |
The key difference between indicators lies in their specific functions and the type of data they analyze. Each indicator provides unique insights, allowing traders to tailor their approach depending on their preferred type of analysis.
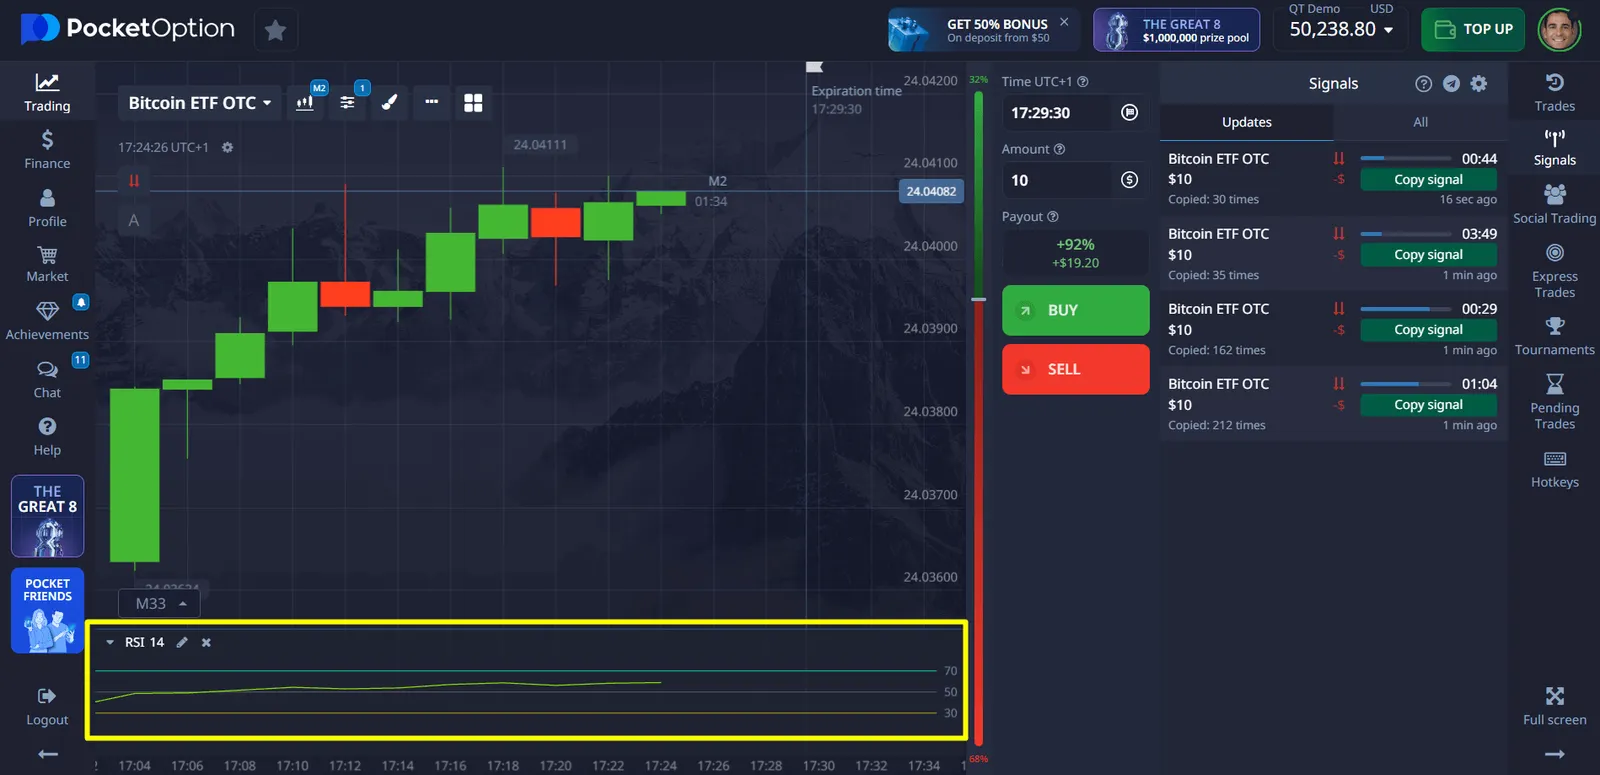
Trend Indicators
Used to determine the direction of a trend.
- Moving Average
- SuperTrend
- Ichimoku Kinko Hyo
- Parabolic SAR
- Alligator
- Envelopes
- Bollinger Bands
- Bollinger Bands Width
- Donchian Channels
- Keltner Channel
- ZigZag
Oscillators
These are used to determine overbought or oversold conditions.
- RSI (Relative Strength Index)
- Stochastic Oscillator
- Awesome Oscillator
- Accelerator Oscillator
- MACD (Moving Average Convergence Divergence)
- OsMA (Moving Average of Oscillator)
- CCI (Commodity Channel Index)
- Momentum
- Williams %R
- DeMarker
- Bears Power
- Bulls Power
- ADX (Average Directional Index)
Volatility Indicators
Used to measure the degree of price volatility.
- Average True Range (ATR)
- Bollinger Bands
- Bollinger Bands Width
- Keltner Channel
- Donchian Channels
- Fractal Chaos Bands
Volume/Strength/Other Tools
- Vortex
- Aroon
- Schaff Trend Cycle
- Fractal
Powerful Indicator Combinations That Reduce False Signals
The best indicator for Pocket Option often isn't a single tool but a system of complementary indicators that confirm signals and reduce false positives.
| Combination Name | Components | Signal Type | Performance |
|---|---|---|---|
| Triple Confirmation System | RSI + MACD + Support/Resistance | Reversal Entry | Excellent |
| Volatility Breakout Detector | Bollinger Bands + Volume + ADX | Breakout Entry | Very Good |
| Trend Momentum Package | Moving Averages + Stochastic + OBV | Trend Continuation | Good |
| Divergence Detection Suite | RSI + MACD + Price Action | Early Reversal | Very Good |
Matching Indicators to Your Trading Psychology
Even the most accurate Pocket Option indicator becomes worthless without psychological compatibility. Your temperament must align with your indicator's characteristics for sustainable success.
- Risk-averse traders benefit from multiple confirmation systems despite potentially missing early entries
- Aggressive traders prefer leading indicators like RSI despite higher false positive rates
- Systematic traders find mechanical indicators with clear rules easier to implement
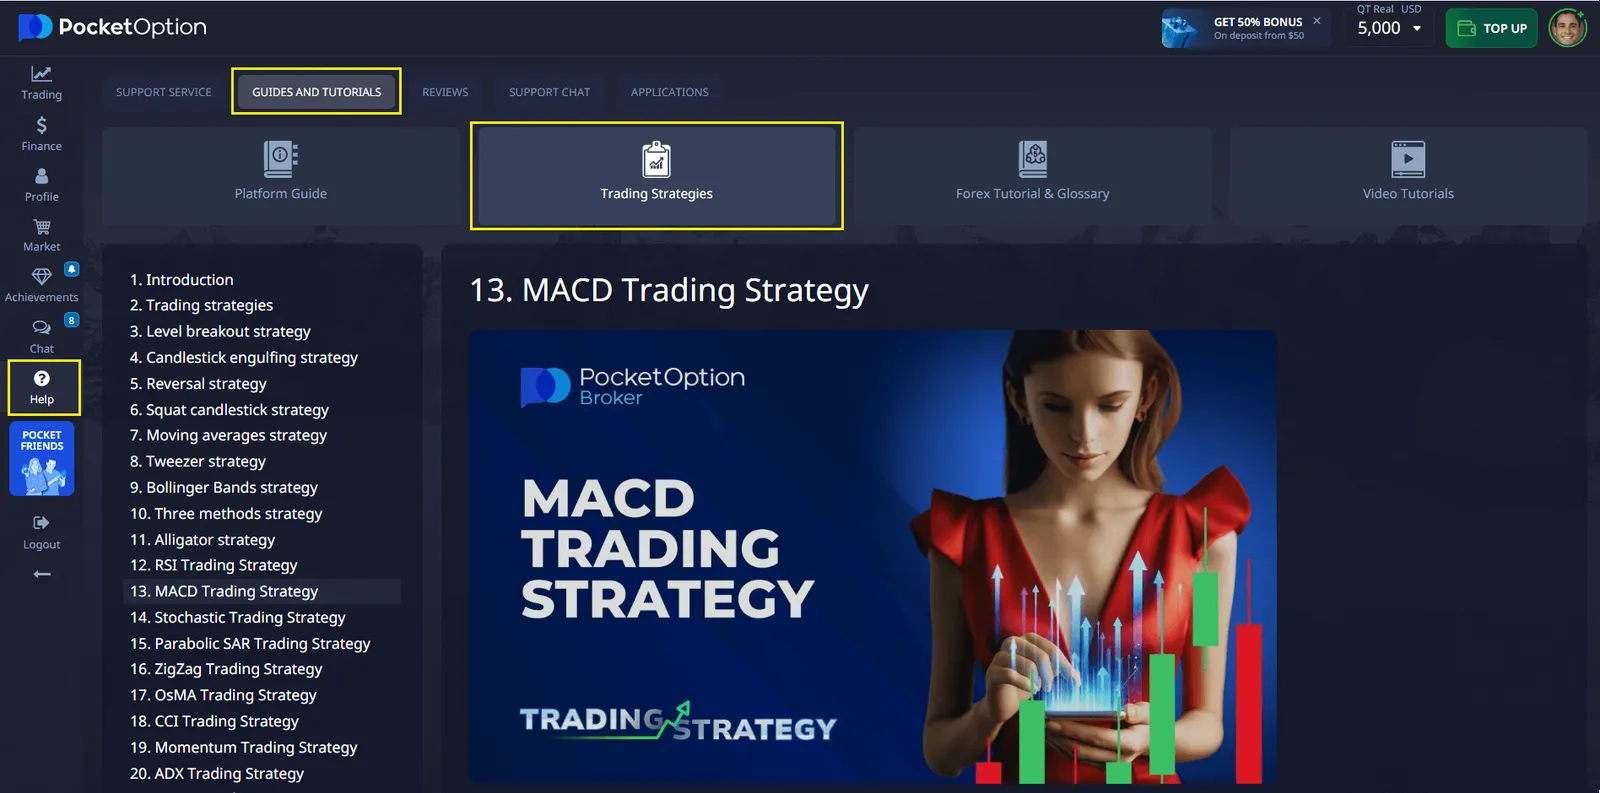
The Pocket Option trading platform features a comprehensive strategy section that many traders overlook. Within this valuable resource, you'll discover potentially game-changing indicator approaches you haven't yet incorporated into your investment arsenal. Exploring these untapped strategic options could be the key to optimizing your trading performance and potentially enhancing your returns.
Testing Indicators in a Risk-Free Environment
Before implementing any trading system with real capital, experienced traders always validate their approach using Pocket Option's demo account with $50000. This practice environment is invaluable when evaluating the best Pocket Option indicator for your strategy. When testing indicators like RSI or MACD combinations, a demo account provides authentic market conditions without financial consequences. By logging at least 50 trades with your chosen indicator setup, you'll gather meaningful data about its effectiveness across different market phases.
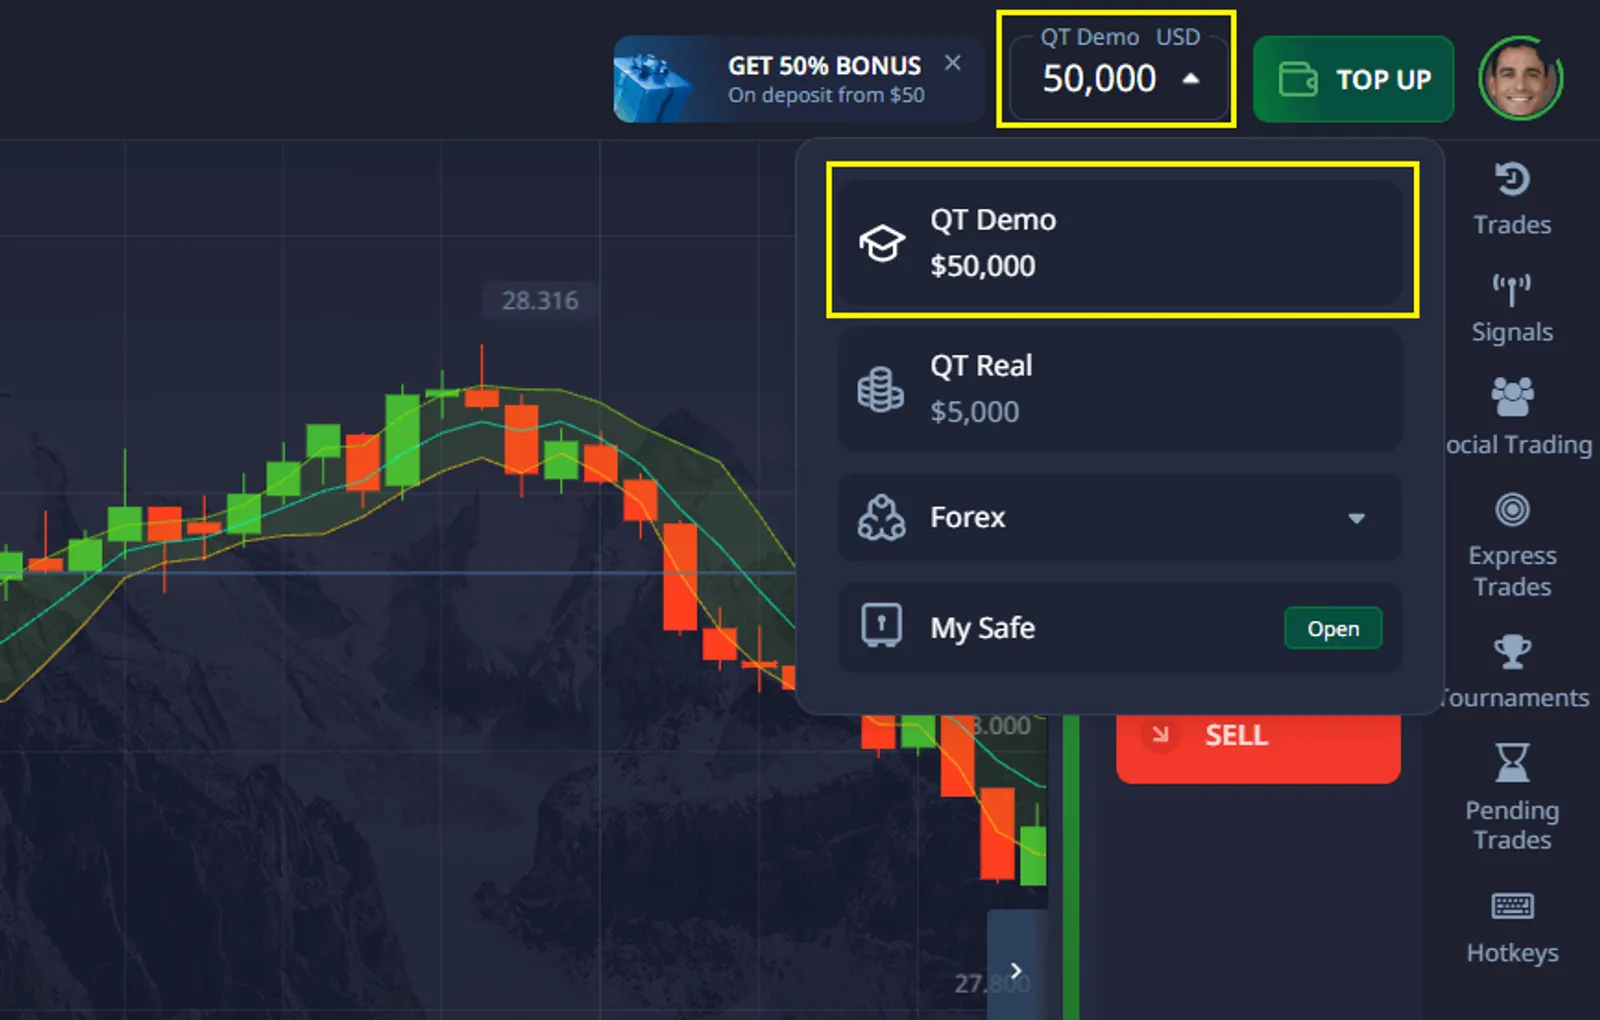
Register and test your strategies in Free Demo mode✔️
Optimizing Timeframes for Maximum Indicator Performance
The effectiveness of any indicator for Pocket Option trading varies dramatically across different timeframes.
| Trading Timeframe | Best Indicators | Recommended Expiry | Signal Quality |
|---|---|---|---|
| 1-minute charts | RSI, Bollinger Bands | 1-3 minutes | Moderate |
| 5-minute charts | MACD, Stochastic, Parabolic SAR | 15-30 minutes | Good |
| 15-minute charts | Moving Averages, RSI, ADX | 30-60 minutes | Very Good |
| 1-hour charts | Ichimoku Cloud, MACD, Fibonacci | End of day | Excellent |
Multi-Timeframe Analysis for Precision Entries
Advanced traders use multi-timeframe analysis to improve signal quality: identify the daily trend direction, confirm momentum on hourly charts, then use the best Pocket Option indicator on 5-minute charts for precise entries. This approach can increase win rates by 15-20% compared to single-timeframe strategies.
Practical Implementation: From Theory to Execution
Pocket Option indicator trading requires practical considerations beyond theoretical knowledge:
- Backtest indicator settings across different market conditions before live trading
- Start with 2-3 complementary indicators rather than overcrowding charts
- Document specific entry and exit rules to prevent emotional override
Daha fazlasını gör:investmentindicatorstrategyInterestingTrading platforms