Fractals in Trading: Meaning and Practical Patterns
The phenomenon of nature repeats itself everywhere. For example, the shape of a fern leaf is similar to the shape of the whole fern plant. The jagged coastline looks the same from space or if viewed from the shore. French mathematician Benoit Mandelbrot named those patterns fractals, arguing that the financial markets follow the same rules. Many beginners first ask: what are fractals in trading? This short guide will explain the fractal in trading terms, the way a fractal indicator works on Pocket Option charts, and how to combine fractal signals with the trend and other indicators. The focus is as practical as possible: what can and what cannot be learned using fractals in trading.

What Fractals Mean in Trading
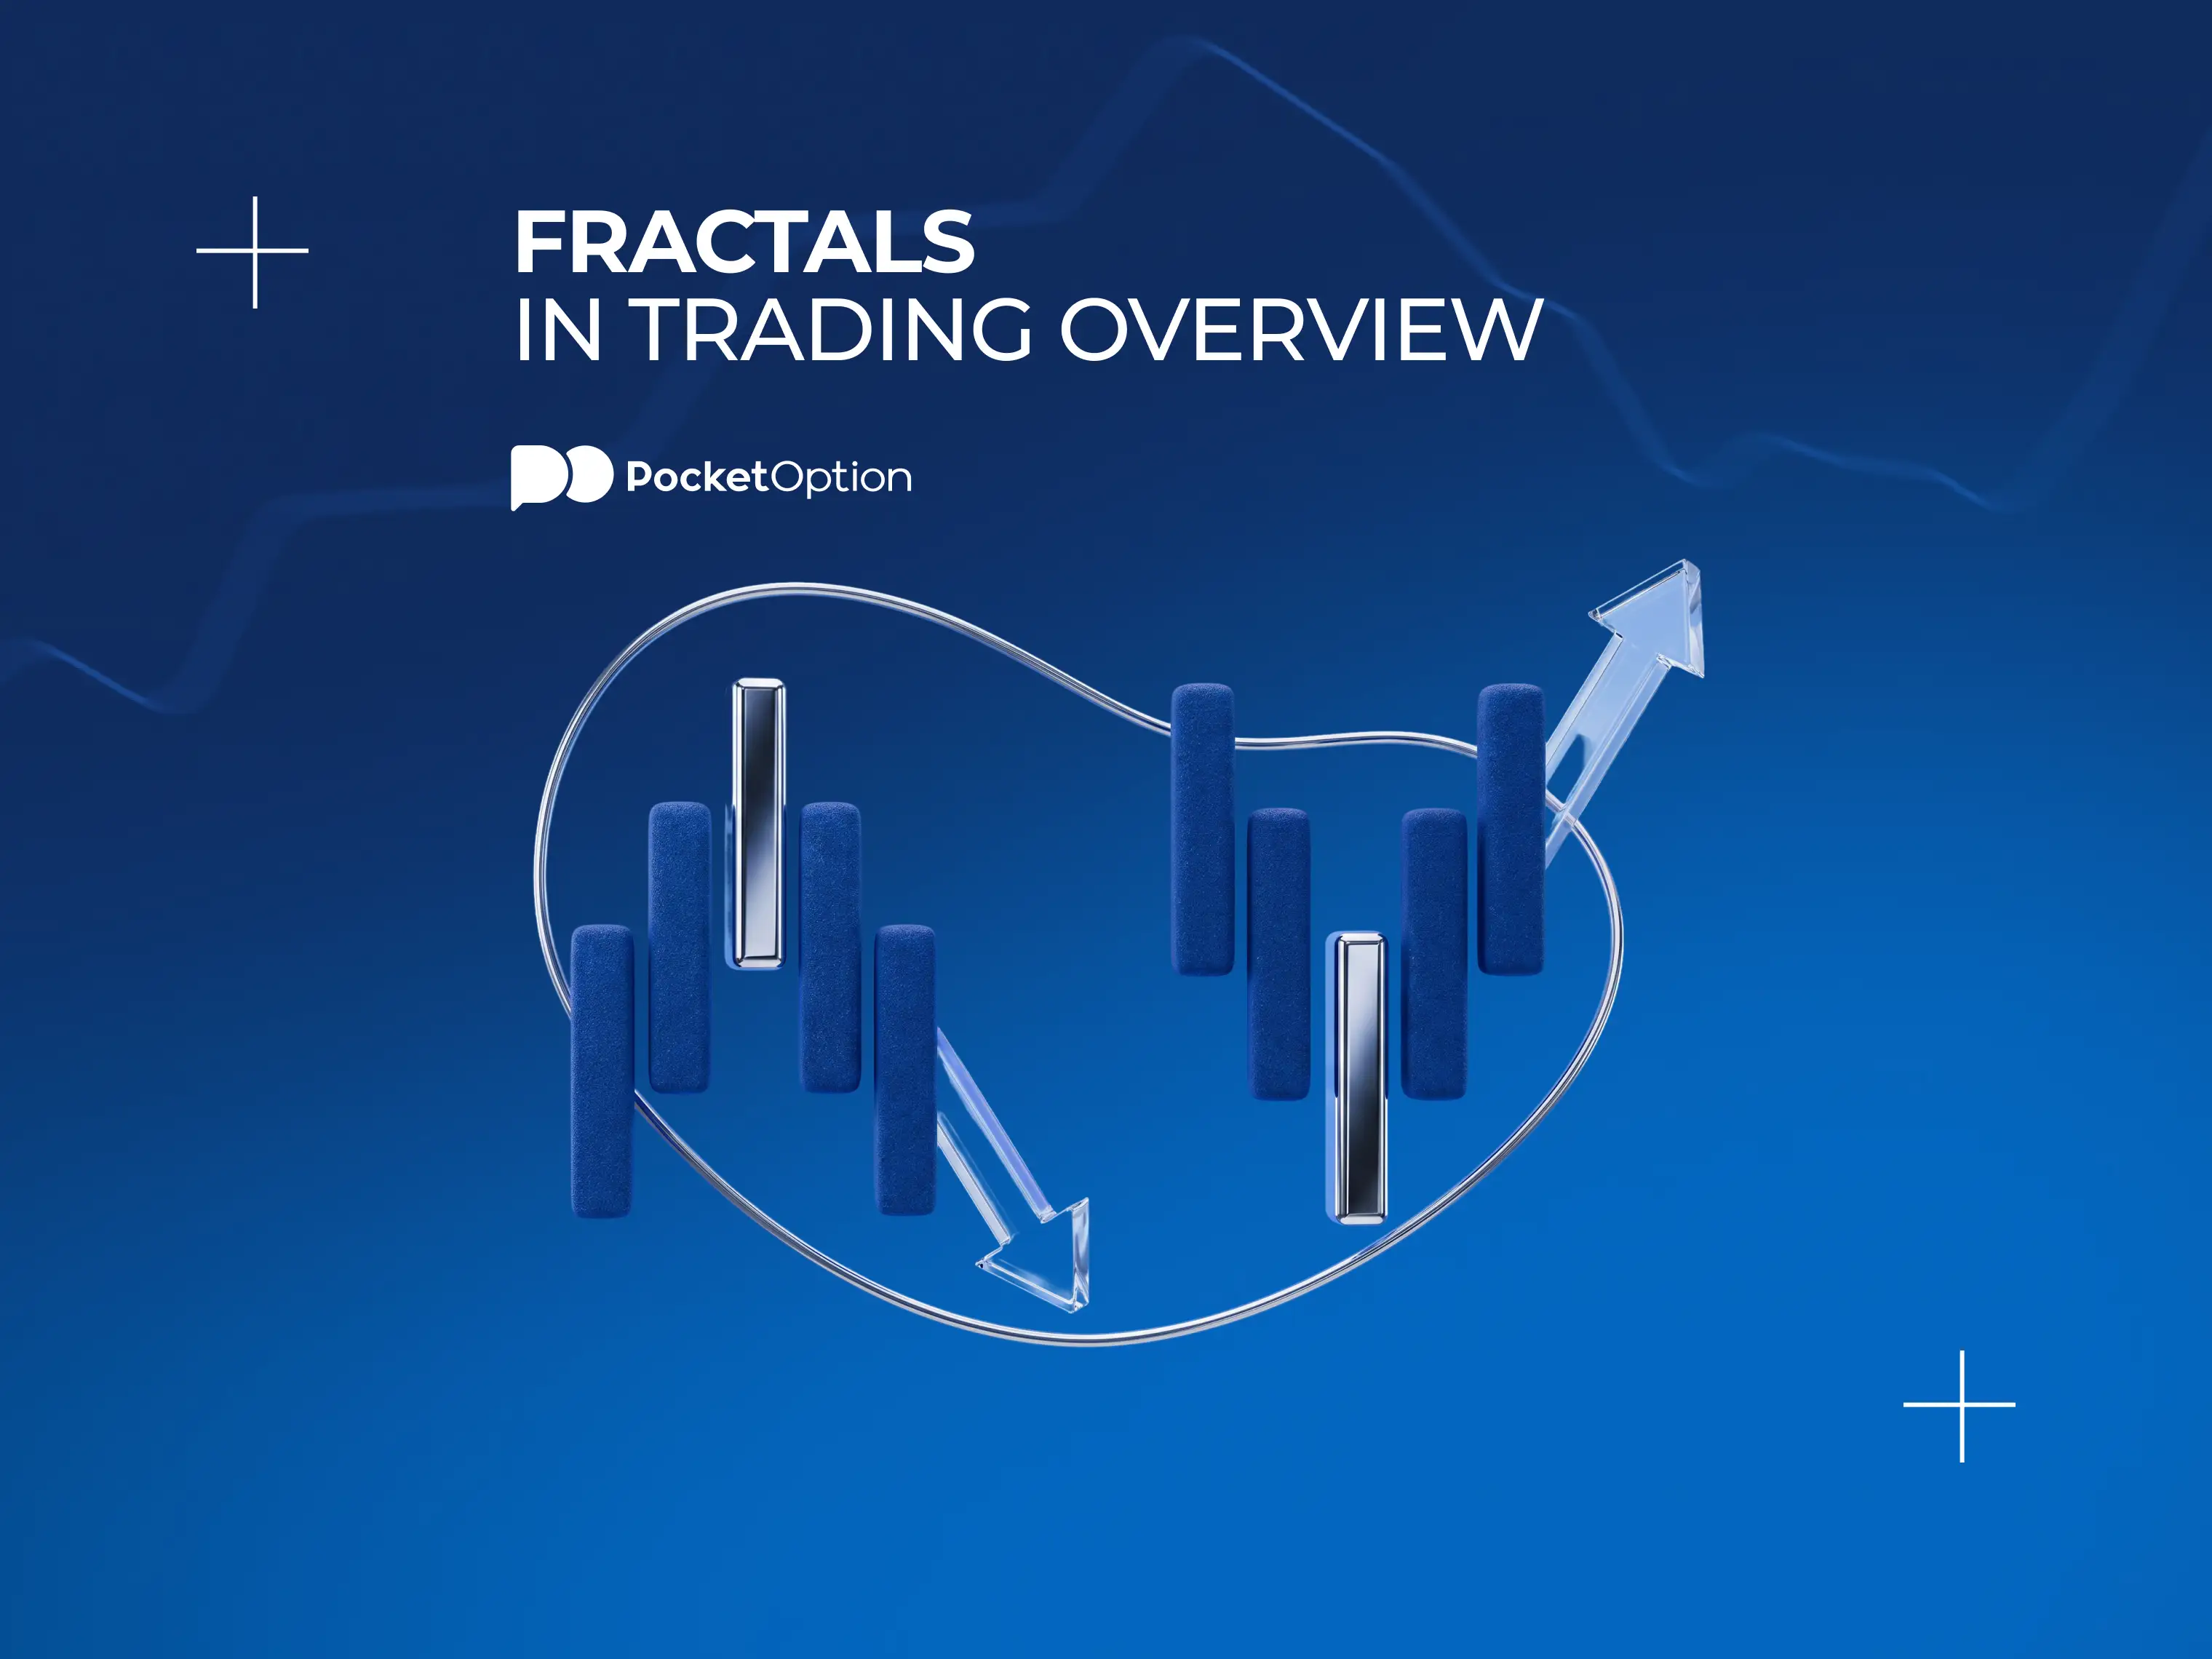
So, what does fractal mean in a trading context? ln geometry, fractal is a repeating pattern of similar shapes at different scales. However, the term fractal used in trading has a more specific meaning: it refers to a five-bar pattern that marks a local swing high or swing low after the pattern has been confirmed.
The term fractal has been popularized and defined by Bill Williams in his book Trading Chaos in 1995. Williams’ definition of a fractal is a sequence of five consecutive bars in which a middle bar has the highest high (bearish fractal) or the lowest low (bullish fractal) in relation to the left and right bars. This definition has remained the one most often adopted by all charting tools on any trading platform until this date. Pocket Option is no exception.
How the Fractal Indicator Marks Swing Points
The use of the fractal indicator allows the automatic identification of fractals. Upon their appearance, the indicator draws an arrow either up for the bullish fractal or down for bearish fractal to mark its presence.
The indicator has a two-candle delay. A fractal on candle N is confirmed only after the next two candles have closed, so it should not be treated as valid before then.
Bullish and Bearish Fractal Patterns in Simple Terms
A bullish fractal occurs when the fractal candle has the lowest price in the five-bar scheme. Once confirmed, it marks a local swing low that can be used as a reference point when analysing support.
A bearish fractal, on the contrary, is formed when the fractal candle has the highest price in the scheme. Once confirmed, it marks a local swing high that can be used as a reference point when analyzing resistance.
Thus, any chart will show a multitude of the fractals. A lot of them will hardly make any sense by themselves. For example, that fractal might not be useful in the case of a strong downtrend.
One important feature is that fractals can appear on consecutive candles. Repeated bullish fractals around the same level show that several local swing lows have formed in that area. Repeated bearish fractals similarly mark an area where several local swing highs have formed. These clusters can be used as reference zones for further analysis.
Why Fractals Work Best with Trend and Context
What traders should understand is that fractals are markers of the location where price action happened rather than indicators of the direction of price movement. In addition, the presence of a fractal near a support level or moving average adds much more importance to it than being placed in the empty space of a chart.
The trend context for fractals assumes answering one important question: where did the confirmed fractal form in relation to the broader trend? A bullish fractal near a rising trend line marks a local swing low within that structure. A bullish fractal during a strong downward move simply marks another completed local swing and should not by itself be interpreted as evidence of a reversal.
Turning on the Fractal Indicator on Pocket Option Charts
To begin, access the Pocket Option trading terminal and identify your asset for trading.
For the next step, go to the indicators tab in the Pocket Option trading terminal.
Look for the term "fractals" or "Williams fractals" from the list of indicators, and include the term in your trading.
Once you do that successfully, small arrows will be visible at the top and bottom of a candle where fractals are established.
Furthermore, you can change the time frame by reducing it to observe how the density of fractals changes – the smaller the time frames of the chart, the more fractals it would have; the longer the time frame is, the fewer fractals will normally appear, with each one representing price action over a longer period.
Start practicing now
Try Demo AccountReading Fractal Arrows Across Different Time Frames
Multi-time frame technical analysis allows traders to compare confirmed swing points across different chart scales. A fractal on a 15-minute chart marks a local swing on that timeframe. If a confirmed fractal on a higher timeframe appears around the same price area, the overlap can be used as additional structural context rather than as a prediction of what price will do next.
The practical way is recognizing the fractals from a higher time frame, (like daily or H4 charts), then switching to a lower time frame, (like M15 or H1), in order to know when to enter the market. The higher timeframe provides broader structural context, while the lower timeframe shows more detailed price action around the same reference area.
For example, if a new bullish fractal is later confirmed near 1.0750 on the 1H chart, both timeframes have recorded local swing lows around the same price area. This creates a multi-timeframe reference zone for further analysis.
This works conversely as well. For instance, suppose we have a daily bearish fractal at 1.0900 level, and the same level is being shown as bearish fractal in the 1H chart as well, then we have confirmation of resistance on both time frames. This creates another example of the same price area appearing as a confirmed swing reference on more than one timeframe. Whether a trade is taken still depends on the trader's broader setup and confirmation rules.
Using Fractals to Mark Support and Resistance Zones
Each fractal indicates an area of price reversal, however small the movement of the price. If enough fractals appear for the same price level, you would have defined levels of support and resistance not by a straight line, but with the help of market behavior. These zones are based on previously formed price swings rather than on an arbitrary horizontal line.
The suggested step: view the recent data for the last 1-3 months and put horizontal rectangles near the level where 2 or more fractals clustered. These rectangles will show you the zones identified with the help of fractals. When several confirmed fractals cluster around the same price, the area can be marked as a historical reference zone. The number of previous fractals does not guarantee that price will react there again.
You need to mark the top three to five clusters on your chart - this would include the most visible areas where confirmed fractal swing points have repeatedly clustered. Ignore all those isolated fractals located far from any other structural feature.
Using Fractals as Reference Points with Other Analysis
Confirmed trading fractals are better treated as reference points within a broader setup rather than as standalone predictions of future price direction::
Determine the broader trend on a longer timeframe.
Mark confirmed fractal swing highs and swing lows around relevant support or resistance areas.
Observe how price behaves if it later returns to one of these reference areas.
Use separate confirmation rules before deciding whether a trade fits the strategy.
This approach keeps the fractal in its correct role: it identifies where a local swing has already formed, while trend, price action, and other tools provide the context for any later decision.
Fractal Breakout Ideas Around Recent Highs and Lows
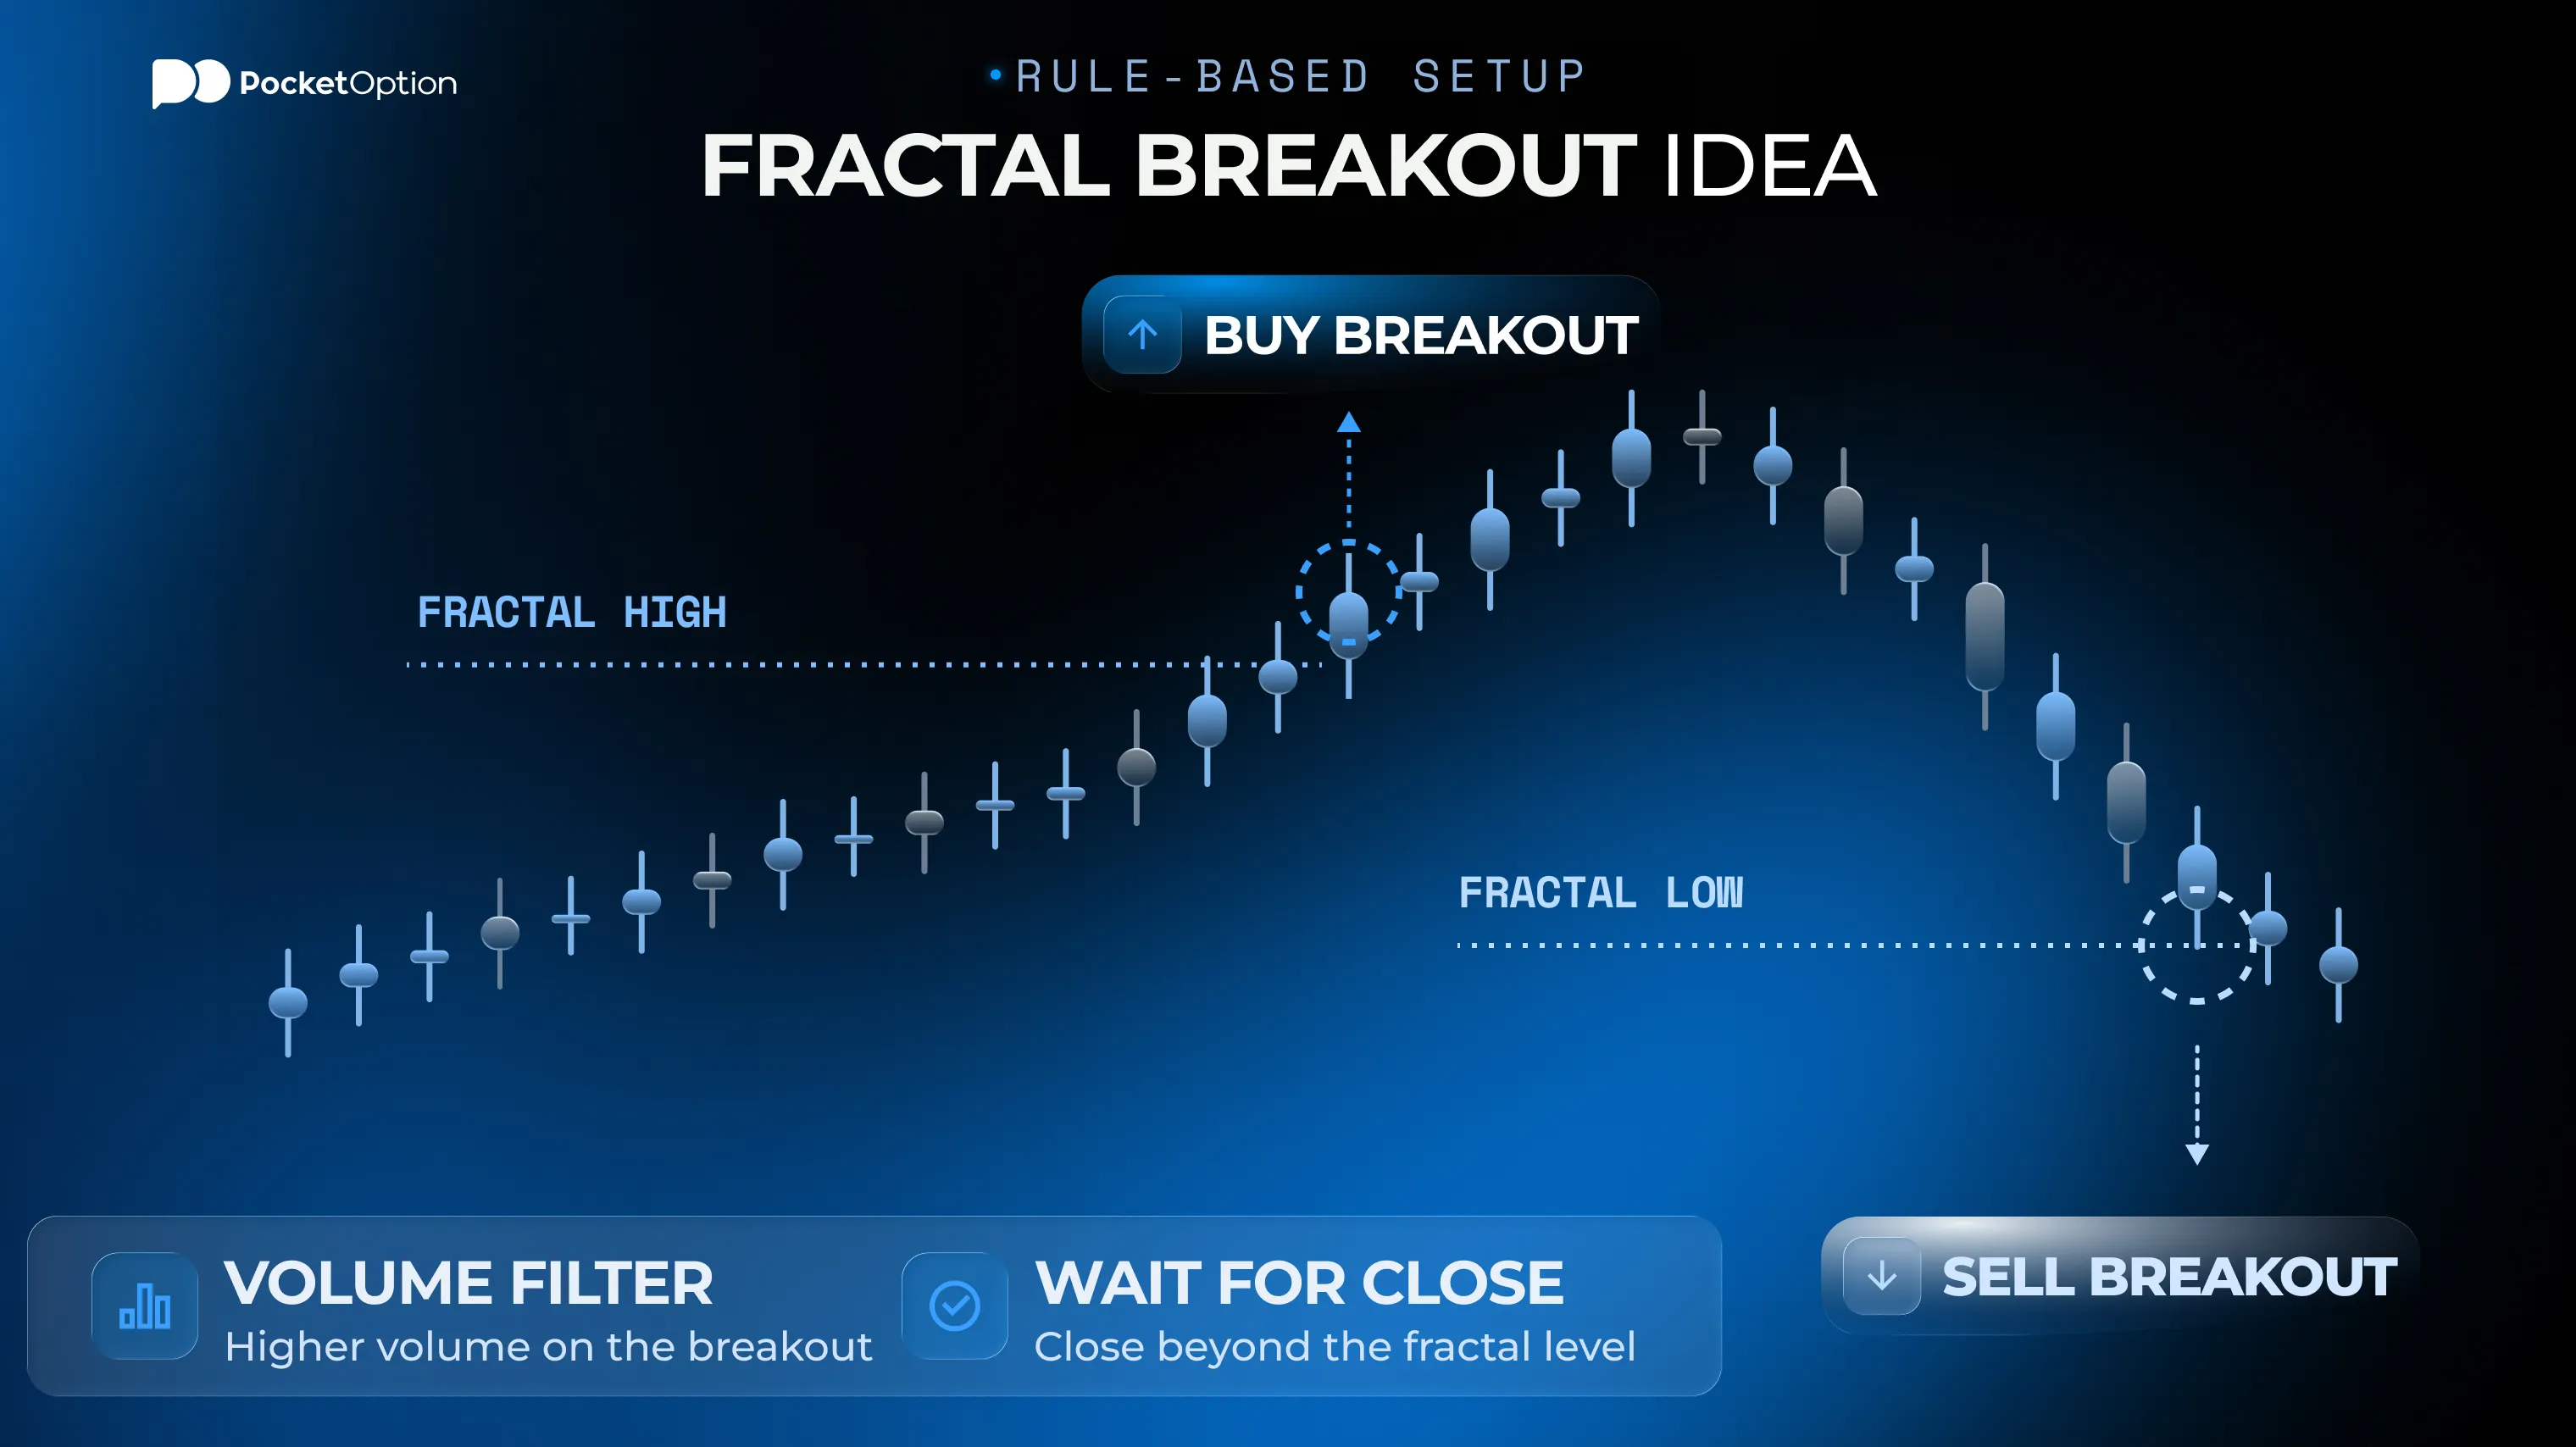
A confirmed fractal high or low can also be used as an objective reference level. If price later moves beyond that level, it shows that price has crossed a previously formed local swing point. This observation can be included in a broader breakout setup, but the fractal itself does not provide a standalone entry signal.
Bill Williams used fractal levels together with the Alligator as part of a broader trading framework. In that approach, traders observed breaks of previously confirmed fractal levels while also considering the state of the Alligator. The fractal marked the historical swing level; the complete setup depended on additional conditions.
Nonetheless, false breakouts can occur when prices exceed levels defined by a fractal long enough for entry signals to be triggered and then reversed. Some traders add a volume filter or wait for a candle close beyond the level to reduce sensitivity to brief price breaches, although these additional conditions cannot eliminate false breakouts.
Combining Fractals with Other Indicators on Pocket Option
Combination | How It Works | What It Adds |
|---|---|---|
Combination of Fractals and Moving Averages | Use confirmed fractal swing points as reference levels while the moving average provides information about the broader trend direction. | Trend context around an already formed swing point. |
Combination of Fractals and RSI | Compare a confirmed fractal swing point with the current RSI reading to add momentum context. | Additional information about momentum; it does not turn the fractal into a reversal prediction. |
Combination of Fractals and MACD Divergence | Compare confirmed fractal swing highs or lows with MACD divergence to study whether momentum behaviour supports or conflicts with the surrounding price structure. | Additional momentum context around a confirmed swing point, without guaranteeing a reversal. |
Combination of Fractals and Alligator | In Bill Williams' framework, confirmed fractal levels are analysed together with the position and direction of the Alligator lines. | Additional trend-state context for interpreting previously formed fractal levels. |
A moving average can add trend context to a confirmed fractal level, while RSI or MACD can provide additional momentum information. None of these combinations makes a fractal predictive; they simply add context around a swing point that has already formed.
with Pocket Option indicators
Register NowRisk Management When Using Fractals on Pocket Option
On Pocket Option Quick Trading, a conventional Stop Loss or Take Profit attached to an open position is not used in the same way as in a classic forex position. Quick Trading uses a predefined trade amount and a fixed expiration time, so risk should be controlled primarily through the amount committed to each trade and the rules of the tested setup.
A confirmed fractal can still be used as a chart reference when analysing where a local swing has formed, but it should not be treated as an automatic exit level.
If the same fractal analysis is applied through MT4/MT5 or another position-based trading mode, classic position-management rules may be used separately. For example, a trader may define a Stop Loss beyond a previously confirmed swing point and calculate a Take Profit using a chosen risk-to-reward ratio such as 1:2. These mechanics apply to that position-based trading mode and should not be presented as Quick Trading functionality.
Backtesting Fractal Patterns on Historical Charts
Fractal analysis can be performed in order to conduct manual backtesting. You need to go through and mark confirmed fractals as to whether they have been significant or not over the past 3−6 months. After recording more than 50 examples, you can compare how fractals at support or resistance levels perform against those appearing in open chart space.
You have to begin recording the type of fractal (upward/downward), position (relative to S/R), overall trend (with or against) and outcome.
for free, with unlimited funds
Get StartedConclusion
The fractal indicator provides a straightforward way to mark confirmed local swing highs and swing lows on a price chart. The five-bar pattern is displayed only after the required candles have formed, so a fractal is best treated as a historical structural marker. Confirmed fractal levels can then be used as reference points when analysing support and resistance, trend context, or later price behaviour.
A fractal itself does not predict a trade outcome or future price direction. Its value lies in being a reference point that can be reviewed together with trend context, support and resistance, and other analytical tools. Practice these combinations on a demo account and test them on historical charts.
Disclaimer: Trading carries a high level of risk and may not be suitable for everyone. Never trade with money you cannot afford to lose. This content is provided for educational and informational purposes only. It does not constitute financial, investment, or trading advice, nor a recommendation to buy or sell any instrument. Do your own research before acting.
See more:InterestingTrading Strategies