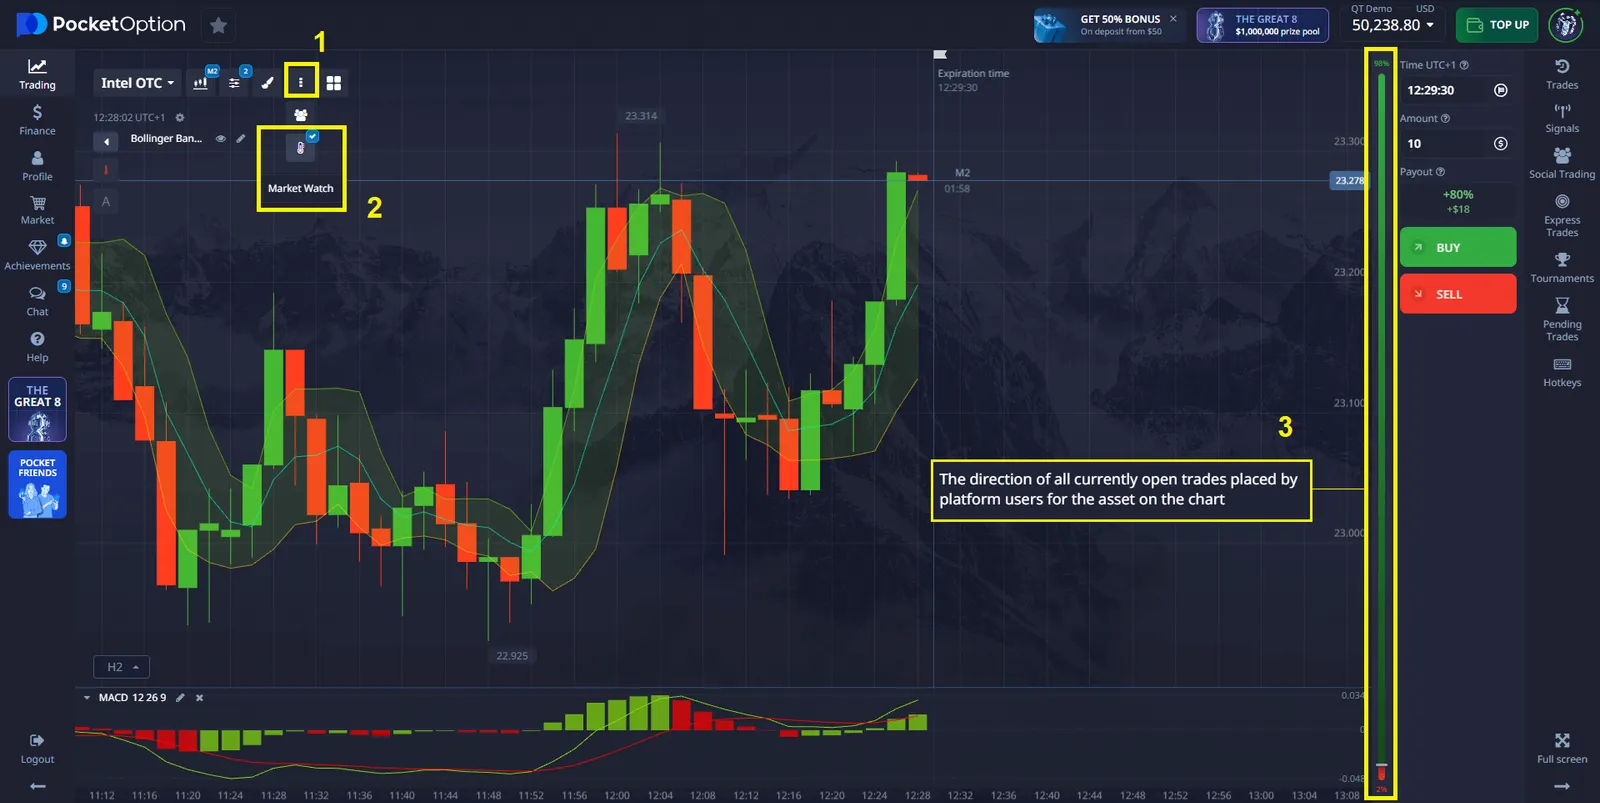
- Truy cập vào phần “Theo dõi thị trường”.
- Kích hoạt nó để nhận dữ liệu theo thời gian thực về giá tài sản, xu hướng và khối lượng giao dịch.
- Chọn các tài sản bạn muốn theo dõi và sử dụng thông tin để đưa ra quyết định mua hoặc bán.
Làm Chủ Chỉ Báo Mua Bán Pocket Option

Nền tảng Pocket Option cung cấp cho các nhà giao dịch nhiều công cụ để đưa ra quyết định sáng suốt về việc mua và bán tài sản. Thay vì chỉ đơn giản mua hoặc bán, người dùng dự đoán liệu giá tài sản sẽ tăng hay giảm. Nếu dự đoán chính xác, họ có thể kiếm lợi nhuận lên đến 92%. Trong bài viết này, chúng tôi sẽ xem xét các công cụ chính trên nền tảng Pocket Option có thể giúp cải thiện giao dịch của bạn.
1. Theo dõi thị trường
Nhiều nhà giao dịch chỉ cần nhìn vào chỉ báo theo dõi thị trường để quyết định liệu có nên mua hay bán một tài sản. Tính năng Theo dõi thị trường trên Pocket Option cho phép các nhà giao dịch giám sát các xu hướng thị trường hiện tại theo thời gian thực. Bạn có thể theo dõi giá tài sản, khối lượng giao dịch và biến động thị trường để cập nhật về điều kiện thị trường mới nhất.
Để kích hoạt tính năng này:
2. Tín hiệu Pocket Option
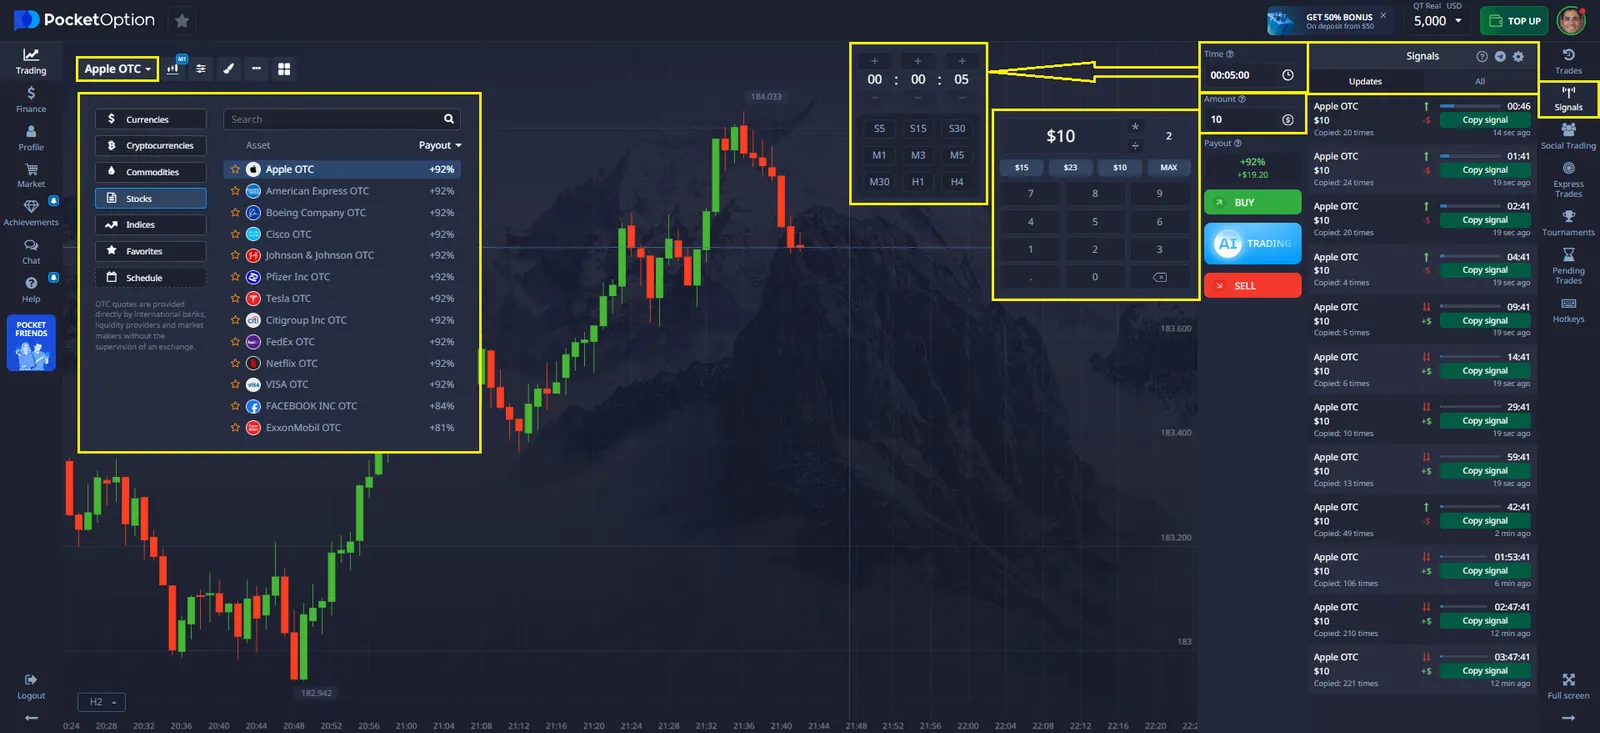
Tín hiệu là các khuyến nghị tự động hiển thị các hướng thị trường có thể xảy ra. Khi một tín hiệu xuất hiện trên biểu đồ, nó có thể gợi ý liệu có nên mua hay bán một tài sản dựa trên hướng của mũi tên.
Làm thế nào để sử dụng tín hiệu trên Pocket Option?
- Bật tín hiệu: Vào phần “Tín hiệu” trên nền tảng Pocket Option và kích hoạt chúng. Điều này sẽ cho phép các mũi tên xuất hiện trên biểu đồ của bạn.
- Quan sát mũi tên: Mũi tên hướng lên báo hiệu mua tiềm năng, trong khi mũi tên hướng xuống báo hiệu bán tiềm năng.
- Đánh giá tín hiệu và thực hiện giao dịch: Khi tín hiệu được kích hoạt, bạn có thể đặt lệnh giao dịch bằng cách chọn “Mua” hoặc “Bán” tùy thuộc vào hướng của mũi tên.
Tín hiệu chỉ báo mua bán Pocket Option là một công cụ hữu ích để xác định các điểm vào và ra tiềm năng, nhưng chúng hoạt động hiệu quả nhất khi kết hợp với các chỉ báo khác và phân tích thị trường của riêng bạn.
3. Chỉ báo trên Pocket Option
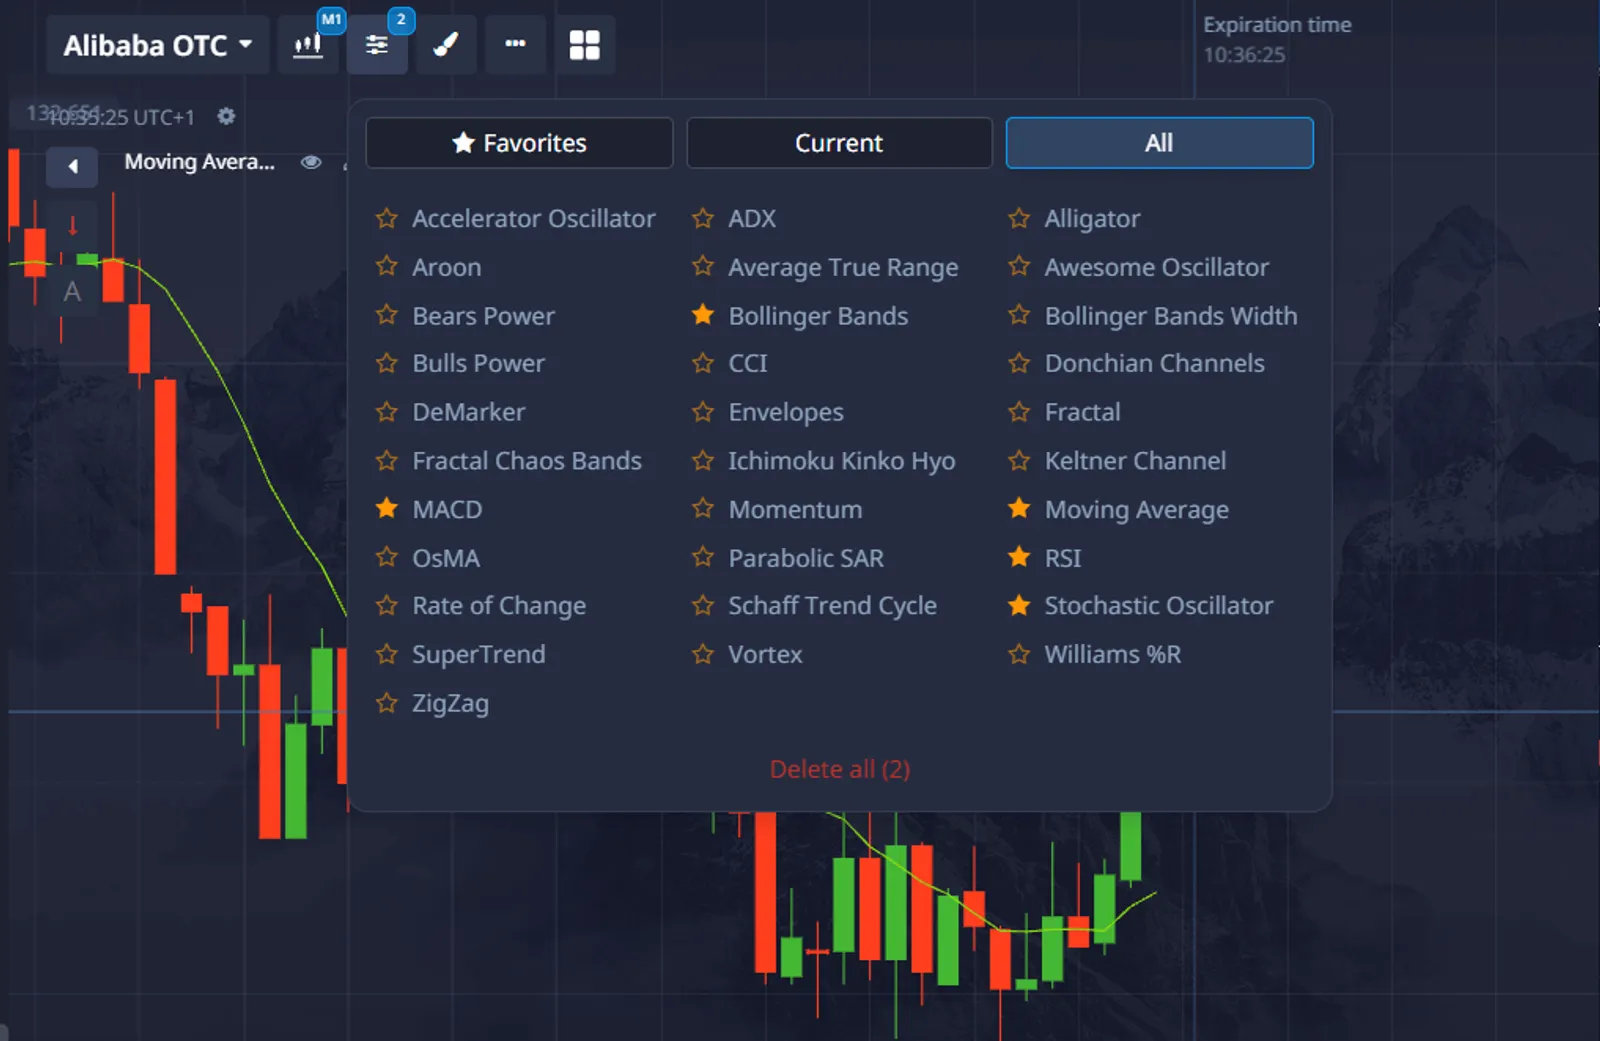
Chỉ báo là các công cụ phân tích giúp các nhà giao dịch đánh giá xu hướng thị trường, động lượng giá và khả năng đảo chiều. Chúng được chia thành hai loại: chỉ báo theo xu hướng và chỉ báo động lượng và đảo chiều.
Chỉ báo theo xu hướng
Những chỉ báo này hoàn hảo để xác định hướng thị trường, giúp bạn đứng đúng phía của xu hướng.
- MACD (Moving Average Convergence Divergence) — giúp xác định động lượng và hướng xu hướng bằng cách sử dụng các giao cắt đường.
- SuperTrend — vẽ một đường màu thay đổi từ đỏ sang xanh lá cây khi xu hướng thay đổi, cung cấp tín hiệu rõ ràng để vào thị trường.
- Parabolic SAR — đặt các chấm thay đổi vị trí khi xu hướng thay đổi, lý tưởng để xác định điểm thoát.
Bảng 1: Chỉ báo theo xu hướng
| Chỉ báo | Thiết lập | Tài sản lý tưởng | Thời gian hết hạn |
|---|---|---|---|
| MACD | Nhanh: 12, Chậm: 26, Tín hiệu: 9 | Cặp tiền tệ chính, Hàng hóa | 15-30 phút |
| SuperTrend | Chu kỳ: 10, Hệ số nhân: 3 | Tiền điện tử, Chỉ số | 5-15 phút |
| Parabolic SAR | Bước: 0.02, Tối đa: 0.2 | Cặp tiền tệ chính | 5-15 phút |
Chỉ báo động lượng và đảo chiều
Những chỉ báo này giúp xác định thời điểm hướng giá có thể thay đổi, cũng như xác định các điều kiện mua quá mức hoặc bán quá mức trong thị trường.
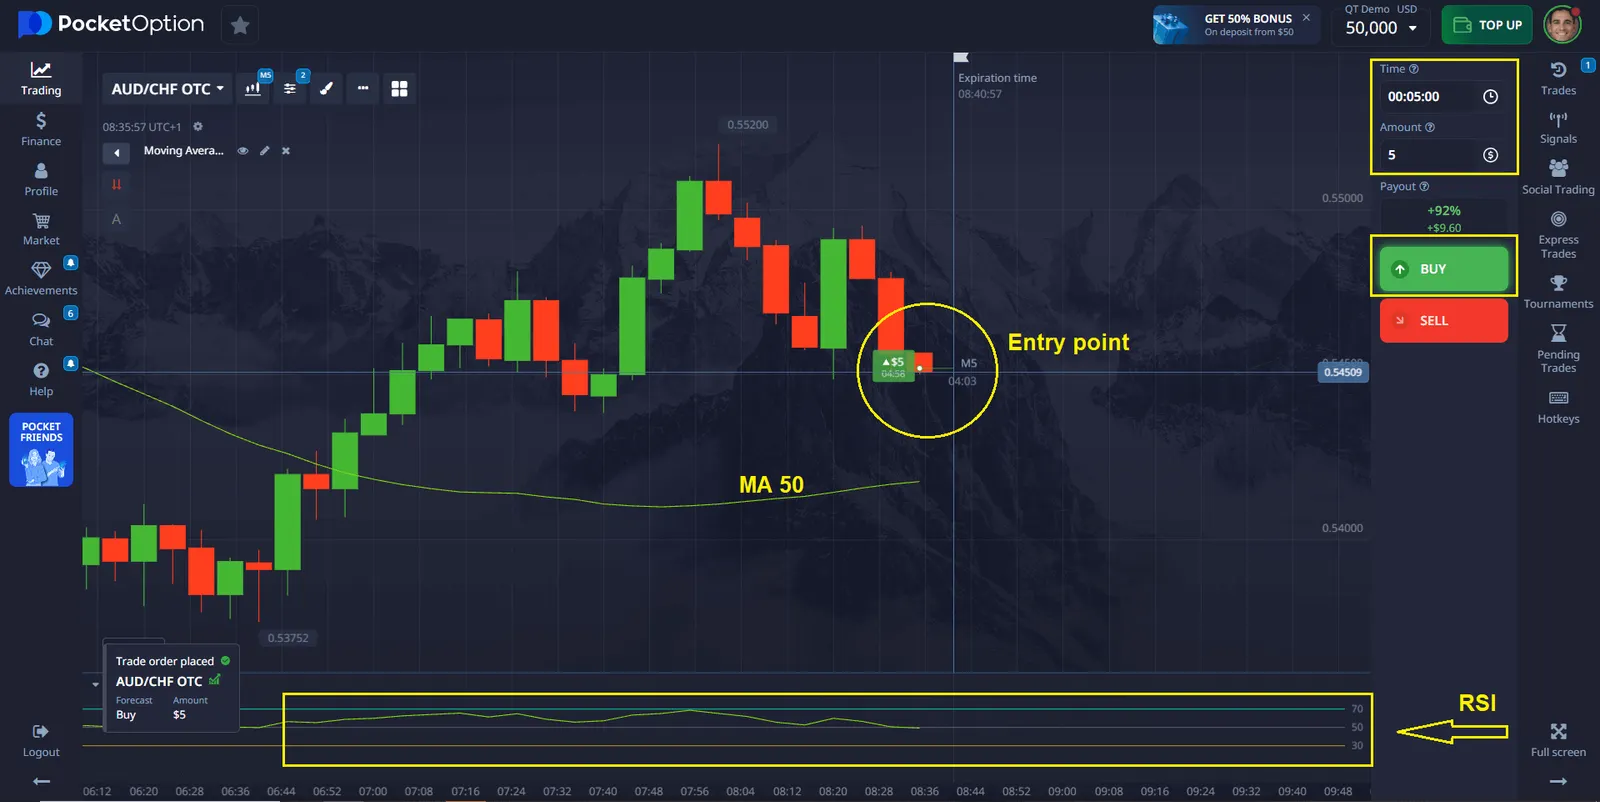
- RSI (Chỉ số sức mạnh tương đối) — đo lường động lực giá trên thang điểm từ 0 đến 100, trong đó giá trị dưới 30 có thể báo hiệu mua và giá trị trên 70 có thể báo hiệu bán.
- Dao động Stochastic — so sánh giá đóng cửa hiện tại với phạm vi giá trong một khoảng thời gian nhất định. Nó tạo ra tín hiệu khi các đường cắt qua các mức quan trọng như 20 (bán quá mức) hoặc 80 (mua quá mức).
- Dải Bollinger — tạo ra các mức hỗ trợ và kháng cự động dựa trên biến động thị trường, giúp xác định thời điểm mua hoặc bán.
Bảng 2: Chỉ báo động lượng và đảo chiều
| Chỉ báo | Tín hiệu mua chính xác | Tín hiệu bán chính xác | Tỷ lệ thành công |
|---|---|---|---|
| RSI | Vượt trên 30 sau phân kỳ tăng giá | Giảm xuống dưới 70 sau phân kỳ giảm giá | 65-75% trên các thị trường |
| Stochastic | Đường K cắt lên trên đường D dưới mức 20 | Đường K cắt xuống dưới đường D trên mức 80 | 60-70% trên các thị trường |
| Dải Bollinger | Giá chạm dải dưới, sau đó di chuyển vào trong với khối lượng tăng | Giá chạm dải trên, sau đó di chuyển vào trong với khối lượng tăng | 55-65% trên tất cả thị trường |
2. Lịch kinh tế
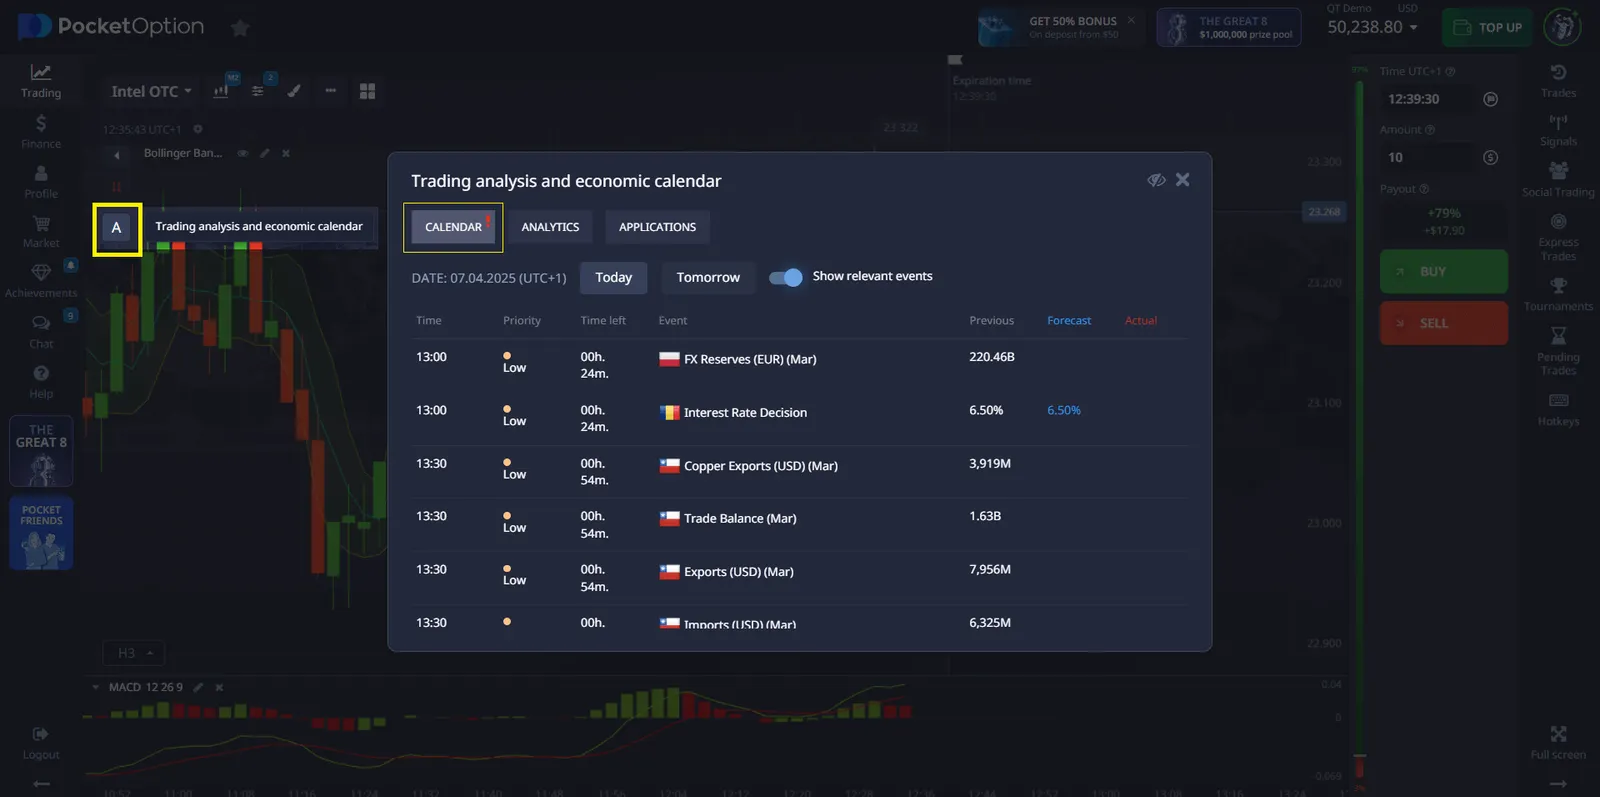
Lịch kinh tế là một công cụ quan trọng cho các nhà giao dịch, cho phép họ theo dõi các sự kiện kinh tế, tin tức và báo cáo sắp tới có thể ảnh hưởng đến thị trường. Việc biết những sự kiện này giúp dự đoán những biến động giá có thể xảy ra và cải thiện chiến lược giao dịch.
Để sử dụng lịch kinh tế trên Pocket Option:
- Mở nền tảng giao dịch.
- Truy cập vào phần “Phân tích”, nơi bạn có thể tìm thấy thông tin cập nhật về các sự kiện sắp tới.
- Sử dụng dữ liệu này để phân tích tác động của tin tức lên thị trường và đưa ra quyết định giao dịch sáng suốt hơn.
3. Mô hình nến
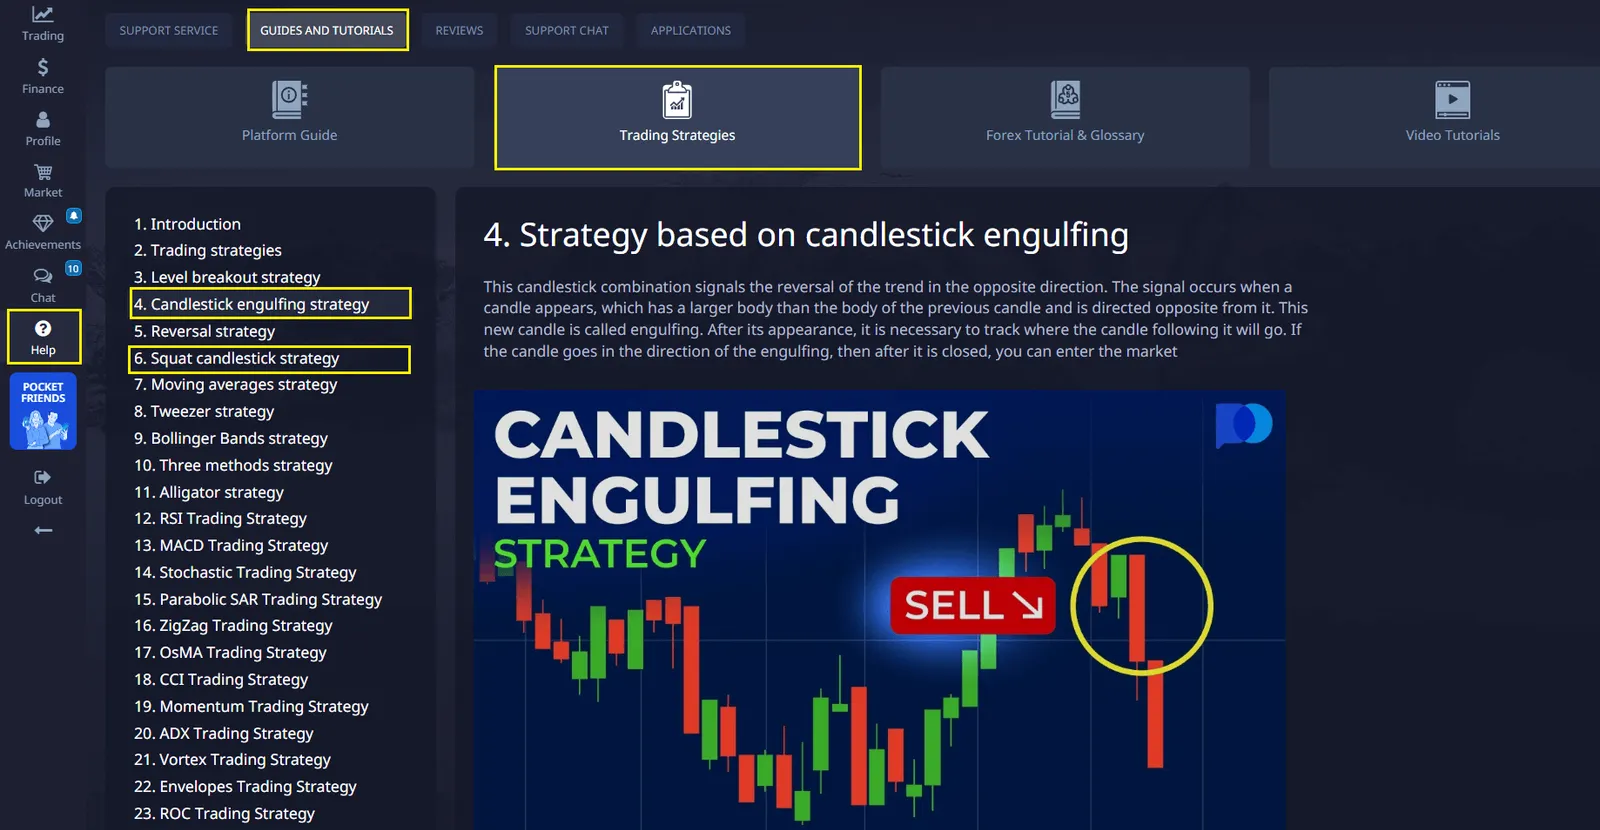
Mô hình nến là sự kết hợp của các cây nến có thể chỉ ra những thay đổi xu hướng hoặc đảo chiều trong thị trường. Chúng có thể là một bổ sung tuyệt vời cho phân tích của bạn và giúp dự đoán khi nào nên mua hoặc bán.
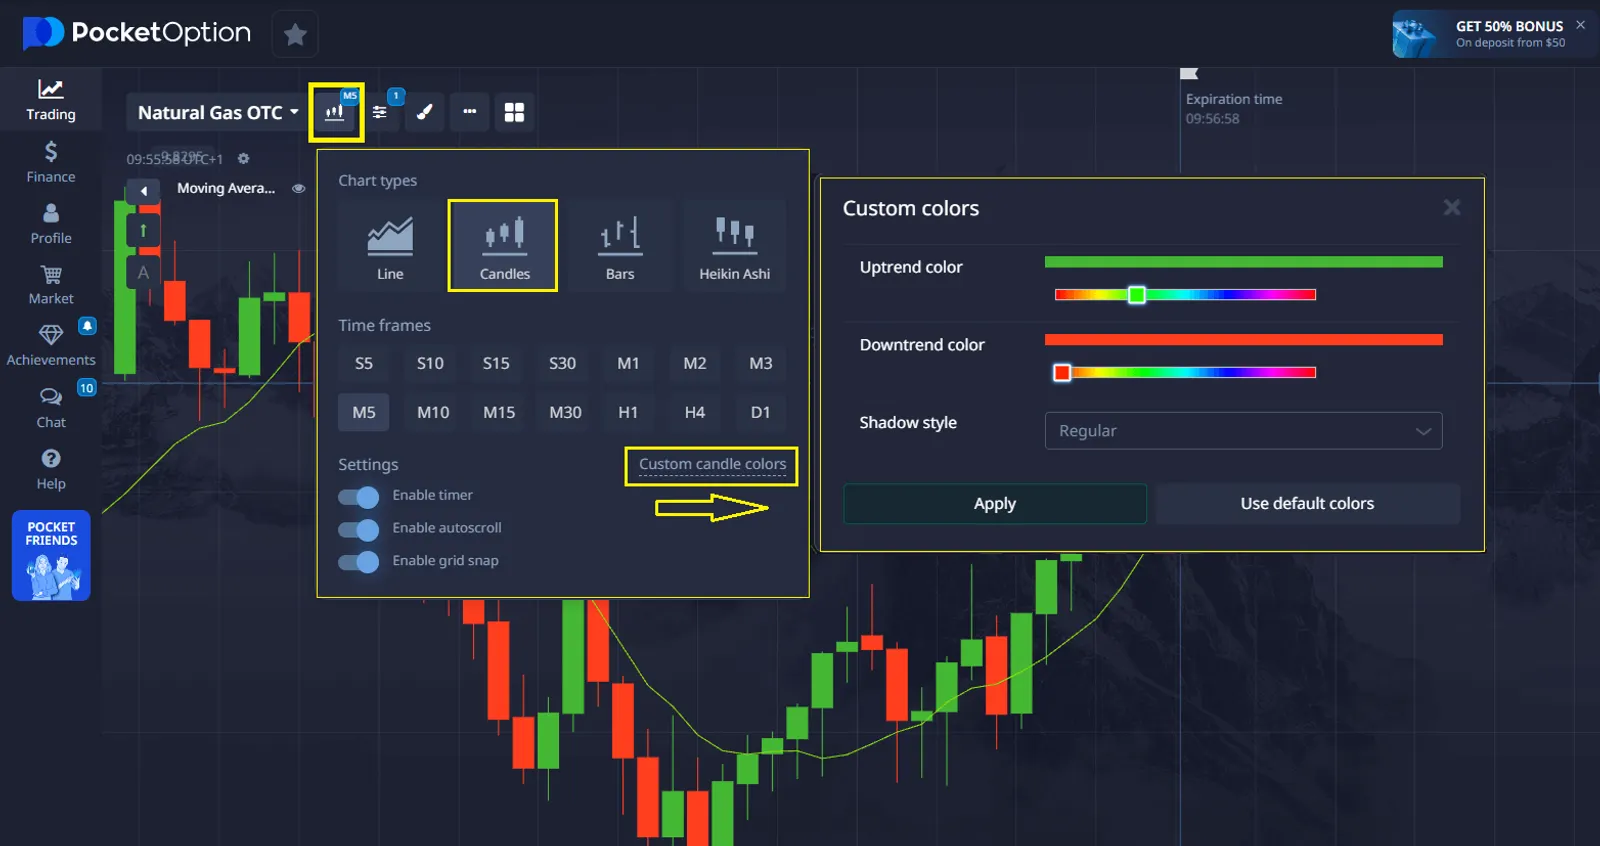
Trên Pocket Option, bạn có thể theo dõi các mô hình trên biểu đồ tài sản và phân tích chúng để xác định điểm vào hoặc ra. Các mô hình như “Doji”, “Sét”, hoặc “Nến bao phủ tăng và giảm” có thể giúp bạn xác định khi nào giá có thể đảo chiều.
Kết luận
Pocket Option cung cấp cho các nhà giao dịch nhiều công cụ, bao gồm các chỉ báo và tín hiệu, cũng như các tính năng như lịch kinh tế, mô hình nến và theo dõi thị trường, để giúp đưa ra quyết định mua hoặc bán chính xác hơn. Việc sử dụng các công cụ này sẽ cải thiện chiến lược giao dịch của bạn và tăng độ chính xác trong các quyết định giao dịch. Bắt đầu hành trình của bạn với tài khoản demo để kiểm tra các khái niệm này mà không có rủi ro tài chính, sau đó chuyển sang giao dịch thực với kích thước vị thế tối thiểu khi sự tự tin và nhất quán của bạn tăng lên.
FAQ
Chỉ báo mua bán trên Pocket Option chính xác là gì?
Chỉ báo mua bán trên Pocket Option là công cụ phân tích kỹ thuật tạo ra các tín hiệu cụ thể cho các nhà giao dịch biết khi nào có thể tham gia vào vị thế mua hoặc bán. Những chỉ báo này sử dụng thuật toán toán học để phân tích dữ liệu giá và điều kiện thị trường, tạo ra các tín hiệu trực quan (thường là mũi tên, chấm hoặc thay đổi màu sắc) trực tiếp trên biểu đồ giá để chỉ ra các điểm vào lệnh thuận lợi cho các giao dịch.
Người mới bắt đầu có thể sử dụng hiệu quả các chỉ báo mua bán nâng cao không?
Có, người mới bắt đầu có thể sử dụng các chỉ báo nâng cao, nhưng nên bắt đầu với các chỉ báo đơn giản trước. Các nhà giao dịch mới nên tập trung vào việc hiểu thấu đáo một hoặc hai chỉ báo cơ bản trước khi thêm độ phức tạp. Nên bắt đầu với các chỉ báo theo xu hướng như Đường Trung Bình Di Động hoặc MACD, sau đó dần dần kết hợp các dao động kế như RSI. Thực hành với tài khoản demo trước khi giao dịch bằng tiền thật để hiểu cách các chỉ báo hoạt động trong các điều kiện thị trường khác nhau.
Tôi có nên sử dụng nhiều chỉ báo mua bán cùng lúc không?
Sử dụng 2-3 chỉ báo bổ sung cho nhau thường hiệu quả hơn việc chỉ dựa vào một chỉ báo hoặc làm quá tải biểu đồ của bạn với nhiều chỉ báo. Điểm quan trọng là chọn các chỉ báo cung cấp các loại thông tin khác nhau - ví dụ, kết hợp một chỉ báo xu hướng (như Đường Trung Bình Di Động) với một dao động kế đà (như RSI) và một thước đo biến động (như Dải Bollinger). Quá nhiều chỉ báo có thể dẫn đến nhầm lẫn và tín hiệu mâu thuẫn.
Tôi nên điều chỉnh cài đặt chỉ báo như thế nào cho các khung thời gian khác nhau?
Khung thời gian ngắn hơn (1-5 phút) thường yêu cầu cài đặt chỉ báo nhạy hơn với chu kỳ ngắn hơn (ví dụ: 9-14 cho RSI thay vì tiêu chuẩn 14-21). Khung thời gian dài hơn được hưởng lợi từ các chu kỳ kéo dài để lọc nhiễu thị trường. Luôn kiểm tra ngược các cài đặt của bạn trên khung thời gian cụ thể mà bạn dự định giao dịch. Nhiều nhà giao dịch sử dụng ngưỡng bảo thủ hơn một chút cho các khung thời gian rất ngắn để giảm tín hiệu giả do biến động thị trường gây ra.
Làm thế nào để phân tích mô hình nến?
Mô hình nến giúp xác định các khả năng đảo chiều hoặc tiếp tục xu hướng trong thị trường. Các nhà giao dịch sử dụng chúng để đưa ra quyết định về việc tham gia hoặc thoát khỏi một vị thế.