Pocket Option Buy Sell Indicator Mastery
Buy and Sell indicators are special features that help a trader to determine possible entry and exit points for trading positions by analyzing the price chart. Here is an introduction of how the most common indicators work, and how you may use them to benefit from Pocket Option's charting tools.

What Is a Buy Sell Indicator
A buy sell indicator is an additional feature that is placed on the price chart and provides signals about possible entry or exit points depending on certain conditions that are defined beforehand. Some traders call them all Buy and Sell indicator, even though they differ in the algorithm used, or the output they provide.
The most widespread categorisation of trading indicators is the one that divides them into three big groups - trend following, momentum or reversal, and volume-based indicators. These groups answer different questions concerning the market. Trend following indicators shows the current direction of the price. Momentum indicators show whether the trend is weakening or reversing. The volume indicators are focused on the intensity of the move.
It’s wrong to compare which group of indicators is better than others - they just provide answers to different questions. The main advantage of a skilled trader lies in his ability to understand what question an indicator answers, and use it correctly.
Trend-Following Indicators for Buy and Sell Signals
Trend following indicators operate under the premise that a price movement will continue in the same direction for some time to come. They perform most effectively in markets with clear trends but are completely ineffective in a choppy or sideways market conditions. Our price-action guide is an example of this difference.
MACD
This indicator compares two moving averages. MACD line crossing above the signal line indicates that one should buy while the opposite case means that one should sell. Histogram demonstrates how strong the current momentum is.
SuperTrend
One-line indicator that is located either above or below the price, depending on the market volatility. SuperTrend changes direction in line with trend changes. The advantage of SuperTrend is that it does not require another chart.
Parabolic SAR
Indicator consists of dots which follow price and change the direction upon changing of momentum. It is most effective for setting up trailing stops but not for entries alone.
Momentum and Reversal Indicators
Trend following indicators validate what is already happening, while momentum and reversal instruments try to exploit exhaustion of momentum, and with that, to give a signal for potential price reversal or in general - market conditions change.
RSI
Relative Strength Index basically calculates the speed and magnitude of recent changes in prices with values between 0 and 100. Values over 70 indicate an overbought situation while values under 30 indicate oversold condition. However, even powerful trends may cause prices to remain overbought or oversold for quite a long time.
Stochastic Oscillator
Stochastic Oscillator evaluates how the closing price compares to its range. The speed is its strong side - it is good at detecting quick reversals, but is subject to producing wrong signals in bigger trends.
Bollinger Bands
Bollinger Bands present moving averages along with bands plotted based on the level of volatility. Contacting the outside bands is not a sign of reversal on its own - Bollinger Bands are usually used in conjunction with a momentum indicator.
Buy vs Sell Volume Indicators
Directionality is indicated by price and momentum tools, but they don’t tell anything about the strength of that movement. A Buy Sell Volume Indicator resolves this issue by answering - how much there was buying compared to selling during a certain period of time.
Viewing a buy vs sell volume indicator as two separate bars makes the imbalance clear at first sight, and with that, decision can be made fast. A buy volume vs sell volume indicator comes handy when trading breakouts because often the volume precedes the price movement. For more detailed information about proper application, please refer to our volume indicator guide.
Note: volume data can be hard to compare across instruments and locations due to the fact that volume is only part of trading activity in that instrument. Comparing volume relative to its own history is better than comparing absolute values across different unrelated instruments.
Reading Market Watch and Live Signals
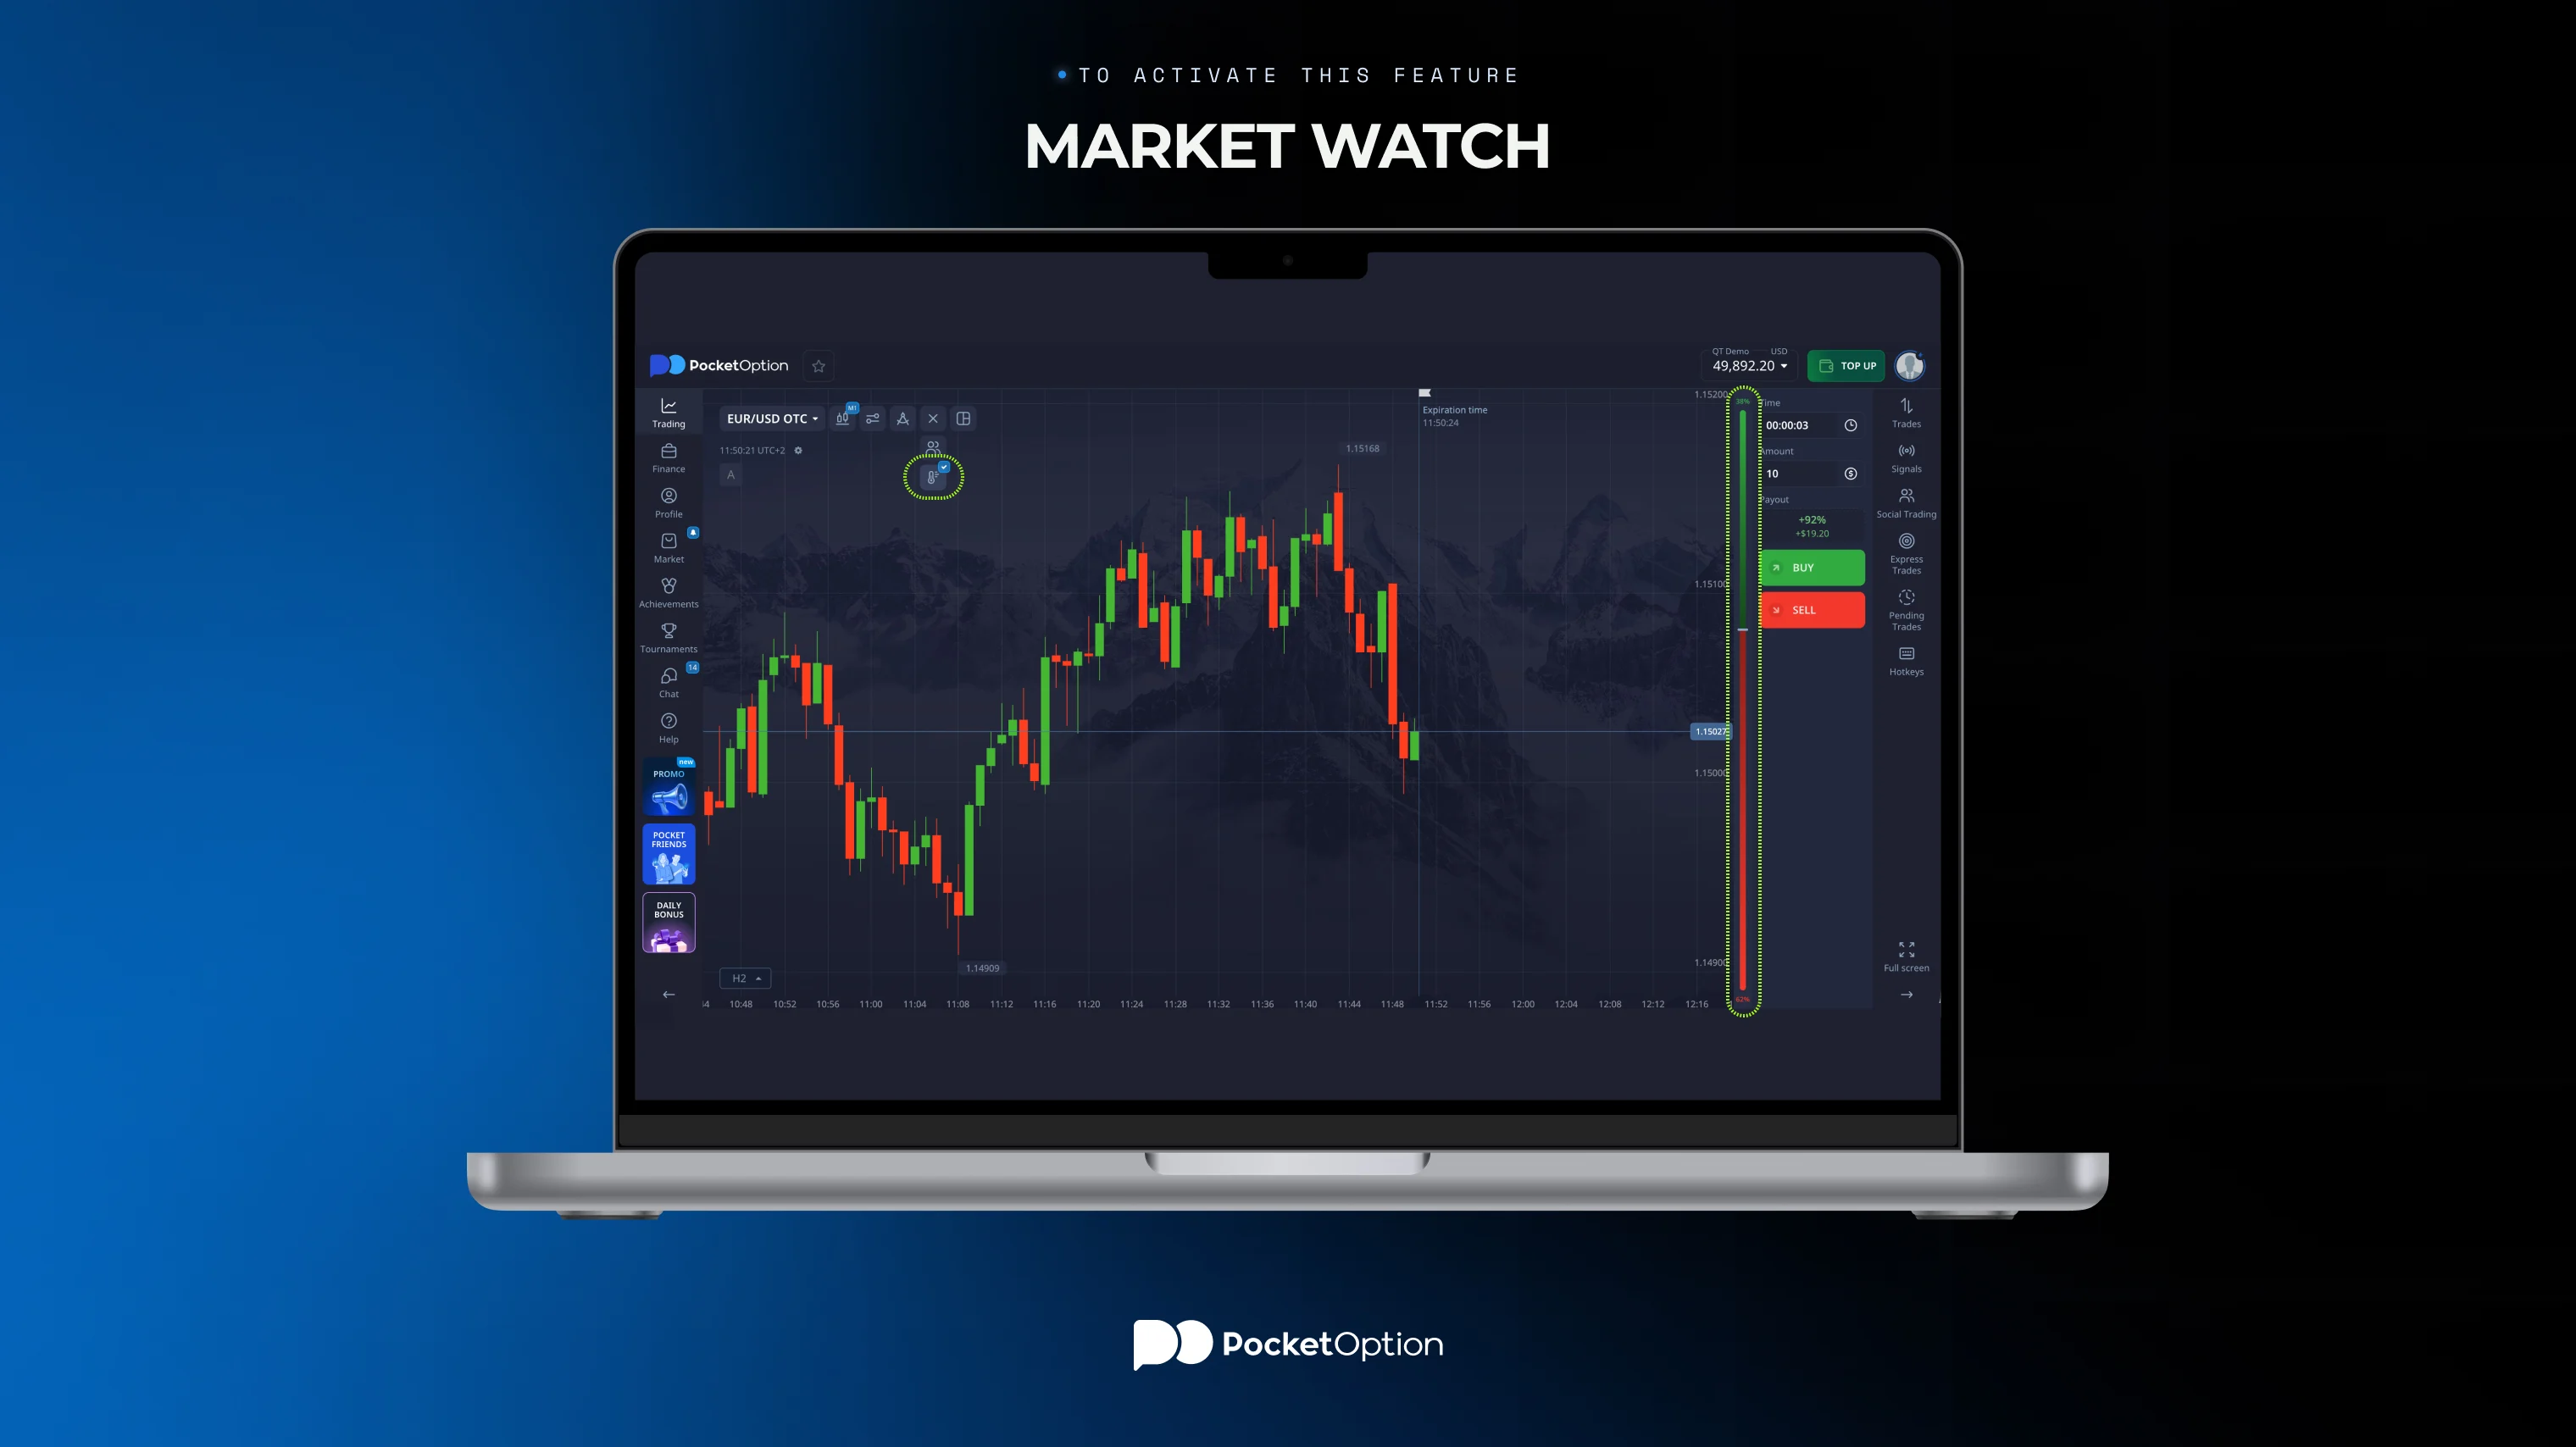
A market watch panel consists of several indicators with an instant overview of every indicator. Live trading signals from the watch list can alter very quickly, and therefore, prioritize those indicators whose signals will have priority in case of any inconsistency to avoid any hasty decision-making. Remember, signals from the watch list are an indication of the prevailing conditions at that very point in time.
For free at Pocket Option
Get StartedCandlestick Patterns as a Buy/Sell Signal Indicator
A candlestick formation on its own is not normally used as buy and sell signal indicator, but is rather meant to be used as a confirmation. The significance of patterns such as engulfing or long wick rejection comes when the formation occurs around levels previously identified as out points of interest through different tools or analysis.
Using the Economic Calendar Alongside Indicators
All indicators use formulas based on price and volume, therefore do not account for scheduled news releases. Hence, the futures trading strategies based entirely on signals from indicators are usually inefficient when the big scheduled news is coming. Checking an economic calendar before relying heavily on indicators prevents surprises, and negative results.
at our top-of-the line trading platform
RegisterCombining Indicators for More Reliable Signals
There is no single indicator one should rely on as a signal since experienced traders always combine instruments belonging to various classes instead of using several variations of the same indicator. For example, if an investor uses a trend-following tool and a momentum indicator, there will be two independent signals that should coincide.
The aim of using a combination of indicators is not forcing them to be 100% right all the time since this situation almost never happens and would result in your inability to trade. What traders usually do is choose a certain number of indicators and set a specific condition to be fulfilled in case the signals are inconsistent.
Indicator Family | What It Shows | Typical Pairing |
|---|---|---|
Trend following | Direction of an existing move | Paired with a momentum tool for timing |
Momentum or reversal | Whether a move is losing strength | Paired with a trend tool to avoid false reversals |
Volume based | Conviction behind a price move | Used to confirm breakouts flagged by price tools |
This is a general framework, it’s not a fixed rule. Furthermore, the most effective combination depends also on the asset and timeframe.
Common Mistakes When Reading Buy/Sell Indicators
The most common mistakes traders do when they use indicators in trading are the following:
Relying too much on one indicator signal as the ultimate predictor of success, rather than taking it into account as only part of a whole decision process.
Employing several different indicators from the same group and wrongly believing their consensus is an example of independent verification when, in fact, it is not.
Ignoring the discrepancy between the time period over which the signal was generated by the indicator and your planned time for trading.
Disregarding or forgetting your stop loss just because another indicator signal has contradicted your original entry position.
Conclusion
The use of buy and sell indicators can be optimized only through knowing the drawbacks associated with those indicators alongside the information provided by the signals they generate. Trend following indicators can assist in confirming the direction of the market, while momentum indicators will inform on any likely exhaustion or slowdown of movement. Volume indicators give an extra level of confidence beyond what prices can convey. It is important to note that not even these indicators can get rid of the need for a good plan. Experience shows that consistency in using a few tools is more successful than frequently changing indicators after losses.
Disclaimer: Trading can result in large losses and might not suit everybody. Indicators are a tool to evaluate the data and do not give any assurance about future price movements and past patterns do not ensure similar results in the future. This article is not individual financial advisory information. Read attentively, evaluate the circumstances of your situation and seek professional consultation before opening a trading account.
See more:InterestingTrading platforms