Reversal and Pullback Trading: How to Read Swings on Charts?
The moment will come when even the most active trend will stop. But it all comes down to a single question that can decide whether you win or lose: is it a temporary pause, pullback or price reversal? If this question is answered correctly, the price will go in a favorable direction. If not, there is a possibility to go against a trend which has no plans of changing its direction in no time soon. In this guide, we want to elaborate on how to differentiate between retracement in trading and real trade reversal using the tools that Pocket Option offers.

with our modern platform
Get StartedReversals and Pullbacks Definition in Trading
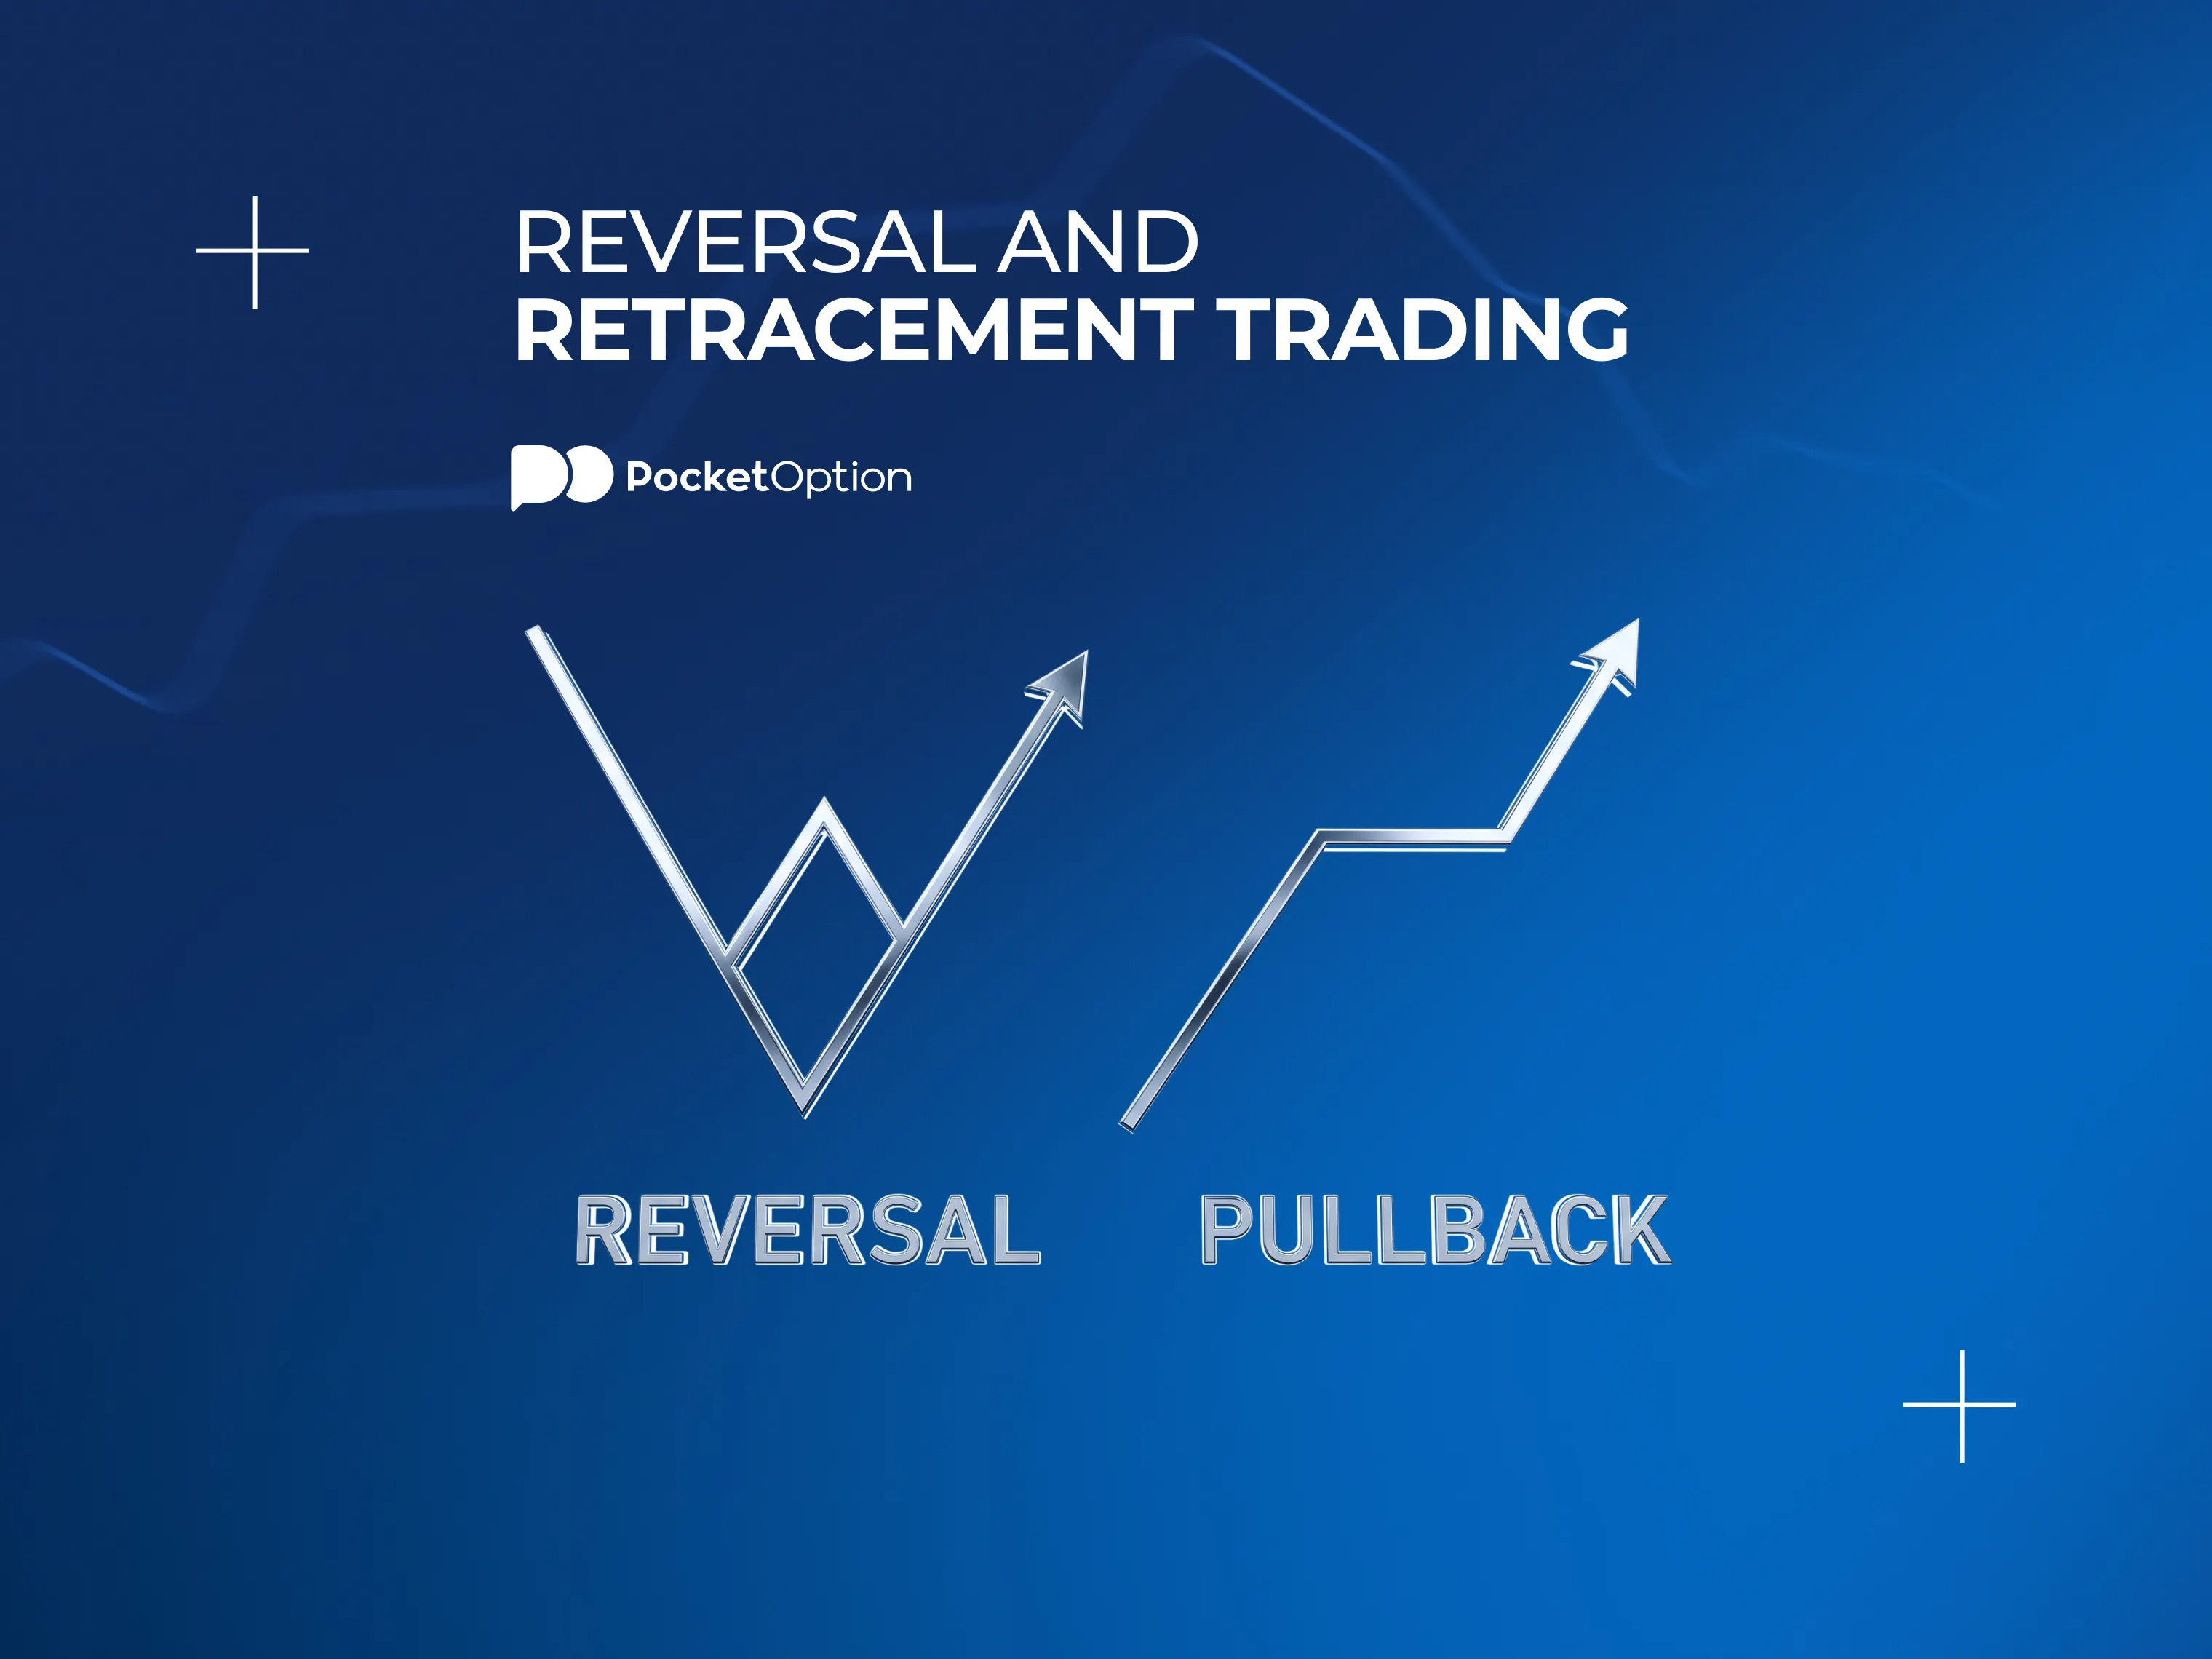
What is reverse trading? Reversal refers to a change in trend direction. For example, uptrends turn into downtrends, or downtrends become uptrends. Such changes in trend always occur structurally, and that means higher highs and higher lows are reversed into lower highs and lower lows. Simply put, there has been a fundamental change in the relationship between buyers and sellers.
Retracement trading, on the other hand, is a temporary counter-trend move in a general trend. An uptrend takes a breather and then continues moving higher. The trend structure of higher highs and higher lows remains unchanged. Pullbacks are normal and signify the “breathing” of the trends.
How to Distinguish Between Pullback and Trend Reversal
Feature | Pullback (Retracement) | Reversal |
|---|---|---|
Duration | Short - usually lasts for several days, even hours | Extended - ranges from weeks to months |
Trend structure | Intact - higher lows are intact in the uptrend | Broken - lower lows substitute higher lows |
Volume | Usually decreasing on the pullback | Increasing while the reversal is forming |
Key levels | Levels of support/resistance hold | Support/resistance levels break |
Momentum indicators | RSI/MACD hold above midline | RSI/MACD cross below midline or diverge |
Trading approach | Trade in line with the trend, but at a better price | Exit the old trend; potentially enter the new one |
This table provides an overview of a contrast that, in live markets, is hardly ever clear-cut. Reversals often start off resembling pullbacks perfectly well. It is only with hindsight that the contrast becomes evident, hence the importance of confirmation and momentum loss before reversal.
Understanding the Fundamentals of a Trend on Pocket Option
Swing highs and swing lows form the backbone of any trend. In an uptrend, the swing highs form at successively higher levels, while the swing lows form at successively higher levels as well. In a downtrend, the swing highs and swing lows form at progressively lower levels. Mark these swing highs and lows on your chart, these will be the benchmark for any retracement and trend reversal.
Structural failure in the chart pattern happens when this trend pattern is broken. When a trend forms a swing low that is lower than the previous swing low in an uptrend, it means the trend pattern is broken. It does not mean the trend will reverse, but it is the first sign. This is known as a break of structure on chart.
Support, Resistance, and Swing Points as Your Map
Identify the last few (three to five) swing highs and swing lows. Draw horizontal lines on the chart at the important levels. They will form your road map. If prices fall back to the level of a swing low and find support there, then the trend remains intact. Otherwise, you could have an emerging trend reversal.
Visual Signs a Reversal Might Be Forming
The following indications usually coincide before most reversals:
Momentum loss as the price approaches a new high: the price forms a fresh high, but this move is not confirmed by rising RSI or MACD - a bearish (or bullish) divergence.
The breaking of the trendline break signal: the trend line, which connects the latest swing lows in an upward movement, is violated. It acted as dynamic support and its violation tips the scales.
The increase in volume during the countertrend move: pullbacks usually happen on decreasing volume. Increasing volume during a dip shows that the sellers have grown stronger.
The appearance of a candlestick reversal patterns at important levels: engulfing candle or pin bar at important levels of resistance.
Chart Patterns That Indicate a Reversal is Due
Double top and double bottom: price attempts to test the same level twice and fails both times. The neckline breakout makes the pattern valid.
Head and shoulders reversal: a three-high pattern where the middle high (the head) is higher than the two other highs on either side (the shoulders).
Lower high following a breakdown of a swing low: the easiest reversal structure without any specific pattern names.
All of these patterns need to be confirmed with a break of a certain level before becoming tradable. An anticipation of the formation of the pattern without confirmation is one of the most common causes of losses.
Candlestick Patterns at Important Price Levels
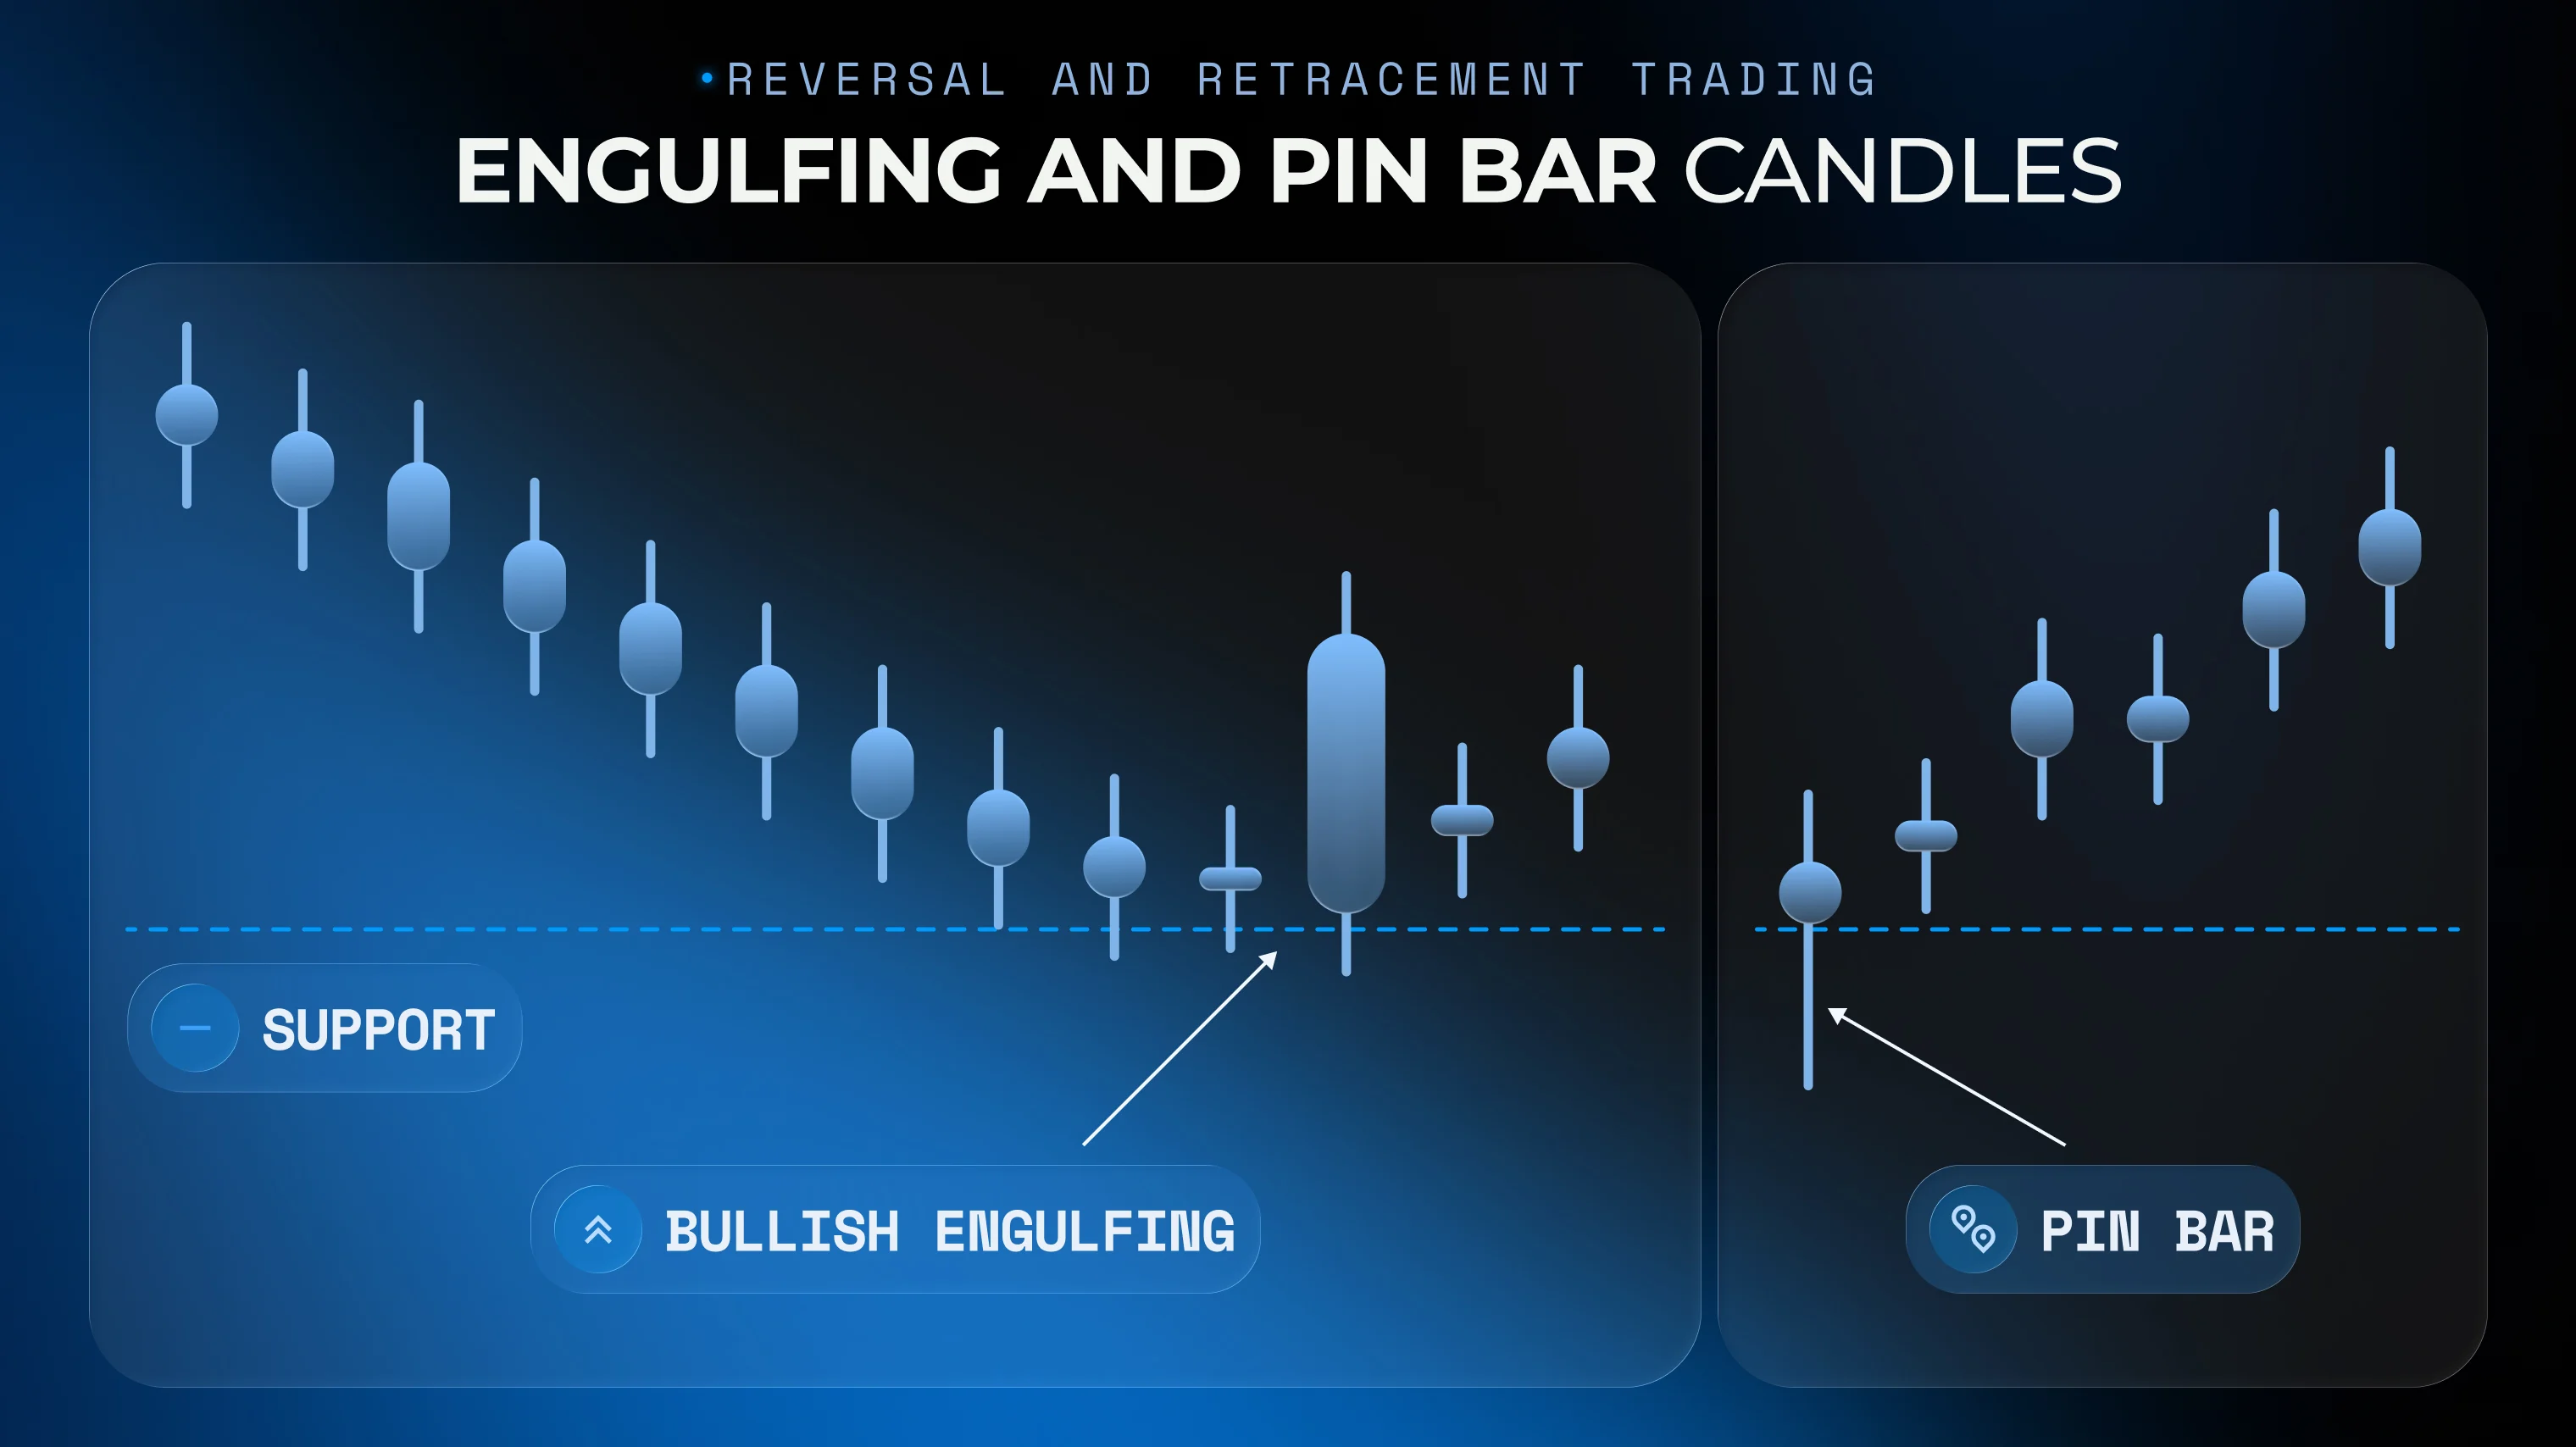
Engulfing and pin bar candles are two of the most commonly referenced setups at critical levels. A bullish engulfing bar at a clearly defined support area implies that buyers have taken control of the price at that level. Pin bar (hammer) with a long lower wick at the same level gives the same signal through another method - price has been driven down and rejected.
These candles have nothing to do with trading. Engulfing bearishly in the middle of the range without any support is noise. What is important is that it happens at some level where a reaction is supposed to take place.
Identifying Healthy Pullbacks Inside an Existing Trend
A pullback entry in uptrend is the mainstay of trend following approaches. The ideal pullback should have the following characteristics:
There is a sound structure to the trend where new highs and new lows are made.
There should be a defined level where the pullback reaches, a past swing low, moving average, or Fibonacci levels.
The volume decreases during the pullback time but increases when the trend continues.
A candlestick pattern forms at the pullback area.
If all four characteristics fit, the pullback fits the classic profile that trend-followers look for, though this doesn't guarantee the trade will work out. If any of them is absent, particularly the first, be careful about trading the pullback.
Building a Simple Reversal Trading Plan
Reversal trading is more risky by default than trend-following since you are going against the momentum of the market. Here is a basic plan:
Find a divergence of momentum (RSI or MACD) on the time frame you want.
Look for a breakdown of structure, like a lower low in an uptrend or a higher high in a downtrend.
Confirm with a reversal candlestick pattern, ideally it should be also at an important support/resistance level.
After the confirmation candle closes, pick the asset, and set a trade amount you're comfortable risking.
Choose a timeframe long enough so that the next major support or resistance level would be within reach. Then select Sell for a bearish reversal, or Buy for a bullish one.
If price closes back beyond the latest swing high (for a bearish reversal) or swing low (for a bullish one) before your timeframe ends, then treat the setup as invalidated rather than confirmed.
Constructing a Basic Pullback Strategy
Retracement trading strategy is less complicated since you trade along the trend line:
Check the trend direction on the higher timeframe: does the pattern of higher highs and higher lows (in an uptrend), or lower highs and lower lows (in a downtrend), still hold?
Look for a retrace to a certain level, swing support level, MA level, or a Fibonacci retracement point (38.2% or 50%).
When confirming candle comes up to that level, pick an asset, set a trade amount, and choose a timeframe. The timeframe should be long enough to reach prior swing highs (in an uptrend) or swing lows (in a downtrend).
Buy, if an uptrend pullback is happening, or Sell for a downtrend pullback.
If the swing low (or high) that defined pullback gets broken, and your timeframe hasn't ended yet, the retrace can be considered as failed.
with Pocket Option
Try Demo AccountBasic Risk Management Guidelines for Reversals & Pullbacks
Don't risk more than 1-2% of your account balance on a single trade, ideally.
The trade amount in reversal setups can be somewhat smaller, as the probability of loss in reversal is often greater compared to pullbacks.
Avoid placing trades without deciding in advance what would invalidate them. Thinking like “I will leave when it appears to be wrong”, or “I will feel it” is just poor risk management.
Understand that sometimes pullbacks can end up as reversals. Or reversals can become pullbacks. That' s why knowing your invalidation levels in advance can help keep your losses in check.
Conclusion
Trading reversals and pullbacks are two approaches to understanding where the trend is pausing, and where it's ending. Pullbacks allow you to enter trades in line with the trend at a potentially better price, while reversals allow for large movements against the trend.
They both need some structure, verification, and proper risk management. Make your rules. Verify them on the demo account provided by Pocket Option. And let the statistics, not the adrenaline of taking the turn, dictate which setups you should put money into.
Join large community of traders
Register NowRisk disclaimer: This content is provided for educational and informational purposes only. It does not constitute financial, investment, or trading advice, nor a recommendation to buy or sell any instrument. Do your own research before acting.
See more:InterestingTrading Strategies