Backtesting Trading Strategies Turn Raw Ideas into Tested Plans
All traders have ideas. In fact, most of these ideas are incorrect. The difference between a trader who finds that out while testing his trading strategy on a demo platform and a trader who finds that out trading real money is, broadly speaking, the difference between training and losing money. Backtesting of trading strategies is the process of applying a certain set of trading rules to the historical prices data and evaluating its outcome. Backtesting doesn't predict anything but helps filtering out trading strategies that didn't work historically. And this alone makes backtesting one of the most valuable tasks a trader can do prior to starting live trading. In this article we'll explain everything about it: How to develop a trading idea into trading rules and run them on historical prices data. How to evaluate the results using appropriate metrics. And how to verify the system on the demo platform of Pocket Options before risking any real money.

What Backtesting Is and What It Can Tell You
A strategy backtest involves testing a predetermined set of rules (entry rules, exit rules, position sizing) on a historical data set. The process involves running through previous charts (and if one writes a script, having the computer do so), marking each trade that one would have taken based on one’s rule set, and documenting the results.
What it can tell you: whether or not there is positive expectancy as a result of the rule set from a sample, the amount of drawdowns, and the degree of market sensitivity of the results. What it cannot tell you: whether or not history will repeat itself. The key distinction lies here.
Why You Should Test a Strategy Before Trading Real Money
The logic behind why to backtest trading strategy is simple. If a strategy does not prove effective on historical data, which gives one the benefit of hindsight, then it would be virtually impossible for it to work in real-life situations. This is precisely why paper trading and backtesting are done: to weed out those methods that may be good in theory but fall flat in practice.
This way, one will discover the true emotional side of his/her method before taking any risks with actual cash. The strategy that wins 45 percent of the time and has positive math expectancy due to the good payoff ratio will feel like a loser for the majority of the time. If you have not gone through this emotional phase using historical data, you will discard the strategy after the first three losing trades.
What Makes a Backtest Reliable
You can backtest trading strategies up to a different standard. If you want a good one, it needs to satisfy these requirements:
Sample size of 50 or more trading signals; if less, there is too much statistical noise.
Several market conditions: data needs to contain examples of trendless, ranging, and volatile markets; strategies that work in only one regime have poor performance.
Realistic assumption of spreads, slippage, and delay from signal generation to the moment of execution; backtests without transaction costs are always overly optimistic.
No future information; each signal and decision about entry/exit must be based on the available information at that point of time. Otherwise, it would be a form of cheating.
This last requirement is essential and directly linked to the most common mistake in backtesting: do not over-fit the data. A 14-parameter strategy perfectly adjusted for a particular period will give superb results on this period and terrible results anywhere else.
How to Turn a Trading Idea into Testable Rules
A trading idea is a sentence. A testable strategy is a checklist. The gap between the two is precision.
If the thought is "Buy when RSI is oversold near support," then here's what you'll need in order to test it:
What RSI period? (14-period, 9-period, something different?)
What's the definition of "oversold"? (Under 30? Under 25?)
What's the definition of "near support"? (Within 20 pips? Right at the support level?)
Is the trigger for the trade the RSI crossing back over 30, a candle formation, or closing over the level?
What's your stop-loss? What's your take-profit?
Without having answered all of those questions in unequivocal detail, you do not have a strategy. You have a feeling. And feelings cannot be back-tested.
Backtest in MetaTrader mode
Get StartedStep-by-Step Backtesting Process
Choose One Market and One Time Frame
Think small and specific. Choose an instrument (EUR/USD, gold, or the S&P 500 index) and a single timeframe. Backtesting a stocks strategy at once over five instruments and three timeframes will simply create noise and nothing more. After the strategy has been validated on one instrument-timeframe combination, you can try to use it on other instruments and/or timeframes.
It turns out that selecting the right timeframe is even more critical than it seems to beginner traders. If a certain strategy generates clear signals on a 4-hour chart, then it will give false signals all the time on a 5-minute chart. Same strategy, but with very different results. Select the appropriate timeframe and keep it.
Mark Every Valid Setup on Historical Charts
Review three to six months of past data by scrolling back. Each time there is a valid signal based on your rules, flag it. Don’t omit any signals that “looked bad.” This is what discretionary filtering can do to make your backtest unreliable. When there is a signal for an enter trade, you log it.
When you find out that the signals for entering trades are bad, don’t get the urge to change the rules in the middle of your backtesting process. Finish the process with the original rules and record the result, then change the rules and do another test.
Record the Result of Each Trade
For each trade, make sure to take note of the following details: Entry price, Exit price (your stop loss/take profit), Direction, and Result (in either dollars or pips). This can be done using an Excel sheet but it is important that you maintain consistency and not just the format.
Review the Full Set of Outcomes
Once you have completed 50 trades, then do an analysis on the statistical data described below. You do not need to analyze the trades individually. The stats are the signal while individual trades are just noise. One huge winner may skew your impression of a strategy which usually loses money.
Metrics That Matter in a Backtest
Metric | Formula / Definition | What It Tells You |
|---|---|---|
Win Rate | Winning trades ÷ total trades | How often you win; but meaningless without payoff ratio context |
Average Win / Average Loss | Sum of wins ÷ # winners, and sum of losses ÷ # losers | The risk-reward ratio your strategy actually delivers |
Expectancy | (Win% × Avg Win) − (Loss% × Avg Loss) | The average amount you expect to make per trade - the single most important number |
Profit Factor | Gross profit ÷ gross loss | Above 1.0 = profitable; above 1.5 = robust; below 1.0 = losing strategy |
Maximum Drawdown | Largest peak-to-trough decline in account equity | The worst losing streak you would have experienced - critical for survival planning |
Recovery Time | Number of trades from drawdown bottom to new equity high | How long the pain lasts determines whether you can psychologically endure the strategy |
Win Rate and Loss Rate
A win rate of 40% is not a bad strategy at all. Likewise, a win rate of 70% does not mean anything positive either. The win rate is relative to context and only meaningful together with the average value of winnings and losses. If a strategy wins 40% of the time, but earns $3 for every dollar lost, its mathematical expectancy will be higher than one which wins 70% but only gains $0.50 for every $1 of losses. A risk reward ratio like that is considered quite good.
Average Win and Average Loss
That is your risk-reward ratio that your strategy has produced. It is not the ratio you intended to produce, but the ratio produced according to the information. For instance, when the intended ratio was 2:1, but the data shows a ratio of 1.3:1, then the information is correct.
Expectancy and Profit Factor
Expectancy calculation is by far the most crucial figure for every backtest. Expectancy in the green indicates a profitable strategy after a certain number of trades. Expectancy in the red denotes a losing strategy, despite its elegance in the entry process. Expectancy can be calculated using this formula: (Win% × Avg Win) − (Loss% × Avg Loss).
Maximum Drawdown and Recovery Time
Maximum drawdown seeks to find an answer to the following: "What was the worst that has happened in this particular test?" For instance, if your answer is a 45% reduction in your account value, then you have to determine whether you will be able to survive such a situation without leaving the system. The time taken to recover gives you this information.
Common Backtesting Mistakes to Avoid
Overfitting: Adding parameters until your trading strategy fits the historical data exactly. More parameters means less chance to make money in real life situations. Simpler strategies work better.
Survivorship bias: Running a test on assets that still exist in today’s markets. If something delisted, crashed, or turned out to be too illiquid, it will not appear in any charting service and thus improve results artificially.
Ignoring spreads and slippage: Your strategy generates an advantage of 0.5% on each trade. Sounds promising, until you consider the 0.3% transaction cost on each side. The result becomes zero or even negative.
Insufficient data: Running a test on a couple of months of data. 2 months can produce just 15 trades. It is not even a sample, it is an anecdote.
Cherry-picking periods: Testing your strategy on only that part of data where you know it works. This is not backtesting anymore, it is confirmation bias.
The discipline to avoid overfitting and doing varied market condition testing periods separates useful backtests from pure self-deception.
How to Use Pocket Option for Validation
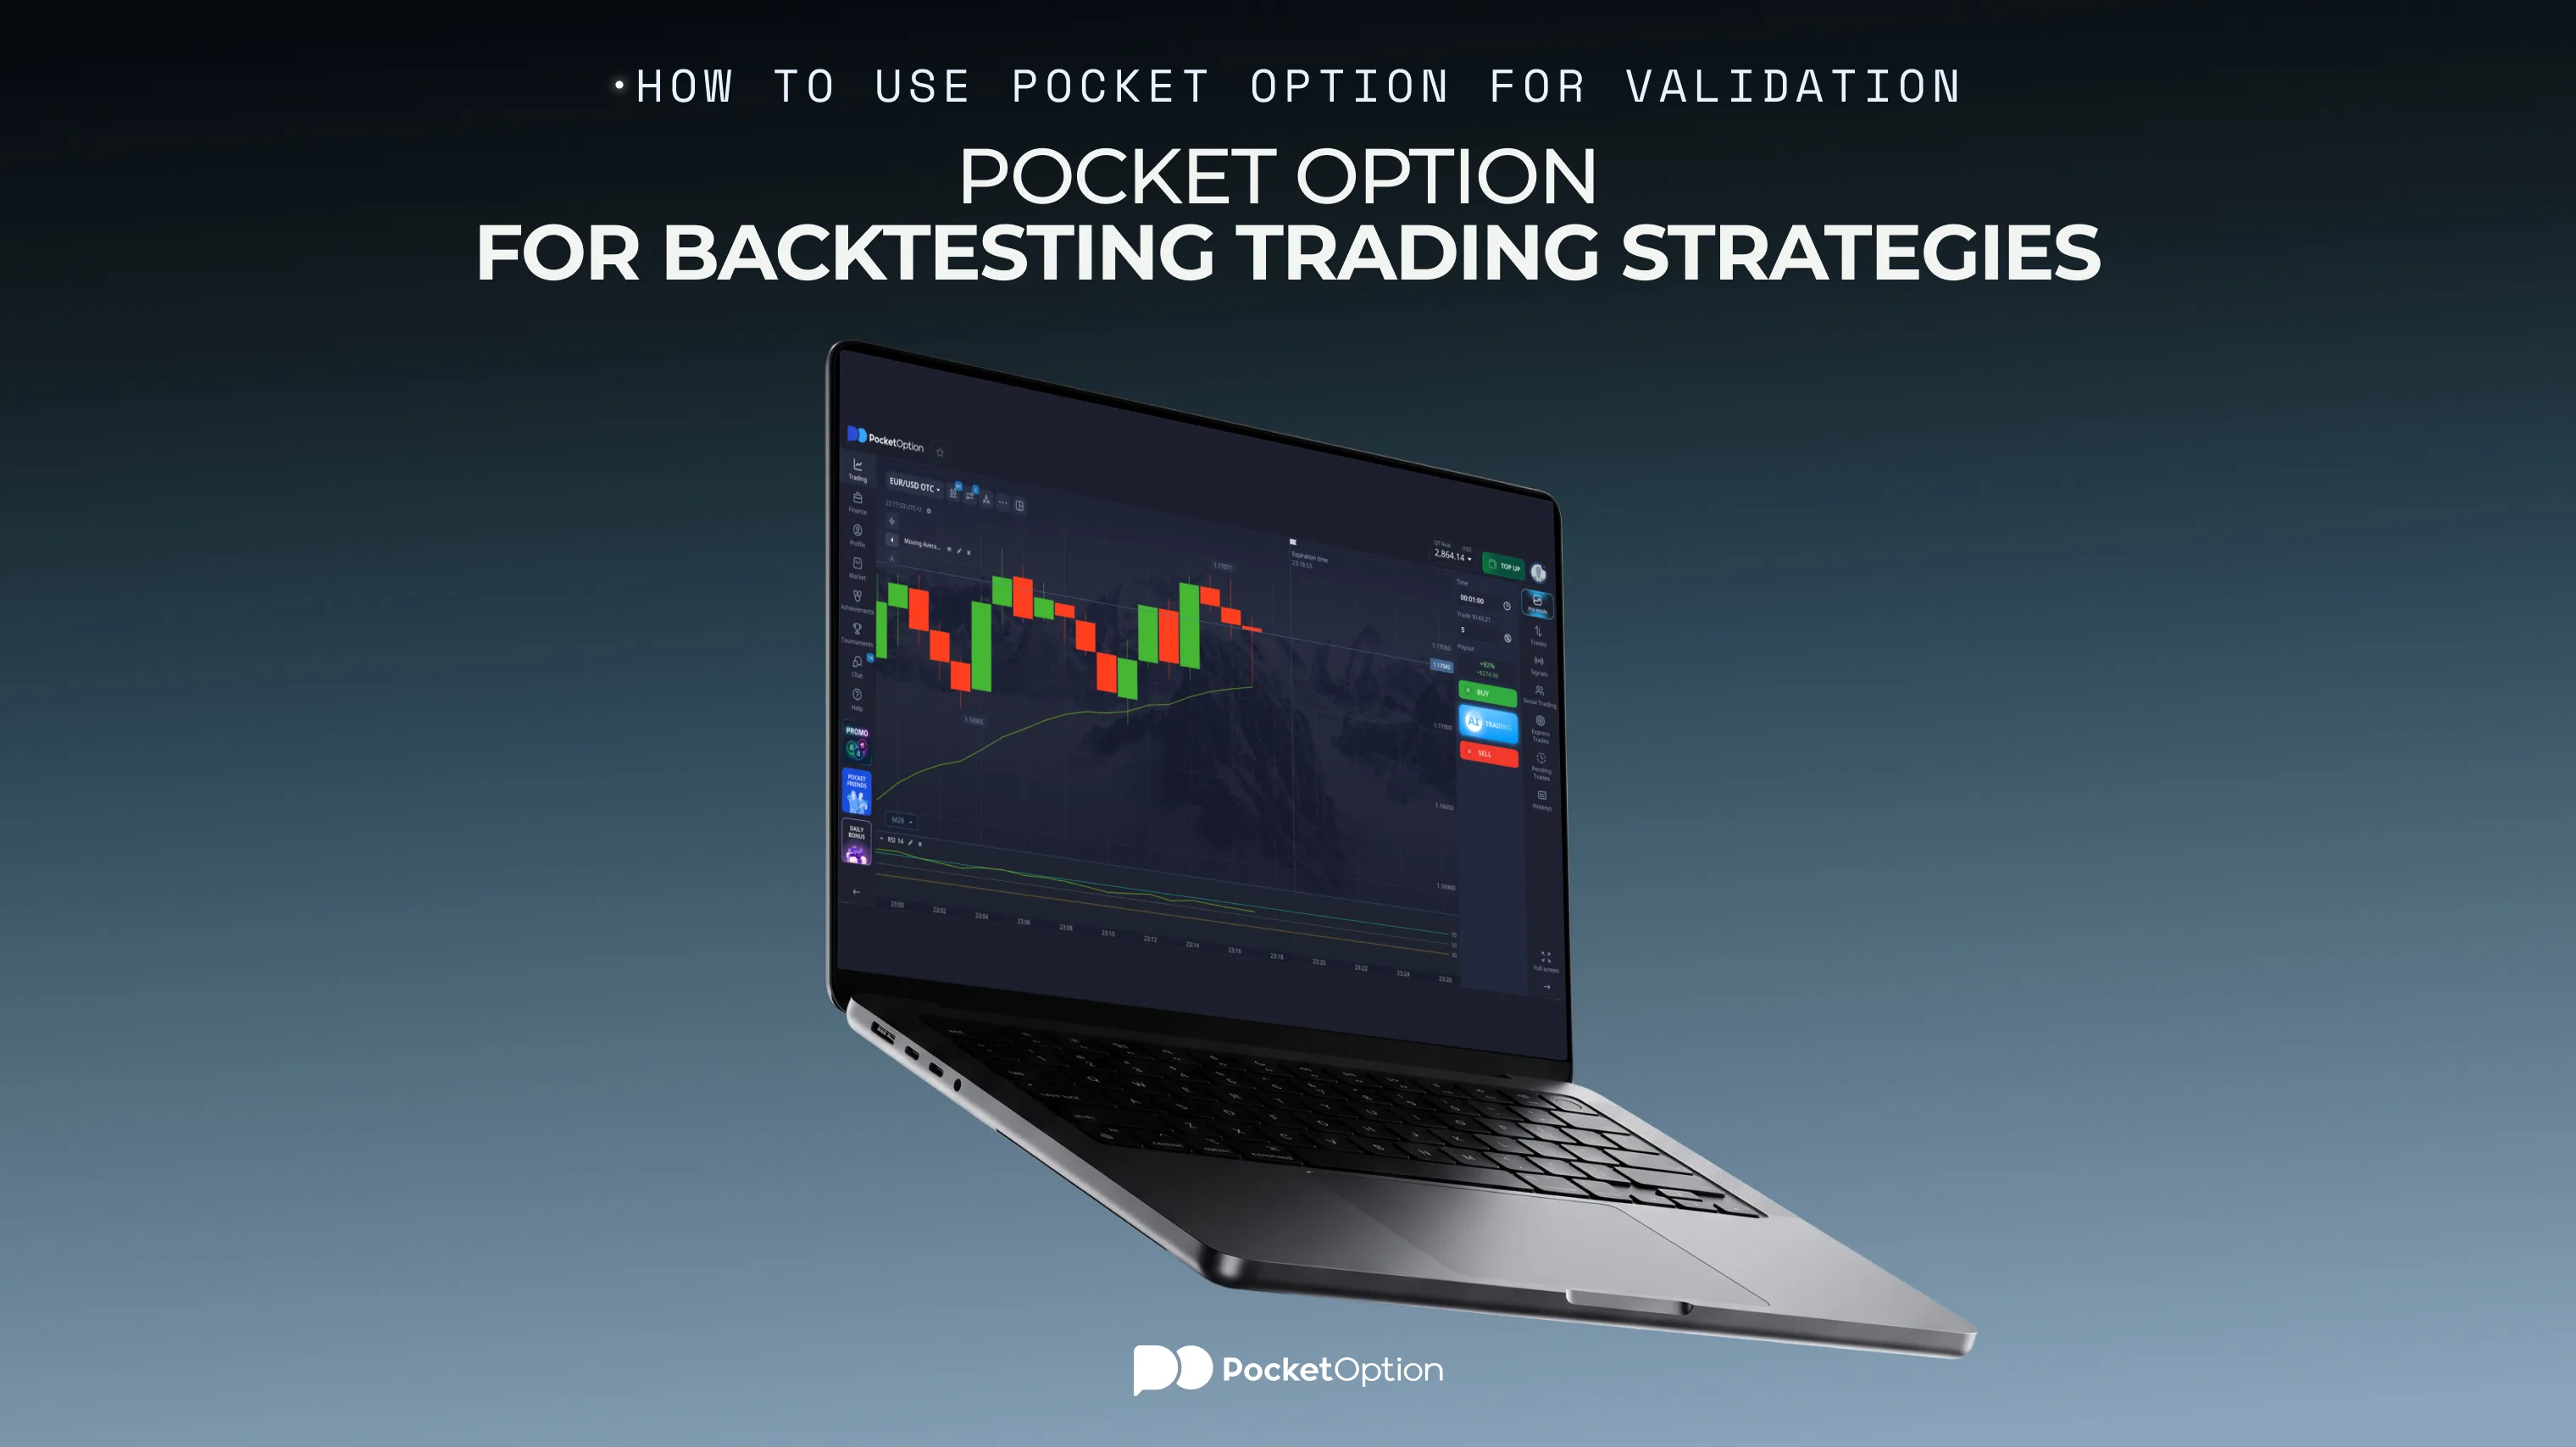
A backtest is a retrospective approach while forward testing is a prospective one. The same rules are applied using market data in real time without the use of any actual money invested. You can use the Pocket Option demo account validation as a proof of concept for your trading.
After having passed a backtest with positive results:
Go to the Pocket Option demo account and create charts in the same manner as you did for the backtest: with the same instrument, timeframe, and indicators.
Take every trade that your rules generate regardless of how the chart looks like at the moment. There will be no exceptions during the forward test. The goal of the test is to see whether your rules work in live conditions. This is how paper trading practice works.
The forward test needs to be conducted for at least 30 trades. Compare the metrics of the forward test to those of the backtest (win rate, expectancy, drawdown).
If there is enough similarity between these sets of data, then your strategy is verified. Otherwise, it means either overfitting during backtesting or changes in the market regime.
This is the stage where most traders tend to take shortcuts, resulting in most preventable losses. If a trading strategy hasn’t survived the forward test using the demo account, it shouldn’t even be used with real money.
use virtual funds
Try Demo AccountConclusion
Backtesting strategies will not assure you of profits in the future. However, backtesting is the closest thing to a scientific process of improving your trading. Define strategies you want to follow. Test them using past prices. Evaluate the performance using accurate metrics. And validate them in a demo account before risking any real money.
It may not be glamorous or speedy. It takes time and a certain amount of discipline to eliminate strategies that cannot stand up to the test. But the traders who systematically backtest their strategies before trading for real, are at a tremendous advantage compared to the majority of market participants.
Disclaimer
This content is provided for educational and informational purposes only. It does not constitute financial, investment, or trading advice, nor a recommendation to buy or sell any instrument. Do your own research before acting. Financial markets are volatile and prices can move against you quickly. Past performance is not indicative of future results. Only trade with funds you can afford to lose.
See more:InterestingTrading Strategies