
Dead Cat Bounce: How to Tell a Real Recovery from a Temporary Bounce
A stock falls hard, weeks on end. Then, one morning, it jumps! Buyers turn up out of nowhere, and the drop looks like it’s done with. Sometimes it really is done. But plenty of times it is not, and what you are looking at is a typical dead cat bounce.

What Is a Dead Cat Bounce
A dead cat bounce is a short-term recovery, stuck in the middle of a downtrend. Recovery that ultimately does not hold. Price drops, lifts back up over a few sessions/hours, but then goes right back to falling again. The move up is real money changing hands. There’s just not enough of it, and the fuel runs out fast. Some people think it’s the new bull market starting, but in fact, it’s just a temporary reprieve.
Almost any green stretch inside a bear market gets called the dead cat bounce after the event. If you want the stricter meaning, then it’s a bounce that fails, and then a new low is sitting behind it. Until that new low shows up, the bounce could still go either way.
Right after a bad week, "whats a dead cat bounce" is the sort of thing that people bang into search engines, usually because they just bought something that ‘felt cheap’ at the time. This timing is not an accident. The dead cat bounce pattern often turns up when the mood is at its worst. This is also when any small relief move can feel much bigger and more important than it really is.
Traders talk about a dead cat bounce stock the same way they talk about a dead cat bounce crypto move: the markets are relatively connected now, with many people trading both. A dead cat bounce stock market episode usually comes after a prolonged and large selloff, and those happen in crypto too, sometimes even more often. So dead cat bounce crypto happens a lot as well, for example with long-exhausted memecoins which have a last ‘hurrah’, before most of the rest of the people completely exit.
Where the Term Comes From
The expression came from trading floors. The joke is grim: even a dead cat will bounce (once), if you drop it from high enough!
This joke started turning up in market commentaries throughout the 1980s. Mostly in coverage of markets that had fallen a long way, with seemingly no end in sight. Some older write ups from that era spell it dead-cat bounce with the hyphen stuck in, same thing.
The picture stuck, because it does the job well. A bounce with nothing really alive in it. A bounce simply because of the height that the thing was dropped from. What enables the move is the height of the fall, not the strength of buyers showing up.
What Triggers a Dead Cat Bounce
A few things can shove price up, without fixing the problem underneath. For instance:
Short sellers buying back the asset they sold (just to bank the gains received)
Some bargain hunters piling in
Funds/traders having a guess at where the bottom sits (for example, near the major support level, or simply a nice round number)
Some hype, or headlines, lining up, and so the retail money coming in, a little bit.
Short covering
Traders who sold shorts have to buy the asset, eventually. Those buy orders might land in a market where the sellers have mostly run out, and so price pops up. Nothing about the company (or the coin) got any better though. So shorts covering tends to be quick, and loud, and often doesn’t lead to anything meaningfully changing about the price direction.
Dip buying and bargain hunting
A stock down a third from last month looks cheap next to that last month. So some people will buy simply because of the current ‘cheap’ price. Not thinking about where that price might be heading.
Search for a bottom
Money that has to be in the market tries to find good entry points. A fund with cash that sat idle might start scaling in at some number they find appropriate. If a significant amount of buyers choose roughly the same area, the bids stack up and price might lift, causing the said dead-cat bounce to occur. However, that lift might get sold into, during a session or two.
Retail psychology and hype
After a long decline people are just tired of being down and down. Any green day feels like ‘the big turn’. Social feeds also spread news about it around fast. So the volume comes in even more, and price goes up for a session or two. The story writes itself. Then the sellers, who had been waiting for a better exit, finally get their chance, and that is what often ends the move up.
Dead Cat Bounce vs a Real Reversal: Key Differences
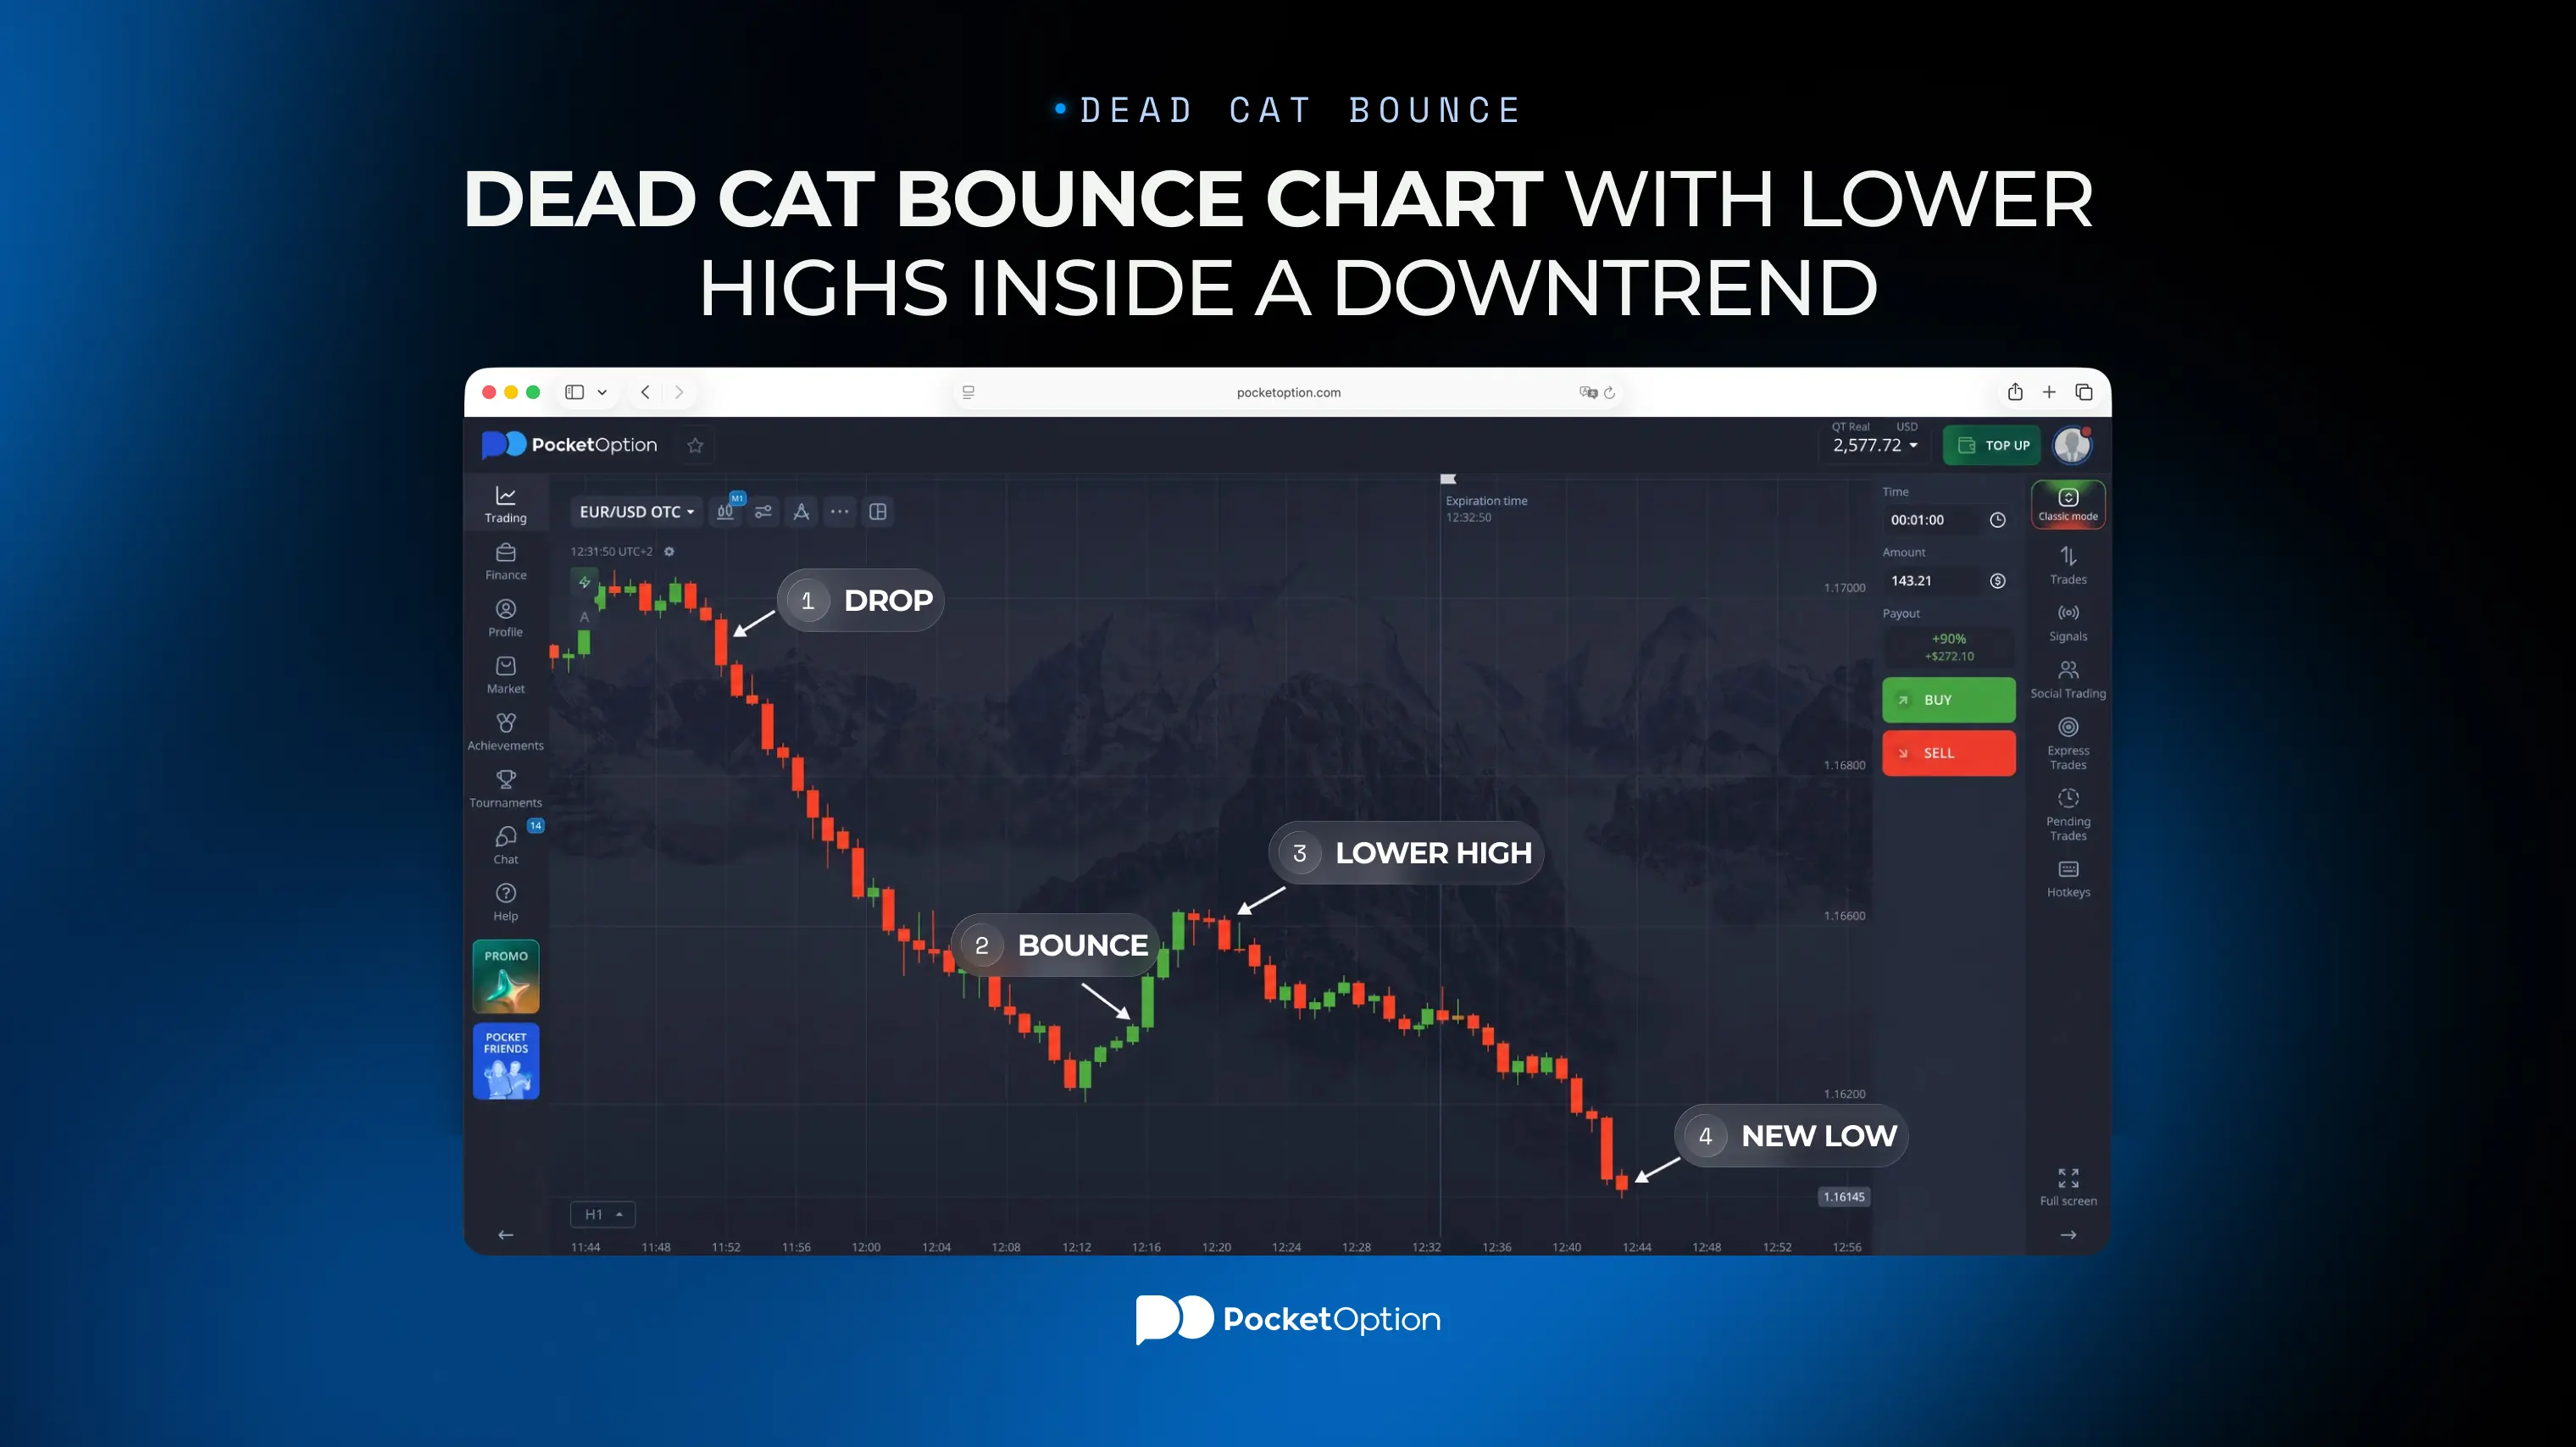
Telling the two apart comes down to TA structure and underlying market/token economics. You can read our guide to reading reversals and pullbacks on charts, but basically it can come to this:
What to check | Dead cat bounce | Real reversal |
|---|---|---|
Volume on the way up | Lighter than the volume that came in on the drop | Builds as price rises, often past the selling volume |
Highs | Every rally high sits under the last one | A previous swing high gets taken out |
Behaviour at resistance | Stalls, then gets shoved back at the first broken level | Clears the level, and holds it as support |
Length of the move | A few sessions. Sometimes less | Weeks, with pullbacks that keep making higher lows |
RSI | Comes off oversold and stalls near the middle | Pushes into strength and stays there on dips |
Volume behavior
Volume is often the first thing to look at. If the bounce has much lighter volume, then the buying is thin. This means, trend is likely not turning around.
A real reversal usually looks different on the volume behaviour alone. It should grow while price climbs (more and more people believe in the real market shift), and not fall.
Lower highs
Downtrends are often built out of lower highs and lower lows. So a bounce that stops under the previous rally high leaves that structure intact. Draw a line across the last two or three highs, and if the bounce dies somewhere underneath it, this means that not much has changed, apart from some the mood.
Until price really takes out a level that mattered before, and establishes itself above it, a rally might just be a dead cat bounce inside a continuous downtrend, and that’s about it.
Resistance rejection
Old support turns into resistance the moment it breaks. So a bounce that runs into that zone and doesn’t go higher is the classic dead cat bounce chart look. Sharp fall, a lift back up, with long wicks trying to poke out somehow, but then the drop again.
Watch what happens after the touch. A reversal clears the level, and holds above it. A failed bounce gets knocked back, failing the upwards move.
RSI and moving average confirmation
Momentum tools can filter out some of the noise. RSI coming off oversold and stalling around the middle of the range says that buying might’ve ran out of fuel. Meanwhile, RSI pushing up, and then holding above the midpoint, implies a more meaningful change. By the way, you can read our walkthrough of how to use the RSI indicator for day trading to understand the subtle differences.
Moving averages can also confirm the move (although they often give you a slower read). If a price is bouncing up into a declining average, and then turning down right there, it's a common dead cat bounce pattern, and should be treated as such.
Dead Cat Bounces in Crypto Markets
Everything above carries over to crypto as well. Just quicker and with possibly wider swings. A dead cat bounce crypto move can run well into double digits sometimes, and still be nothing more than shorts covering into a rather thin book.
Across a drawn out downturn several bounces can come and go, before the actual sustained low establishes itself. Of course, each one of these bounces gets called ‘the true bottom’ by some people with a big following. Eventually, one of them gets things right. What those long stretches mean and how to trade them can be read in the piece on what crypto winter does to prices. Repeated failed rallies is a big part of that story.
By the way, volume and MAs work the same way for confirmations here, except that the data is messier. Various exchanges and DEXes report different numbers, and the order books have less orders sitting inside of them. That’s why the big move up can often be caused by a single large order (compared to the current open market interest).
Such moves, triggered by just a small number of participants, often don’t last. Fortunately, on-chain metrics here can help a lot. Seeing the amount of actual buyers stepping in on-chain is one of the metrics that can help determine dead cat bounce crypto a bit easier compared to dead cat bounce stock market.
How Traders Confirm the Pattern Before Acting
Confirmation is mostly patience. Waiting for the bounce to fail (possibly at the retest), and not running on hopes that it will not. This at least keeps you out of the worst outcome, which is being early and wrong on a move that carries on going up without you.
In practice this means a few things. First, let the rally run its course. Second, mark the high of the bounce on the chart. Then it is the reaction to that high that gets traded, either a break of the bounce low or a knock back on lighter volume at resistance. Third, size should stay small either way, because dead cat bounce trading done early is guesswork dressed up as analysis. Gains here can come quick, and so can losses.
Risks: Getting Caught in a Short Squeeze
The main way the stock market dead cat bounce hurts people is on the short side. Selling into a bounce (that turns out to be real!) means being short into a rising market. If enough shorts get trapped, the buying feeds itself. That is a short squeeze, and it can be a nightmare for short sellers. It can run far past any level on the chart, because the buying is not driven by what the actual asset is worth.
Heavily shorted names are often the dangerous ones. When a big chunk of the float is sold short and price starts climbing, then the exit is crowded. Stops start to fire, and brokers ring up with margin calls. Move up can pick up speed on its own, for a time.
Two habits here can cut the damage down. First one, using stop-losses, that get put in before the position goes on (not after price has already run against you). Second, proper sizing. Less size put into names with large short interest already. This is because an ordinary position can end up in an unordinary amount loss in that particular spot.
Common Mistakes When Reading a Bounce
Most of the errors here are versions of one mistake, which is deciding what the market is doing before the market has done it.
Calling the bottom off just some large green candle
Ignoring volume, because you think the price action looks great
Shorting into the bounce, especially with no stop and no plan
Treating a stock market dead cat bounce and a proper trend change as the same exact event, just because they can look the same way at the start
Averaging down through the decline, and thus running out of room before the real low turns up (if it ever will)
Using one timeframe, one indicator, and still having a strong opinion about what will definitely happen to the market.
Conclusion
A dead cat bounce is not rare, and it is not a trick. It’s just what a market does at some particular points in time. The tools for reading it are the same ordinary ones: volume that holds up against the volume of the decline, and what exactly price does when it gets back to the level that broke.
If one thing gets kept out of all this, make it the volume comparison. A rally that cannot beat the participation of the selling that came right before it is a rally on borrowed time, whatever the candles happen to look like on the day.
Disclaimer: Trading involves significant risk of capital loss and may not be suitable for all investors. Past performance does not guarantee future results.
See more:InterestingTrading Strategies