CISD Trading Strategy for Identifying Changes in Price Delivery
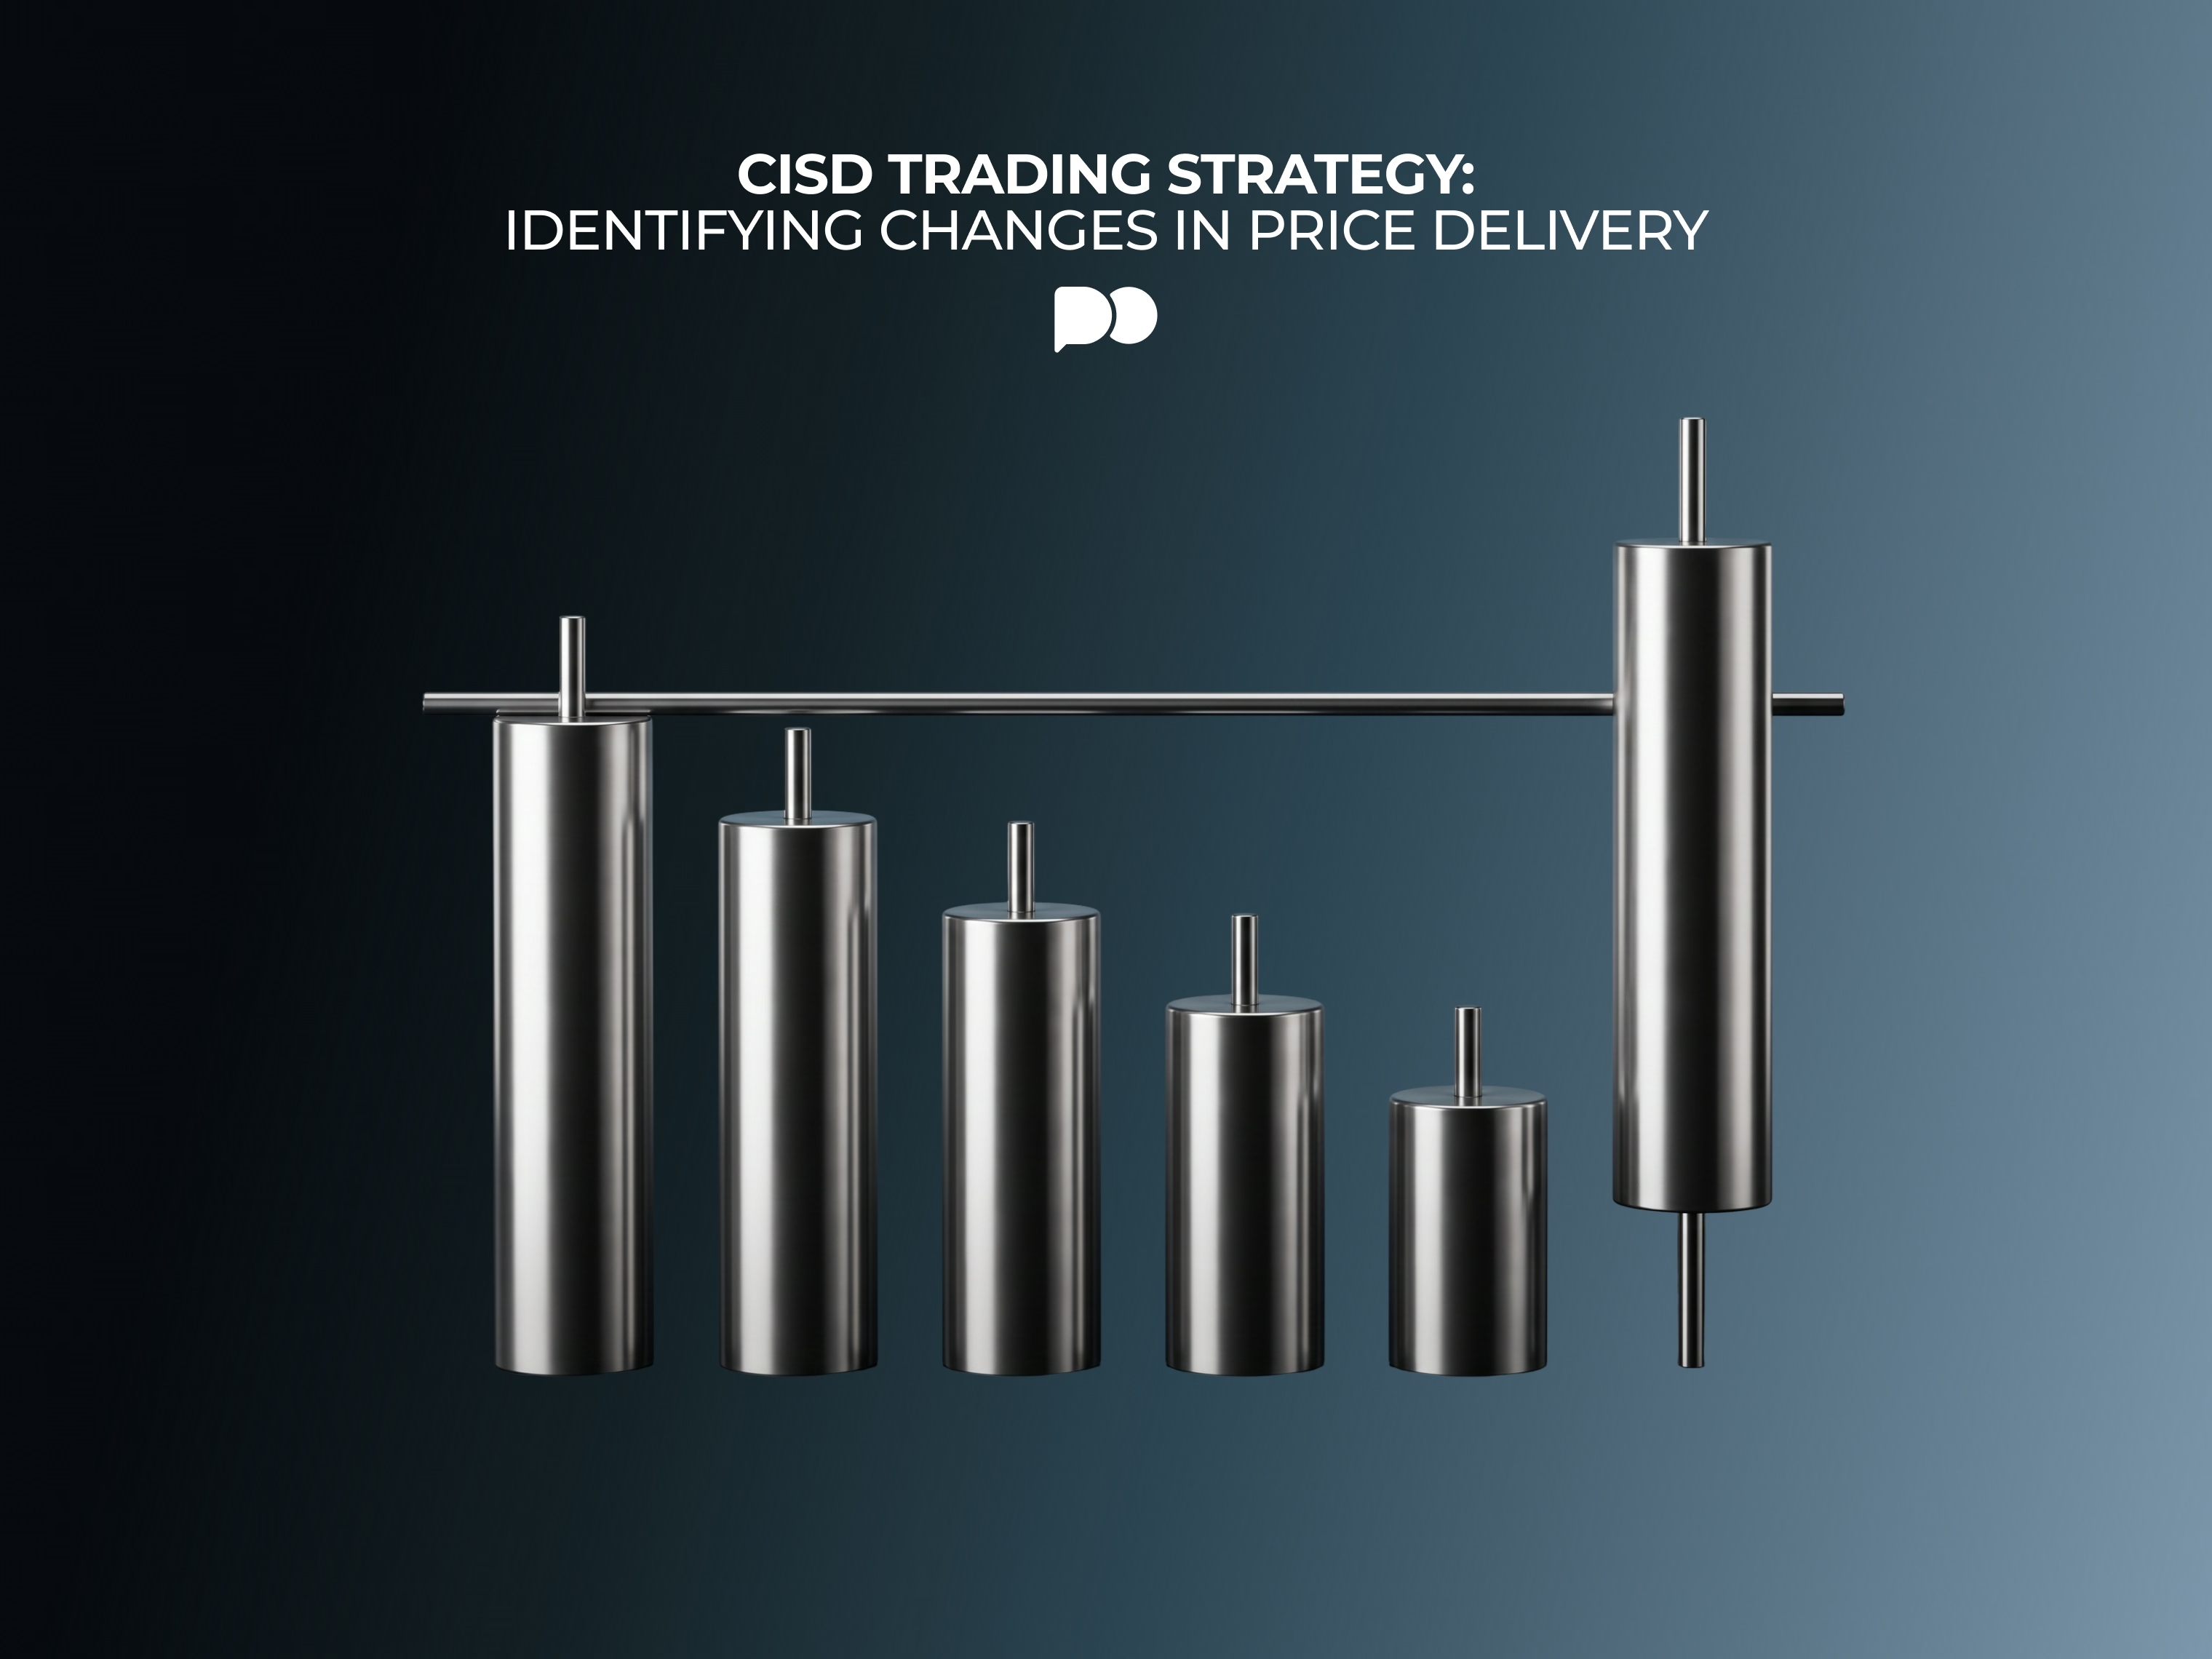
A bunch of red candles one after the other, but then a green close landing above all of them, this is the signal that people doing CISD trading are looking after. Here’s what this signal means, and how to use it.

What Is CISD in Trading?
CISD is ‘change in state of delivery’. It means that the price has been delivering in one direction, using same-colored candles, but then the state has changed. A new candle has closed beyond the opening price of the first candle that has started the ‘delivering’ process. This might have marked a price delivery shift, so the one-way flow has stopped, and now there’s potential for a real reversal.
If anyone searches CISD meaning trading, they tend to find oblique and ‘mystical’ results, a lot of the time. Some swear it’s one of the great indicators or patterns. But in reality, it’s a mechanical rule about candles, that might teach you a thing or two about price action, if you start to notice it happening in your charts. This rule has to be marked, tested, and thrown out if it doesn’t suit your trading strategy, though.
How to Identify the Delivery Sequence
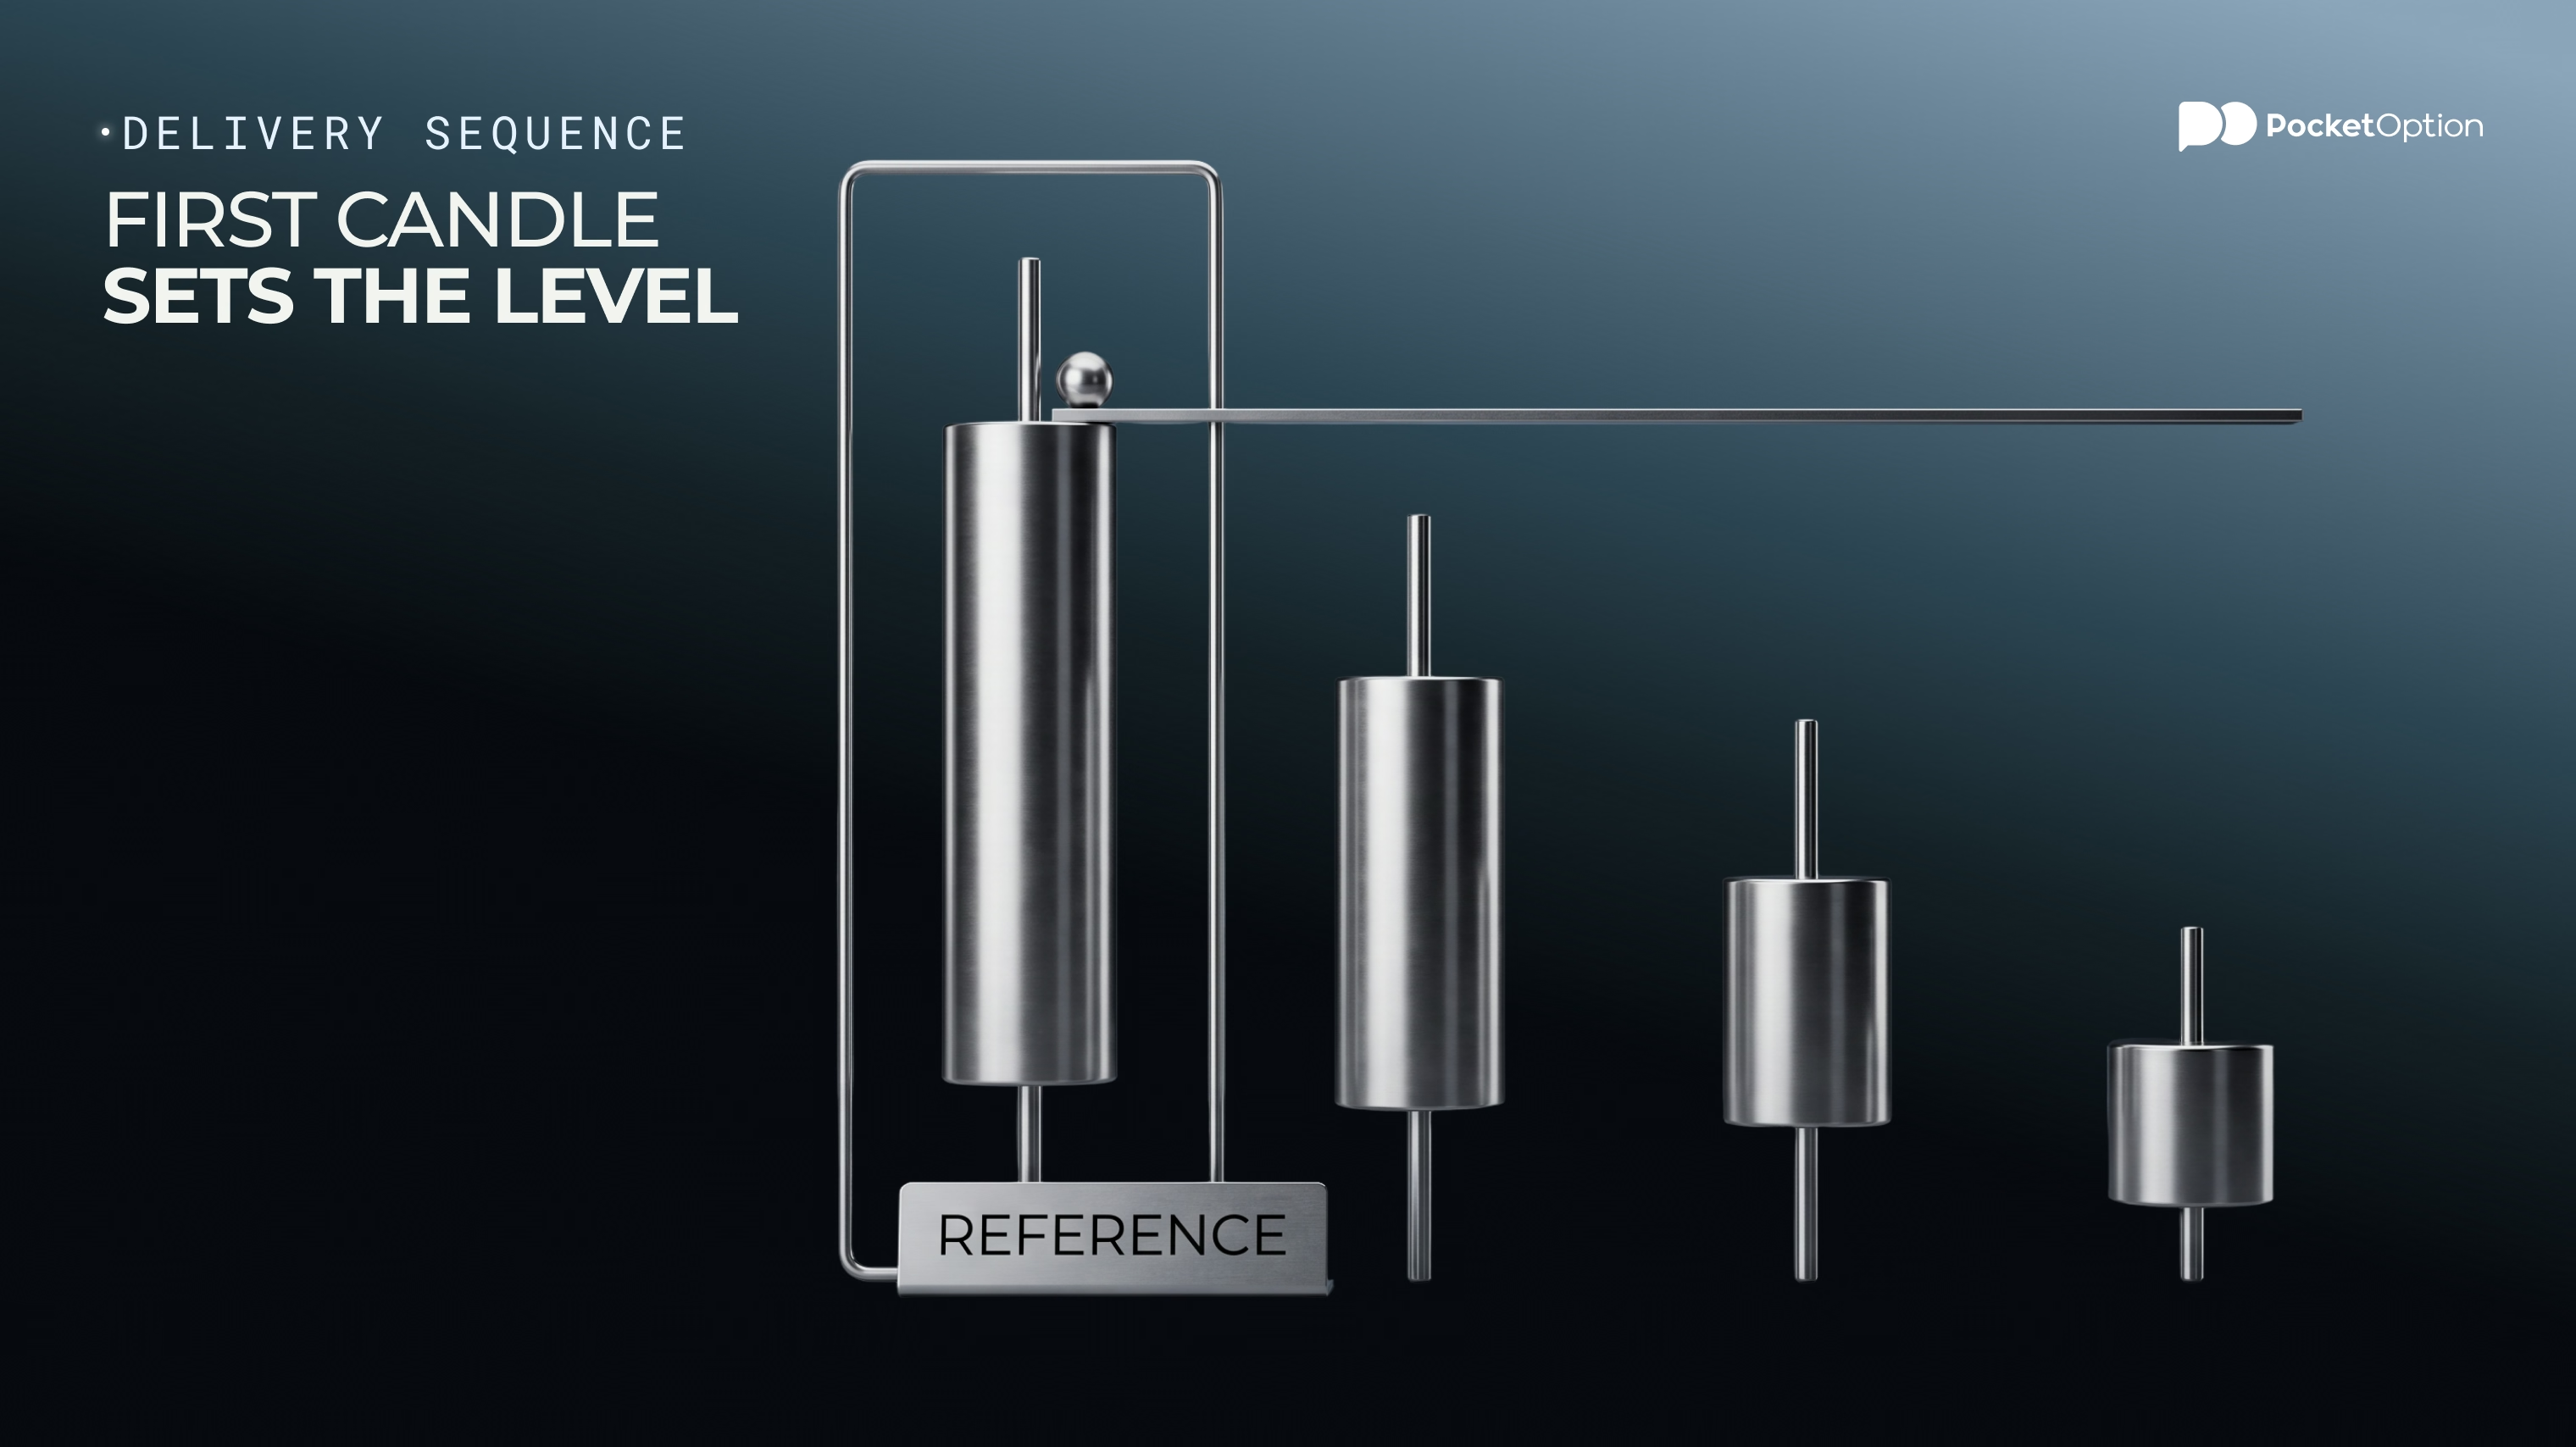
Everything begins with a continuous sequence. A bearish delivery is a run of consecutive down-close (red) candles. Each has to close below its open. A bullish delivery is the opposite, where all candles carrying the price are green, in a row. Just two candles can be a rather thin sequence, but three, four or more are considered quite solid, for the CISD identification at least. A price action like that deserves to be noticed, at least.
This sequence has to be visible on the timeframe you intend to trade/invest in. So if you use the 5-minute charts, a sequence has to appear on it. Otherwise, CISD sequences can appear anywhere, despite looking like noise on different timeframes.
How to Select the CISD Reference Level
Choosing the Reference Candle
The reference candle is the first candle that started the sequence. If a move was overall down, then this was the first candle that went down, beginning the bearish delivery. Small inside candles in the middle of the run don't reset it. But a full up-close candle that breaks the sequence, let alone goes above it, does.
Marking Its Opening Price
In order to use the CISD trading strategy, the candle opening price, starting price of the reference candle established in the previous step, has to get a horizontal line. That line will be our reference opening level, and for the signal, it will be the only price that matters. We will watch if that level gets crossed, and see how price behaves when it does so.
Applying One Consistent Selection Rule
Some traders take the reference to be the very first candle of the whole run. Others find it works best for them if they take the first candle of the final leg (after a small pause has happened). Both can work, depending on your setup. What counts is choosing one rule, writing it down, at least in your head, and applying it every time, consistently, without shifting it here and there. This way, this strategy can be properly tested and understood, as well as incorporated into your overall understanding of charts and price patterns.
in the Pocket Option terminal
Get StartedBullish CISD Formation
The Bearish Delivery Sequence
A bullish CISD happens after a bearish delivery. So price has to first fall through a run of down-close candles. Then, the so-called ‘change the state’ can happen.
The cleaner and longer the bear run would’ve been, the easier the level is to mark.
A Qualifying Close Above the Reference Opening Level
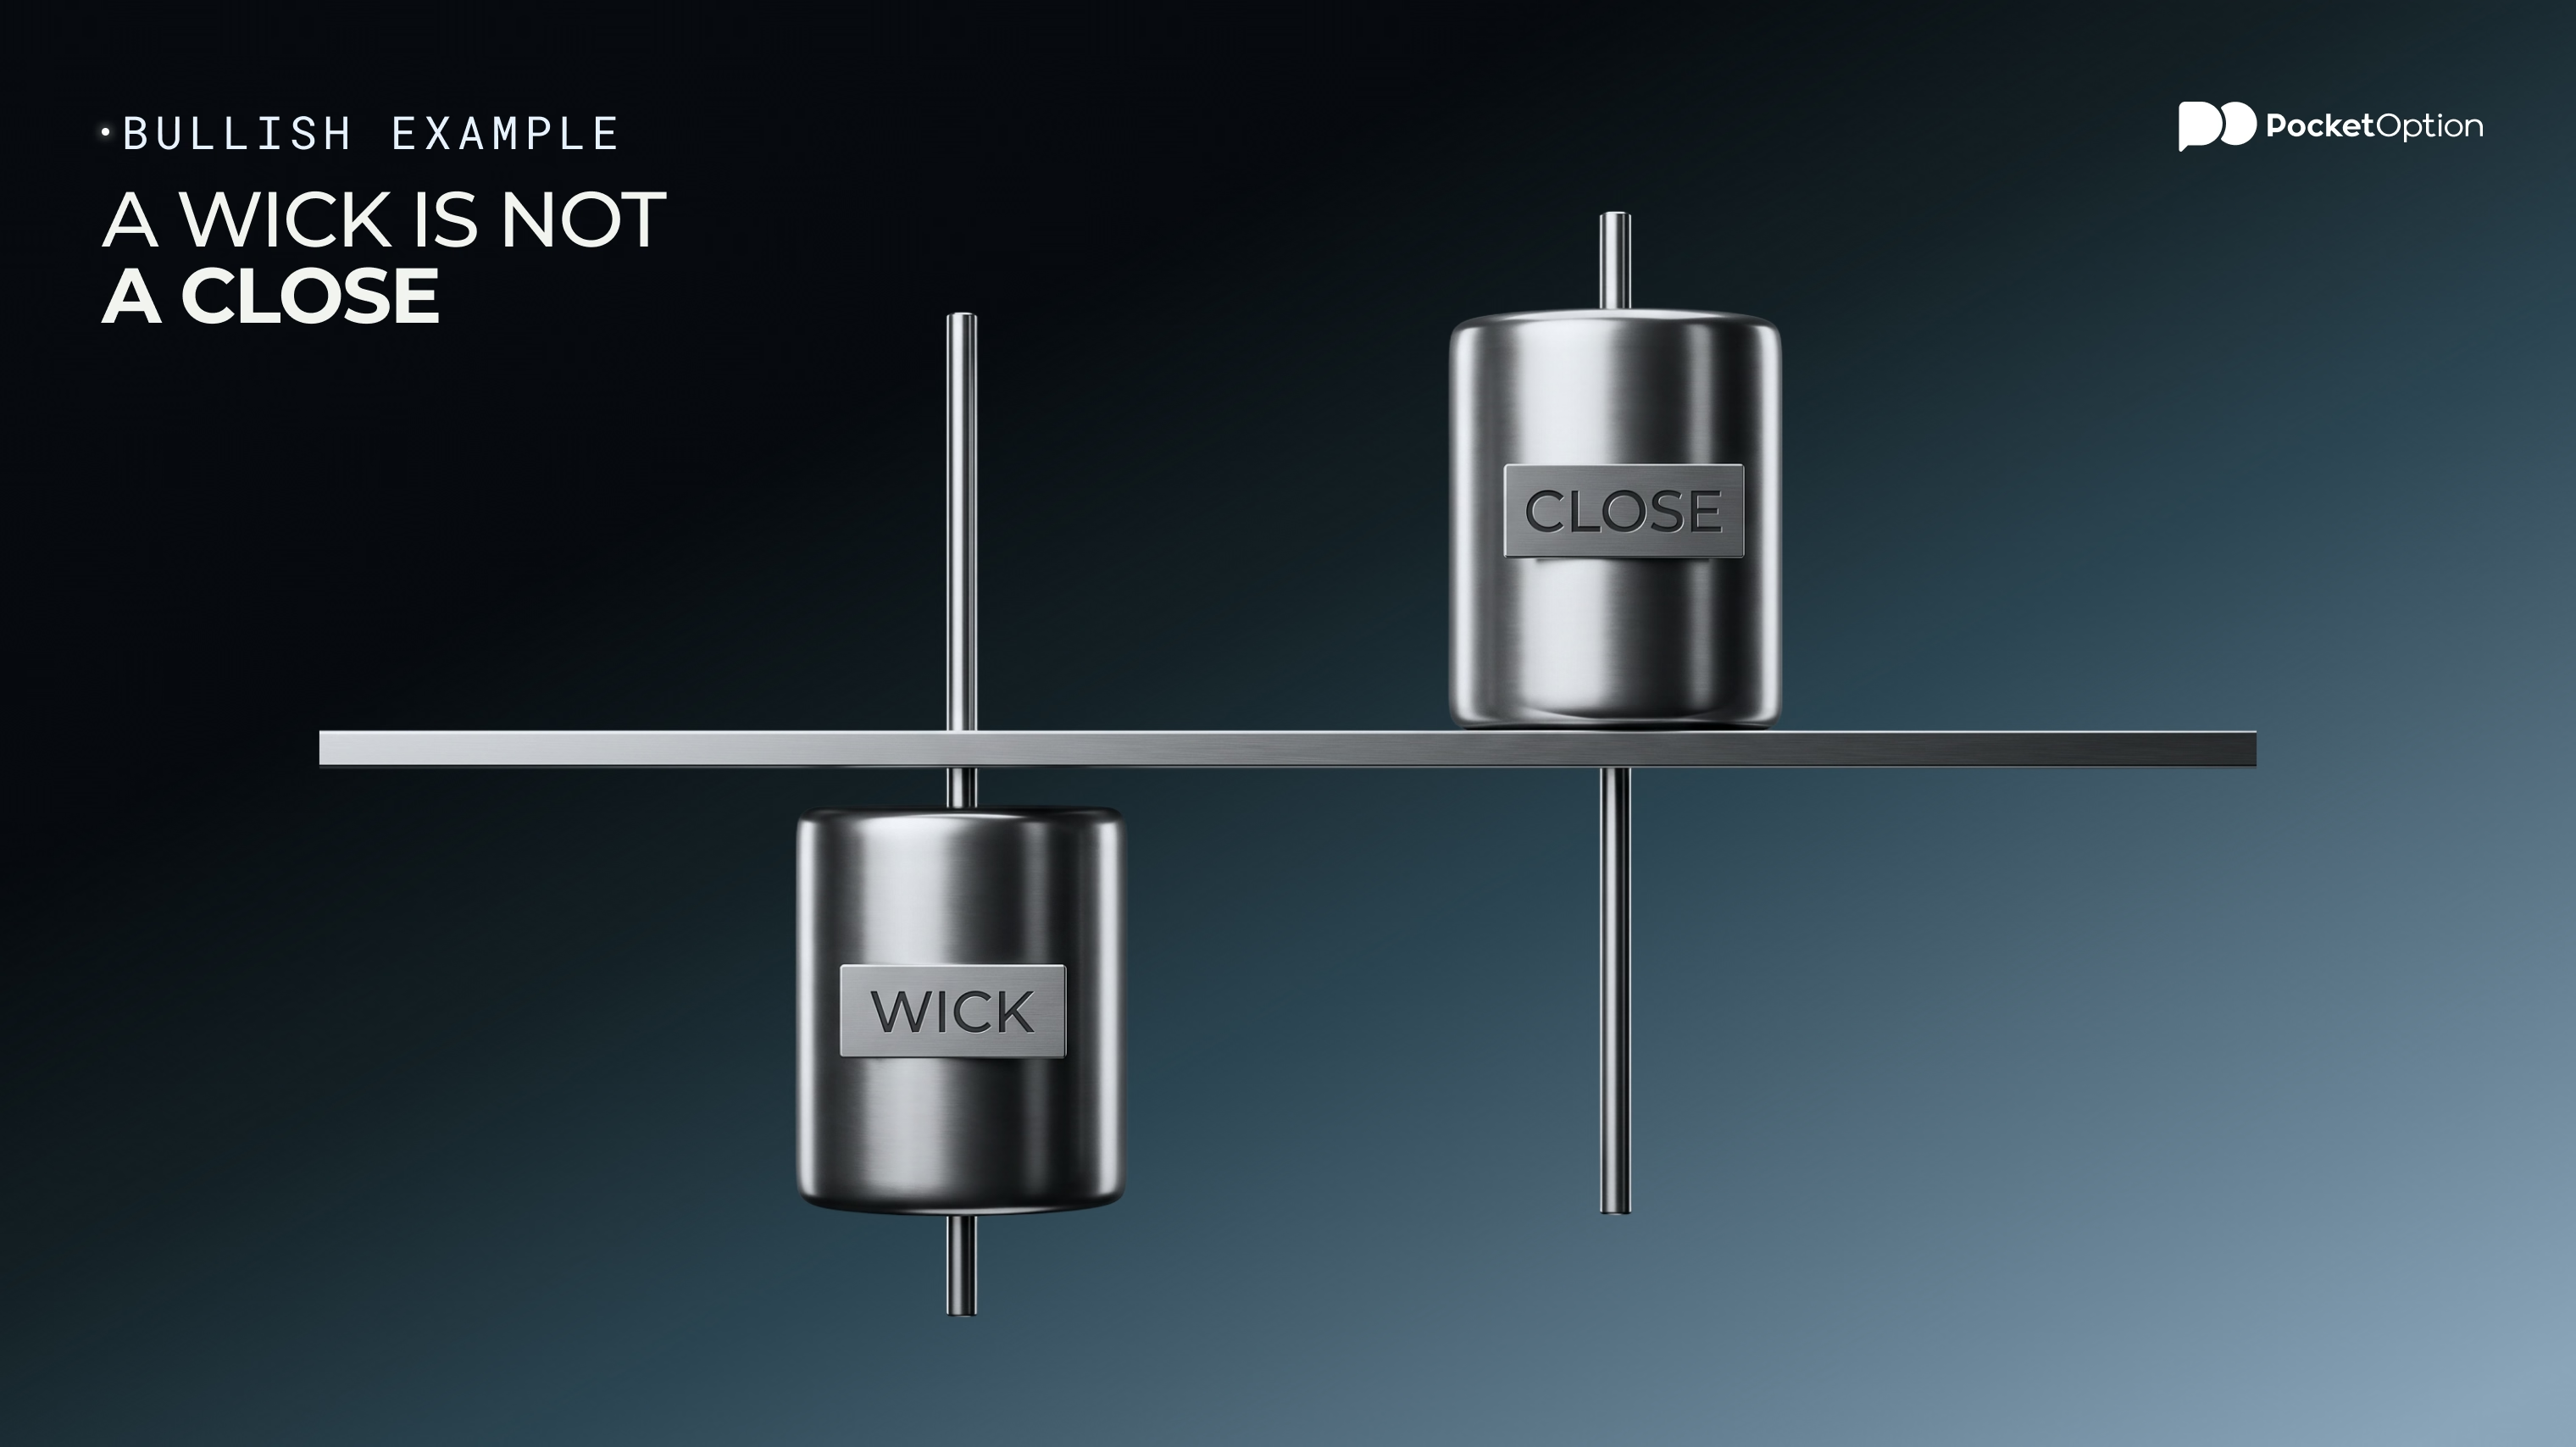
The signal happens when a candle manages to close above the reference opening level. This has to be a proper close though, not a touch and not a wick. A candle that just spikes through our marked line, and then falls back, is doing what is called an intrabar level crossing, and that doesn’t quite work in the CISD setups.
An Annotated Bullish Example
Let’s see an example of EUR/USD sequence on the 15M chart, marking each candle in a sequence:
Candle | Open | Close | What it shows |
|---|---|---|---|
C1 | 1.1752 | 1.1746 | First down-close candle, meaning the reference candle |
C2 | 1.1746 | 1.1741 | Bearish delivery continues |
C3 | 1.1741 | 1.1735 | Bearish delivery continues more |
C4 | 1.1735 | 1.1730 | Last candle of the bearish run |
C5 | 1.1730 | 1.1744 | Up-close candle, still below the level though |
C6 | 1.1744 | 1.1750 | Wick goes past 1.1752, but close stays below, so no signal yet |
C7 | 1.1750 | 1.1756 | Closes above reference, bullish CISD confirmed |
C6 is what catches many people off guard, since it briefly traded above the reference level, as a wick. On a live chart, this might look like a signal. But the close of the candle decided otherwise. Therefore, only C7 confirmed the CISD, because the bullish close actually happened.
Bearish CISD Formation
Flip everything. After a rally, say three up-close candles opening at 1.17600, 1.17640 and 1.17690 and closing at 1.17640, 1.17690 and 1.17730, the reference candle is the first of them and the reference opening level sits at 1.17600 here. A bearish CISD is confirmed when a candle closes below 1.17600, for instance at 1.17580. The high of the move, 1.17745 in this case, becomes the level that would cancel the idea if price climbed back above it. The logic is identical, only the direction changes, which is half the appeal of the method.
When Is a CISD Signal Confirmed?
Confirmation is a closed candle, on the chosen timeframe, beyond the reference opening level. A few practical points follow from that:
Wait for the candle to finish. Candle close confirmation means the timer on that candle has run out, not that price is above the line with ten seconds to go.
A wick through the level, the intrabar level crossing, does not count, however convincing it looked.
Use the body close, not the high or low, and keep that the same on every chart.
Did the close happen during a major news release? Then it deserves extra suspicion, spikes like that reverse often.
Confirmation says the delivery has shifted on that timeframe. It says nothing guaranteed about what comes next, and treating it like a promise is where most of the losses comes from.
Entry Conditions After CISD
CISD is not an entry, it’s an event. You have to have at least a few more conditions, before risking anything for a trade. For example, context, and location. ‘Context’ may mean that CISD happens near a level that matters. Like after a sweep of a prior low, or near a pivot point. ‘Location’ means waiting for price to pull back toward the reference opening level, instead of randomly chasing confirmation candles.
Still, telling a genuine turn from an ordinary pullback is a skill on its own, and rather a complex one. We covered it in depth in our guide on reversal and pullback trading, so take a read of that first.
For Quick Trading at Pocket Option, the picture changes a bit, again. A trade opened at, say, 1.1753 with a 5-minute expiry will profit only if price lands above 1.1753 when the timer ends. The CISD here can be completely valid, and the trade may still lose, because the pullback occurred at the wrong minute. Remember that an outcome of a fixed-expiry trade depends on price at one exact moment, and the two shouldn't be confused.
When to Invalidate or Cancel the Scenario
Write the exit conditions before the entry, and backtest them within your strategy. Typical exit conditions may include:
Price actually closes back beyond the reference opening level. This may say that the shift didn't hold.
Price trades through the swing extreme of the original delivery. In this case, it’s likely best, again, to write the whole idea off.
The sequence was not pretty clear to begin with. It’s best to risk real funds only when the setup is clear.
Confirmation came only on a news spike, and that spike is already retracing.
Keeping each loss planned, and within a fixed fraction of the account, is what lets a method survive runs like that, which is the point of careful position sizing.
CISD vs BOS and CHoCH
CISD, break of structure and change of character are somewhat similar candlestick pattern scenarios, so let’s understand the difference between all 3 of them.
Signal | Reference level | Confirmation criterion |
|---|---|---|
CISD | Opening price of the first candle in the opposing delivery sequence | Candle closes beyond that opening level |
BOS | Previous swing high/low, in the direction of the trend | Break beyond the swing point (close or wick, depending on trader's rules) |
CHoCH | Swing point that held the current trend | Break of that swing point against the trend |
CISD level quite often ends up being closer to current price, than a swing point. That’s why it can trigger earlier than 2 other patterns (although not always). You may treat them as different measurements of the same chart, and use whichever one you like or understand more.
Testing CISD Rules on a Demo Account
Rules mean little until they've been run through a decent sample. A demo account lets that happen without paying for the lessons, and a workable plan looks like this:
Fix the timeframe, the asset and the reference-candle rule before the first trade.
Define confirmation as a body close beyond the level, and write the invalidation conditions next to it.
For Quick Trading, fix the expiry too, so results can be compared from one setup to the next.
Journal every setup: successful, failed and skipped, with the reason for skipping.
After 50 or more entries, review: how often did the chart confirm and the trade still lose at expiry?
That last question separates chart behavior from trade outcome, and it's usually the most revealing line in the whole journal. This guide to backtesting trading strategies goes further into keeping such a log honest, skipped setups included.
Conclusion
CISD marks a price delivery shift. There was a run of same-color candles (all red or all green), and now the newest candle managed to close beyond the opening price of the first candle that started that run. Means the market is likely experiencing a change in tone, and this can be used for the short-term trading setups, as well as finding some investment opportunities (if the candles in question are D1 or even weekly candles, for example). Set invalidation in advance, backtest your strategy, and try CISD on demo before committing any real funds to the trade.
for free with Pocket Option
Try DemoDisclaimer: This article is for informational purpose only, and does not constitute investment or trading advice. Remember that doing so could involve a risk of losing capital.
See more:InterestingTrading Strategies